This is where this plugin called Spacetree developed in Javascript that allows us to display the information in the form of a tree, dynamically and intuitively, from organizational structures or information directories Spacetree does. 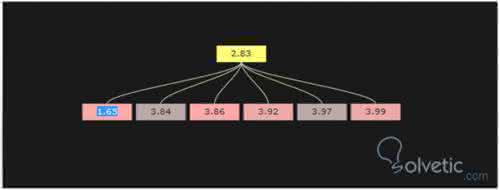
- 1- First we create our JSON , it is the one that will contain all the data to be displayed in our tree, we must be careful to establish the correct structure and maintain the father-son relationship in our JSON .
var json = { id: "node02", name: "0.2", data: {}, children: [{ id: "node13", name: "1.3", data: {}, …. - 2 - Create the instance of the Spacetree component and associate it with a selector in this case the id of an element:
var st = new $ jit.ST ({ injectInto: 'infovis', ... - 3 - We add some additional options such as the duration of the animation and the distance between each parent node and its child:
duration: 800 transition: $ jit.Trans.Quart.easeInOut, levelDistance: 50, - 4 - Then we configure the style for the nodes and the axes; height, length, color and type of shape that can vary from rectangular to circular, it is important to mention that for each node to have an individual style the overridable option must have the value true :
Do not give: { height: 20, width: 60, type: 'rectangle', color: '#aaa', overridable: true }, Edge: { type: 'bezier', overridable: true }, - 5 - With the method onCreateLabel we assign all the events and handlers of our tree, as well as being able to assign styles to the labels in each node:
onCreateLabel: function (label, node) { label.id = node.id; label.innerHTML = node.name; label.onclick = function () { if (normal.checked) { st.onclick (node.id); } else { st.setRoot (node.id, 'animate'); } }; var style = label.style; style.width = 60 + 'px'; style.height = 17 + 'px'; style.cursor = 'pointer'; style.color = '# 333'; style.fontSize = '0.8em'; style.textAlign = 'center'; style.paddingTop = '3px'; }, - 6 - With the onBeforePlotNode method the properties of a node are changed before being drawn, such as changing the color of a node depending on its position or how many children it has.
onBeforePlotNode: function (node) {
if (node.selected) {
node.data. $ color = "# ff7";
}
else {
delete node.data. $ color;
if (! node.anySubnode ("exist")) {
var count = 0;
node.eachSubnode (function (n) {count ++;});
node.data. $ color = ['#aaa', '#baa', '#caa', '#daa', '#eaa', '#faa'] [count];
}
}
},
- 7 - With the onBeforePlotLine method, the properties of the axes are changed before being drawn:
onBeforePlotLine: function (adj) { if (adj.nodeFrom.selected && adj.nodeTo.selected) { adj.data. $ color = "#eed"; adj.data. $ lineWidth = 3; } else { delete adj.data. $ color; delete adj.data. $ lineWidth; } } }); - 8 - Finally we load the JSON data:
st.loadJSON (json); The final result would be the following: 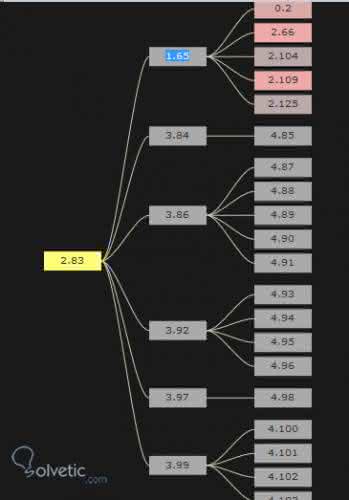
Here the complete source code for you to try it for yourselves: var st = new $ jit.ST ({ injectInto: 'infovis', duration: 800 transition: $ jit.Trans.Quart.easeInOut, levelDistance: 50, Navigation: { enable: true, panning: true }, Do not give: { height: 20, width: 60, type: 'rectangle', color: '#aaa', overridable: true }, Edge: { type: 'bezier', overridable: true }, onBeforeCompute: function (node) { Log.write ("loading" + node.name); }, onAfterCompute: function () { Log.write ("done"); }, onCreateLabel: function (label, node) { label.id = node.id; label.innerHTML = node.name; label.onclick = function () { if (normal.checked) { st.onclick (node.id); } else { st.setRoot (node.id, 'animate'); } }; var style = label.style; style.width = 60 + 'px'; style.height = 17 + 'px'; style.cursor = 'pointer'; style.color = '# 333'; style.fontSize = '0.8em'; style.textAlign = 'center'; style.paddingTop = '3px'; }, onBeforePlotNode: function (node) { if (node.selected) { node.data. $ color = "# ff7"; } else { delete node.data. $ color; if (! node.anySubnode ("exist")) { var count = 0; node.eachSubnode (function (n) {count ++;}); node.data. $ color = ['#aaa', '#baa', '#caa', '#daa', '#eaa', '#faa'] [count]; } } }, onBeforePlotLine: function (adj) { if (adj.nodeFrom.selected && adj.nodeTo.selected) { adj.data. $ color = "#eed"; adj.data. $ lineWidth = 3; } else { delete adj.data. $ color; delete adj.data. $ lineWidth; } } }); st.loadJSON (json); st.compute (); st.geom.translate (new $ jit.Complex (-200, 0), "current"); st.onclick (st.root);