There are some occasions where the page or website needs to extend this functionality and Google maps does not provide it. On these occasions we can use Polymaps , a free and open source Javascript library with which we can implement maps of any type and functionality on our website.
Polymaps is ideal for displaying information in different levels of countries, cities and even individual streets, this thanks to its SVG ( Scalable Vector Graphic s) technology, which is nothing more than an XML- based vectorized image format which provides the support for the interaction and animation of graphics in two dimensions, and seeing that Polymaps goes a little bit, let's see its methods, controls and some examples of the implementation of it.
Instantiating Polymaps
Each Polymap starts with an instance of the map () method, but before we build a map we import the namespace into a local variable: var po = org.polymaps; Polymaps does not use the traditional Javascript constructors, in that case Polymaps provides us with methods that instantiate the methods internally. Additionally, it uses the chain of methods, all methods return the instance of map (). We can also insert in a new SVG document and then add a tag to the image:
var map = po.map () .container (document.body.appendChild (po.svg ("svg"))) .add (po.image (). url (...)) We can also not send anything in the container method and the map instance will return the value associated with the field and will serve as both setter and getter: map.container ();
Layers
In the simplest cases, the maps have a single layer but they can consist of multiple layers that are on top of each other, the accepted parameters are the following: - {X} - Coordinate of the Column.
- {Y} - Coordinate Row.
- {B} - Table delimiter.
- {Z} - Zoom level.
- {S} - Host.
Having seen the general concept, let's see the examples with their complete implementation code:
Pale Dawn
This map has a restricted design that works well with tons of information points, it is more focused on highlighting the foreground information. This map is built with a single layer, coordinates and has some basic interactive controls, it is a good starting point to start customizing it: 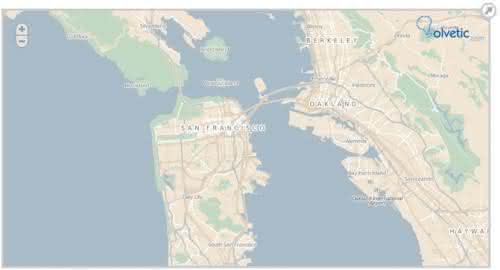
Here the complete source code:
var po = org.polymaps; var map = po.map () .container (document.getElementById ("map"). appendChild (po.svg ("svg"))) .add (po.interact ()) .add (po.hash ()); map.add (po.image () .url (po.url ("http: // {S} tile.cloudmade.com" + "/ 1a1b06b230af4efdbb989ea99e9841af" // http://cloudmade.com/register + "/998/256/{Z}/{X}/{Y}.png") .hosts (["a.", "b.", "c.", ""]))); map.add (po.compass () .pan ("none")); Now let's see a much more complete example Tile Grid
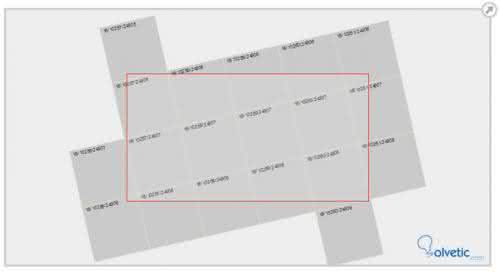
In this example we have different zoom types, as well as the management of different layers, additionally we can rotate the area of ​​the map and thus be able to see other areas in it, let's see some captures of it: 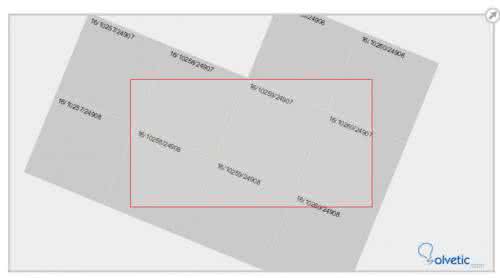
And finally the source code so you can try it for yourselves:
var po = org.polymaps; var div = document.getElementById ("map"), svg = div.appendChild (po.svg ("svg")), g = svg.appendChild (po.svg ("g")); var map = po.map () .container (g) .tileSize ({x: 128, y: 128}) .angle (.3) .add (po.interact ()) .on ("resize", resize); resize (); map.add (po.layer (grid)); var rect = g.appendChild (po.svg ("rect")); rect.setAttribute ("width", "50%"); rect.setAttribute ("height", "50%"); function resize () { if (resize.ignore) return; var x = div.clientWidth / 2, y = div.clientHeight / 2; g.setAttribute ("transform", "translate (" + (x / 2) + "," + (y / 2) + ")"); resize.ignore = true; map.size ({x: x, y: y}); resize.ignore = false; } function grid (tile) { var g = tile.element = po.svg ("g"); var rect = g.appendChild (po.svg ("rect")), size = map.tileSize (); rect.setAttribute ("width", size.x); rect.setAttribute ("height", size.y); var text = g.appendChild (po.svg ("text")); text.setAttribute ("x", 6); text.setAttribute ("y", 6); text.setAttribute ("dy", ".71em"); text.appendChild (document.createTextNode (tile.key)); } var spin = 0; setInterval (function () { if (spin) map.angle (map.angle () + spin); }, 30); function key (e) { switch (e.keyCode) { case 65: spin = e.type == "keydown"? -.004: 0; break; case 68: spin = e.type == "keydown"? .004: 0; break; } } window.addEventListener ("keydown", key, true); window.addEventListener ("keyup", key, true); window.addEventListener ("resize", resize, false);