When it is within our administration and support tasks to verify the status of services and roles of servers or client computers with Linux environments , we have a series of alternatives to access detailed information about everything that happens internally. In fact, the system itself offers us commands such as top, htop, atop to have this information and from there carry out the required administration processes..
It is for this reason that today TechnoWikis will talk about a tool that is much more detailed than these integrated Linux commands and is Hegemon.
What is hegemon?
Hegemon is an application focused on monitoring the modular system; which is written in Rust programming language. All your information is collected through the use of variables such as chan, termion, systemstat, and sensor.
With this utility we can access details such as:
- CPU usage, memory and swap usage monitoring.
- Configurable data collection update interval whose default value is 3 seconds.
- You can monitor the system temperature and fan speeds.
- It is able to carry out unit tests.
- The data flow can be expanded in order to access a more detailed graphical display of the data.
- Clean MVC architecture with high code quality.
In the short term they plan to integrate more functions such as:
- Support of macOS and BSD since today it is only compatible with Linux.
- Ability to select and reorder data flows.
- Possibility of monitoring the disk and network I / O and using GPU.
1. How to install Hegemon on Linux
Hegemon requires Rust 1.26 or later and development files for libsensors. These files can be found in the package repository of each distribution such as lm_sensors-devel in Fedora and libsensors4-dev in Ubuntu.
Step 1
For the installation of these files, we will execute one of the following lines based on the distribution used:
CentOS / RHEL
yum install lm_sensors-devel
Fedora
dnf install lm_sensors-devel
Debian / Ubuntu
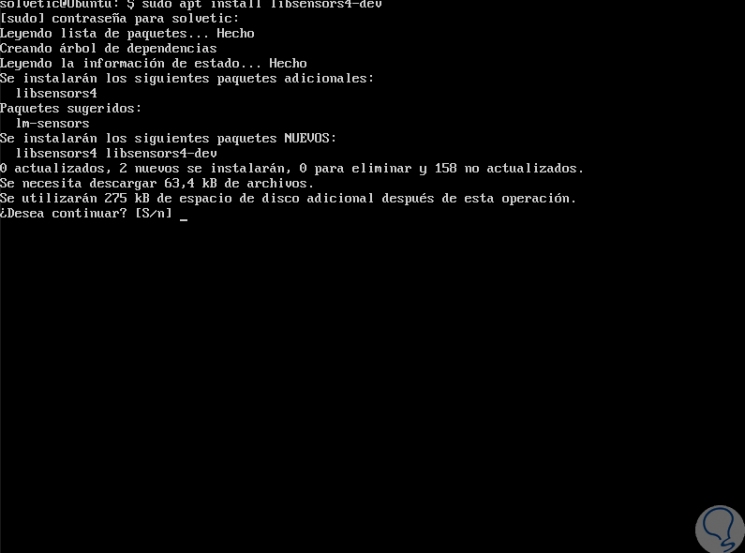
apt install libsensors4-dev
Enter the letter S to confirm the download and installation
Step 2
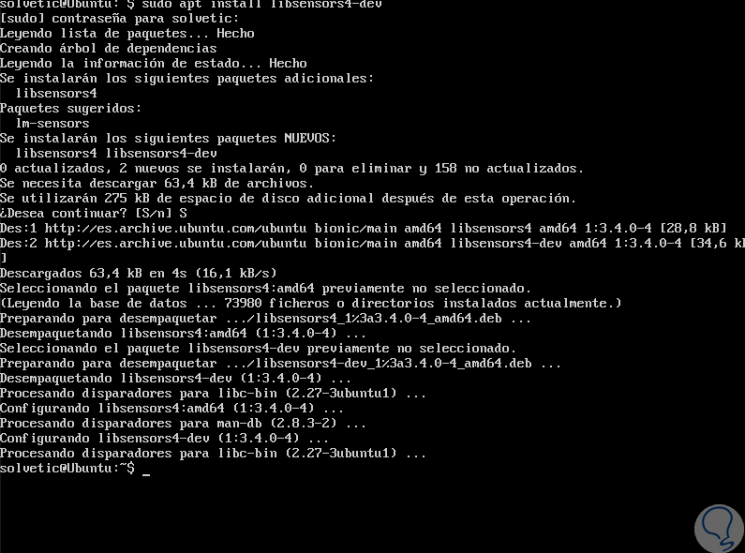
Once finished it will look like this:
Step 3
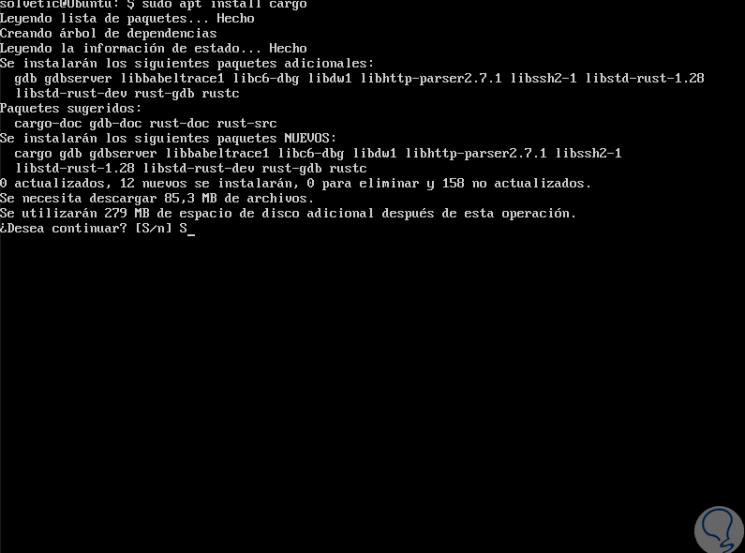
Once Rust is installed, it is time to perform the Hegemon installation through the Rust package manager called charge. To do this we must first install charge with the following line:
sudo apt install charge
There we enter the letter S to confirm the download and installation.
Step 4
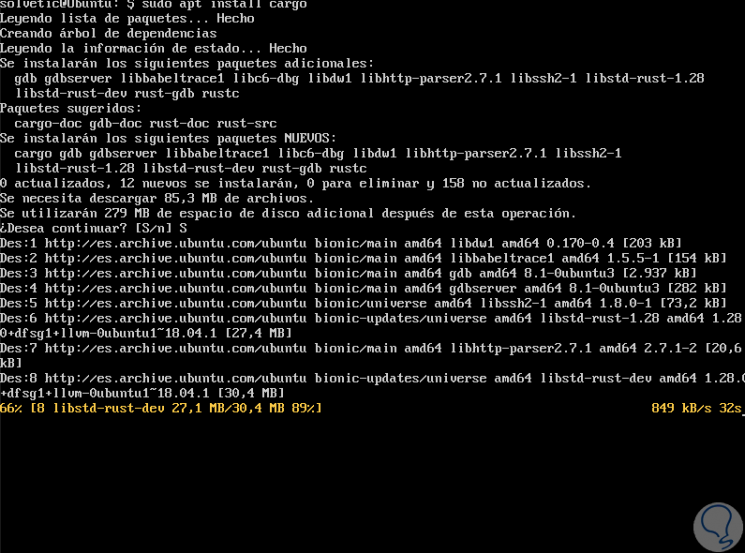
We can see that the installation process begins.
Step 5
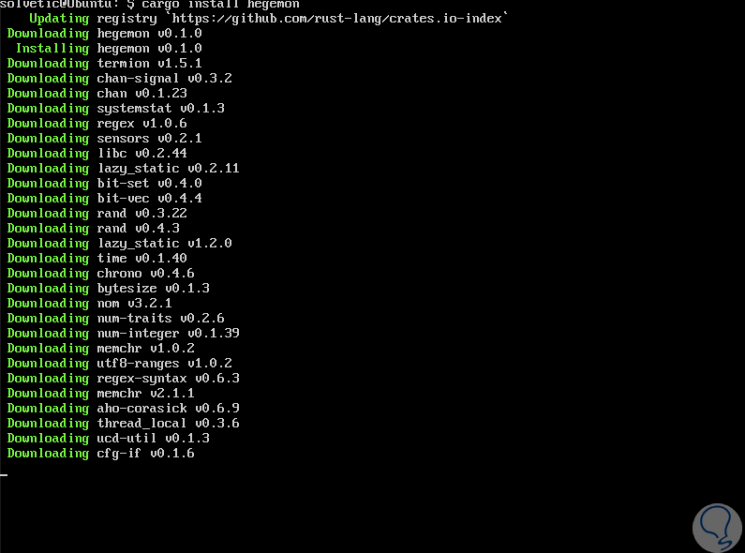
Now we will use the Rust package manager, charge, to carry out the installation of Hegemon:
install hegemon charge
There we see that the process of downloading the respective add-ons of the utility begins.
Step 6
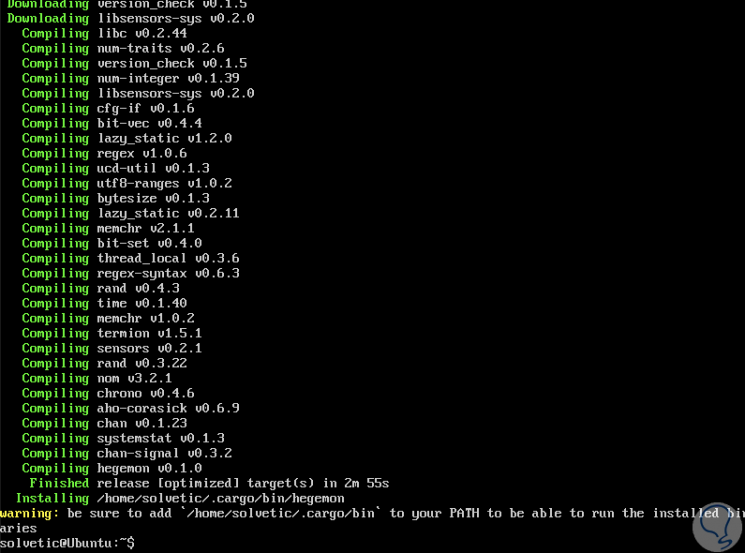
Once this process is finished we will see the following:
Step 7
Once this process is completed, we proceed to run the utility with the following line:
Hegemon
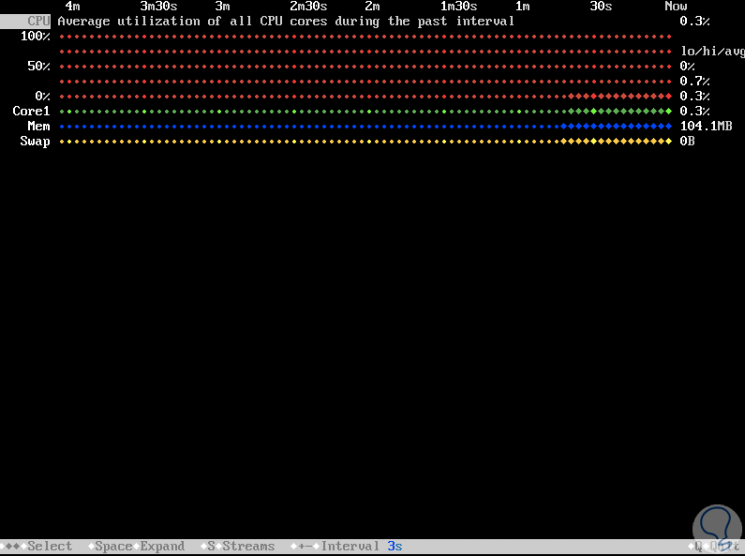
By default the following will be displayed. There we find the following sections:
CPU
This line displays the CPU usage
Core num
It shows the use of the CPU core based on the number of available CPUs.
Mem
Indicates memory usage
Swap
It allows us to see the use of exchange memory .
Step 8
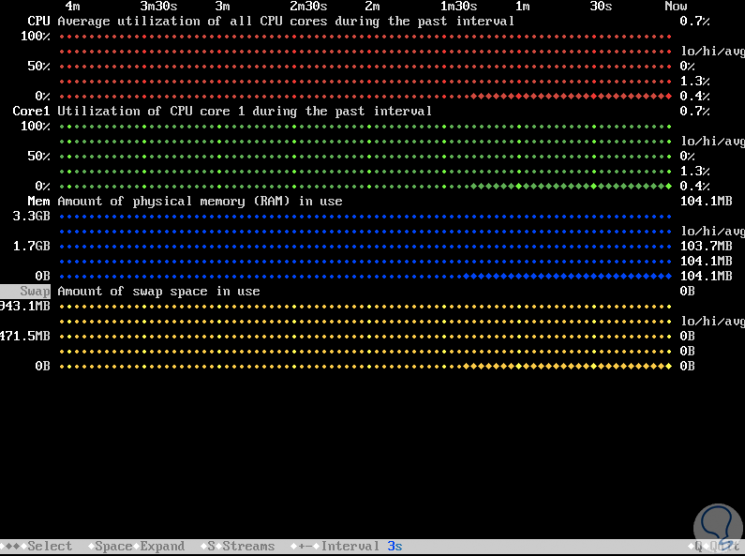
To expand each section, we must select it and press the "Space" key on our keyboard in order to access more detailed information on the use of the selected resource in Linux. We can increase or decrease the update interval, using the + and - keys on the keyboard. We can also see in detail each aspect of the system with its current capacities and percentages of use.
Important note
If at the time of executing the hegemon command the order error not found is generated, we must execute the following:
export PATH = "$ HOME / .cargo / bin: $ PATH"
2. How to add new parameters in Hegemon (Linux)
While the common monitoring commands as top, which has been developed to show specific metrics such as CPU and memory usage, the Hegemon utility goes much further; since it displays the output of the monitoring modules, which are called data flows. The behavior of these flows is defined by a function called Stream.
To use a new Stream, you only need to provide some basic properties such as name and description, and a method that allows you to retrieve a numerical data value. From this moment on, everything else will be managed by Hegemon, including the scheduling of updates, design and representation, as well as the calculation of statistics..
Stream objects are managed by StreamProviders which allows sequences to be determined at runtime.
To add this type of Stream you need
- Allow this to return Stream objects from the flow method.
- Register the supplier in suppliers /mod.rs.
In the following link we find an example of GitHub on how to add a new Stream for Hegemon and thus have the possibility and the ability to display much more information than the default one:
Stream Hegemon example
With Hegemon, we have a practical utility to access practical information for system monitoring..