One of the most ideal objectives when we manage Linux operating systems so that the startup of these is as fast as possible with the purpose that all services and processes load optimally and so we can start working soon on the multiple tasks that we must execute..
When we use a distribution with systemd, we have an option to analyze clearly how the boot is working thanks to the systemd-analyze command and therefore today TechnoWikis will make a complete analysis on how to use this alternative and thus detect any type of anomaly or error during the boot process.
What is systemd-analyze
This command is responsible for analyzing and debugging the system administrator in multiple Linux distributions.
1. How to use systemd-analyze on Linux
Step 1
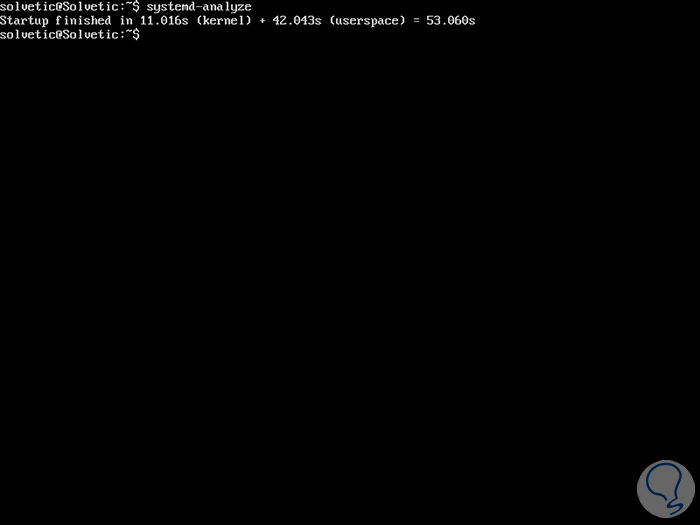
Its use is simple, for example, if we want to obtain general information about the operating system startup time, we must execute the following command:
systemd-analyze
We must execute this without any argument, this will list information about the total time it took to start each service, including the time spent by kernel, initrd and user space during startup:
Step 2
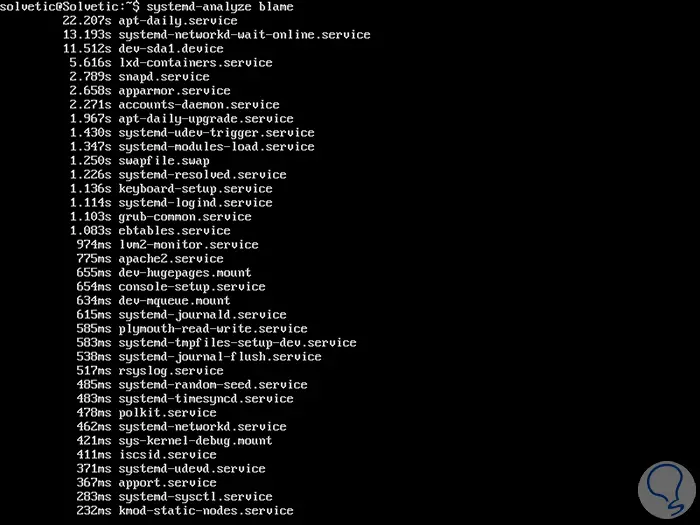
If we wish to obtain a list of all the units in execution, ordered by the time it takes to initialize, in descending order, the blame subcommand is useful to access this information, we will execute the following;
systemd-analyze blame
Step 3
We can see in this information that each unit is ordered according to the time taken, this is practical for management tasks since it was simple to find out which service takes more time to start and analyze the problem specifically about it.
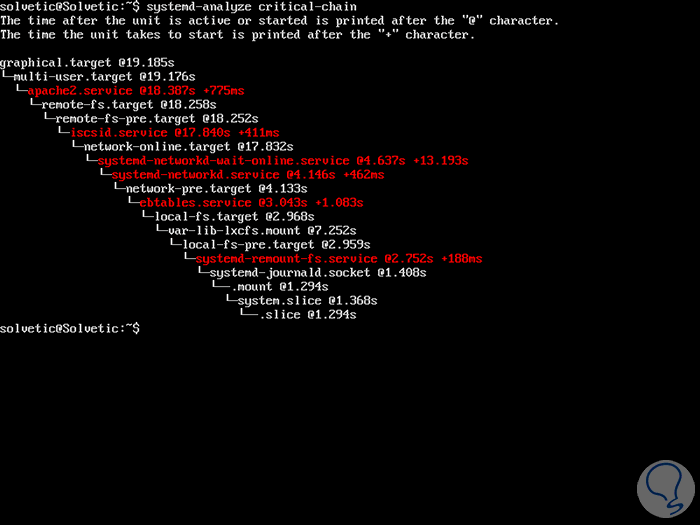
If the objective is to see a tree associated with the critical time chain for a fixed objective or a list of specific units, we must use the critical-chain parameter as follows:
systemd-analyze critical-chain
Step 4
If you wish to obtain information about a specific service, we must execute the following syntax:
systemd-analyze critical-chain "name" .service
To view information from a remote host through the ssh protocol, we must use the -H flag and indicate the user @ host directive as well.
systemd-analyze blame -H [email protected] systemd-analyze critical-chain -H [email protected]
2. General syntax of systemd-analyze
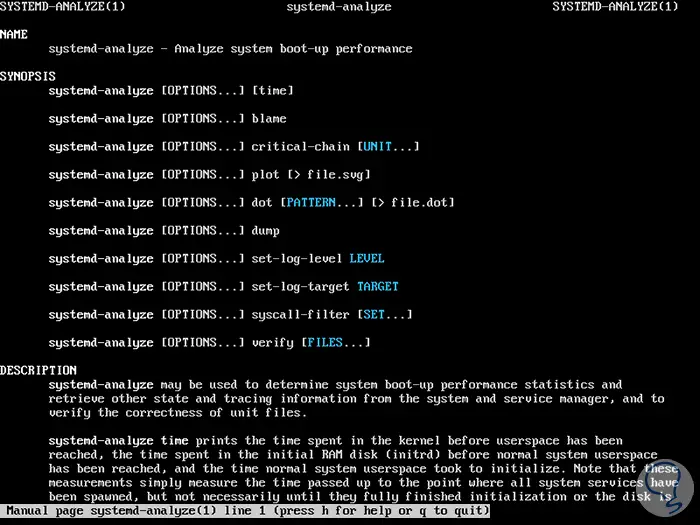
To work with systemd-analyze in an integral way, we can use the following command to see your options:
man systemd-analyze
The available options will be:
This option prints the time generated in the kernel before the user space has been reached, the time spent on the initial RAM disk (initrd) before the normal user space of the system has been reached and the time that the space Normal system user took initialization to get access.
systemd-analyze [OPTIONS ...] [time]
This option prints a list of all the units in execution, sorted by the time it takes to initialize, with this information it will be possible to optimize the starting times.
systemd-analyze [OPTIONS ...] blame
Using this option, a tree of the time-critical unit chain is printed. The time after the unit is active or started will be printed after the "@" character. The time it takes for the unit to start will be printed after the "+" character.
systemd-analyze [OPTIONS ...] critical-chain [UNIT ...]
With this parameter, an SVG graphic is printed that indicates in detail what system services have been started and at what time, highlighting the time spent on initialization.
systemd-analyze [OPTIONS ...] plot [> file.svg]
With this value, a description of the textual dependency graph in point format is generated for further processing with the GraphViz dot tool.
systemd-analyze [OPTIONS ...] dot [PATTERN ...] [> file.dot]
With this value, a readable serialization is generated for the users of the complete state of the server.
systemd-analyze [OPTIONS ...] dump
When using this parameter, a list of all directories from which the drive files are located is displayed.
systemd-analyze [OPTIONS ...] unit-paths [
With log-vel, the current record level of the systemd daemon is printed.
systemd-analyze [OPTIONS ...] log-level [LEVEL]
With the log-target value, the current registration target of the systemd daemon is printed.
systemd-analyze [OPTIONS ...] log-target [TARGET]
With this value, all system calls stored in the set of calls from the specified SET system or all known sets will be listed if no set is indicated. Argument SET must include the prefix "@".
systemd-analyze [OPTIONS ...] syscall-filter [SET…]
This value will load files from the drive and print warnings if errors are detected in it.
systemd-analyze [OPTIONS ...] verify [FILES ...]
Thus, we have seen how to implement and use systemd-analyze in Linux distributions and thus take much more direct control over the boot of this..