When performing administration tasks in Linux environments it is ideal and advisable to have tools and utilities that allow us to have a much more precise control over the data to be analyzed since we simplify and organize our task allowing us to obtain much more accurate results..
One of these utilities is iostat and today in TechnoWikis we will analyze how we can use it to obtain direct, clear and totally reliable reports of the elements that we manage in our organization regardless of the distribution used, in this case we will use Ubuntu 17.10 Server.
What is iostat
Iostat (input / output statistics) is a utility through which it will be possible to obtain information about system input and output components by giving the administrator or user the possibility to identify performance problems of both the local disk, remote disks or general information of the operating system.
By using this command, it can be used to control the load of the system input / output device by observing the time that these devices are active in relation to their average transfer rates within the system..
When we use iostat, it will be possible to generate reports that can be used to change the system configuration and balance the input and / or output load between physical disks in a much more efficient way.
The first report generated by the iostat command gives us statistics on the general time since the system startup process started, so each subsequent report covers the time elapsed since the previous report; All statistics will be informed every time we execute the iostat command..
This report consists of a row of CPU header followed by a row of CPU statistics and, if we have multiprocessor systems, CPU statistics are calculated throughout the system as averages among all existing processors and then a row of Device headers followed by a line of statistics for each configured device.
1. Install iostat on Ubuntu 17.10
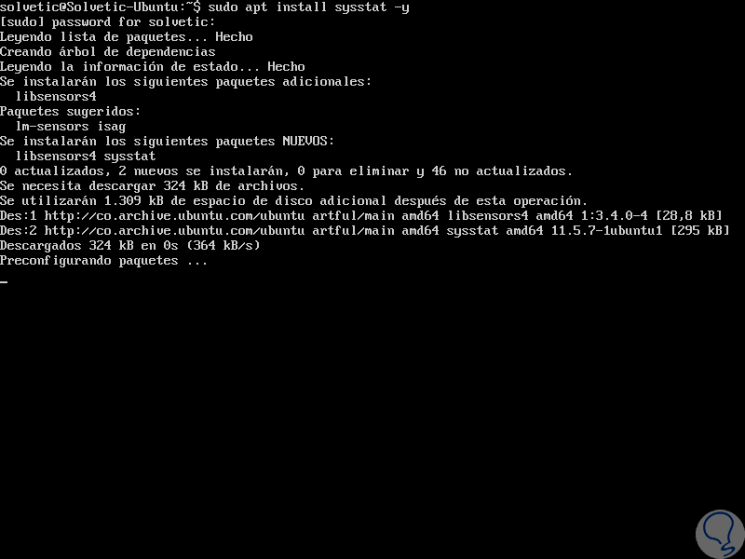
By default in this distribution, iostat is included in the Ubuntu sysstat package and we can install it simply by running the following command:
sudo apt install sysstat -y
2. Use iostat in Ubuntu 17.10
Step 1
The first command we can execute is iostat which will display information about CPU usage and Ubuntu 17.10 I / O statistics:

Step 2
There we will see details such as:
- In the first line the version of the Linux kernel and the host name.
- In the next two lines we will see CPU statistics, such as the average CPU usage, the percentage of time that the CPU was idle and the I / O response, the percentage of virtual CPU timeout and the percentage of time that the CPU is idle within the system.
- In the last two lines we can see the device usage report, such as the number of read and write blocks per second and the total block and write readings per second that have been executed in said device.
Step 3
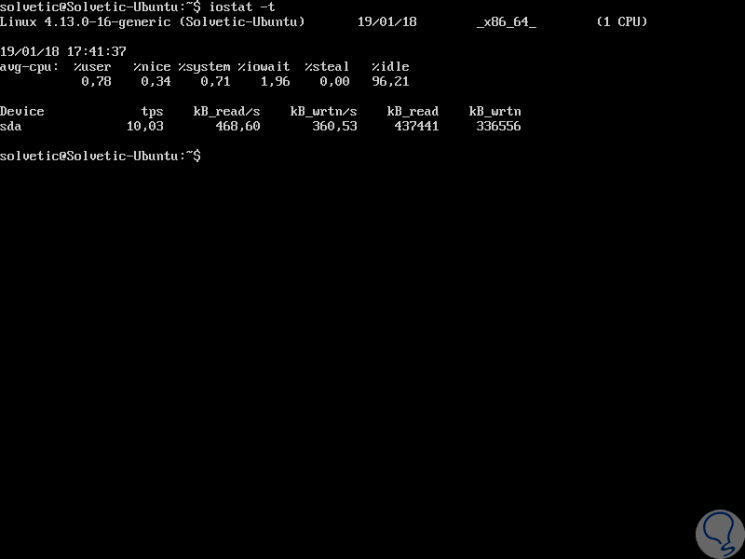
By default, the iostat command generates the report with the current date, so if we want to display the current time, it will be necessary to use the following command:
iostat -t
Step 4
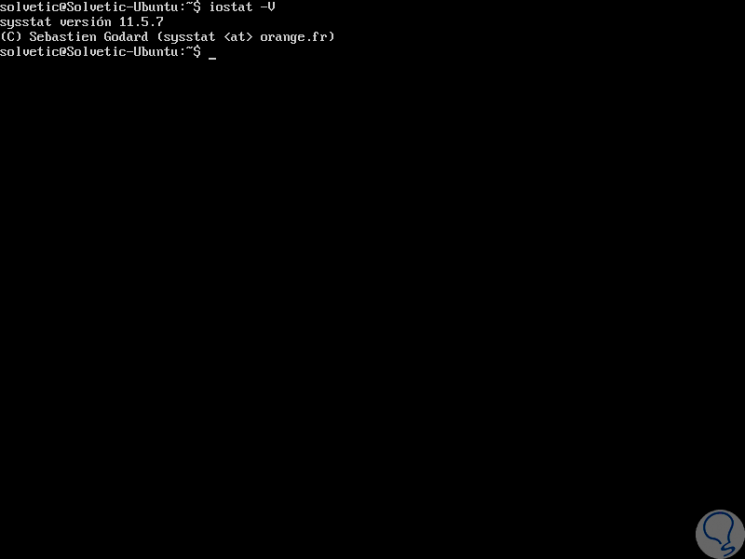
At the moment we want to verify the iostat version, just execute the following:
iostat -V
Step 5
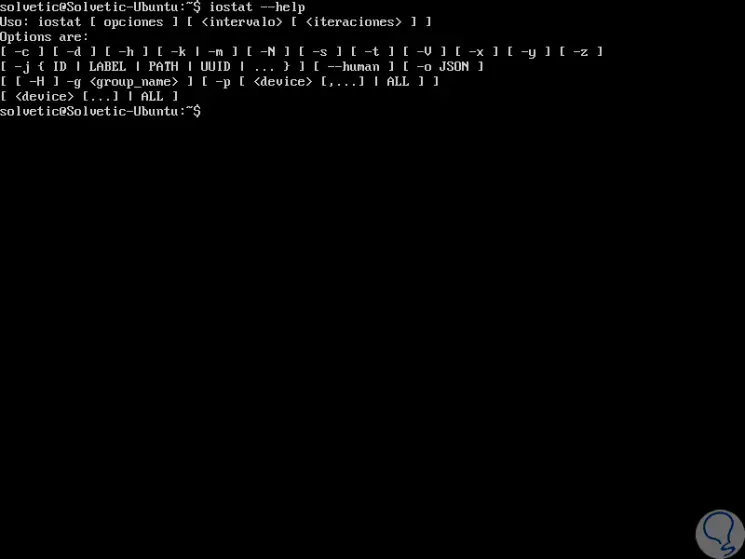
It is not worth mentioning that, to see all the options, which we will indicate later, we can use the following line:
iostat –help
3. Use iostat advanced mode in Ubuntu 17.10
In some cases we can make use of some slightly more advanced parameters depending on the type of requirement requested, some of these options are as follows.
Step 1
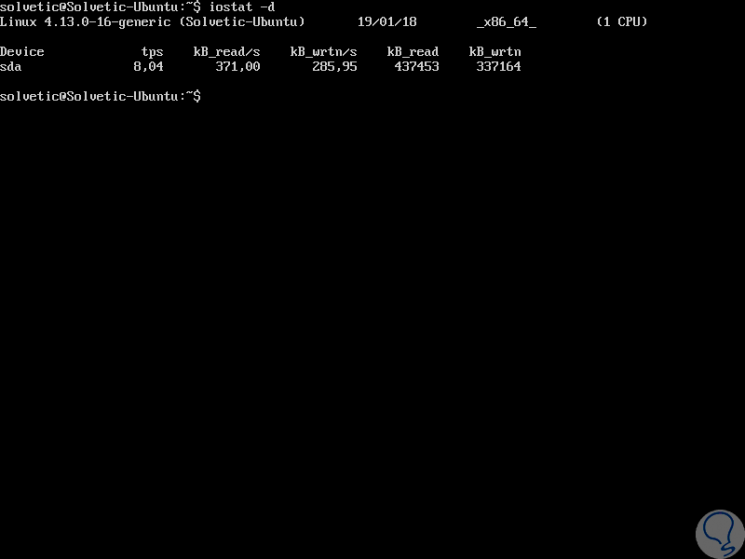
If we want to see the report of a device only once, we will execute the following command:
iostat -d
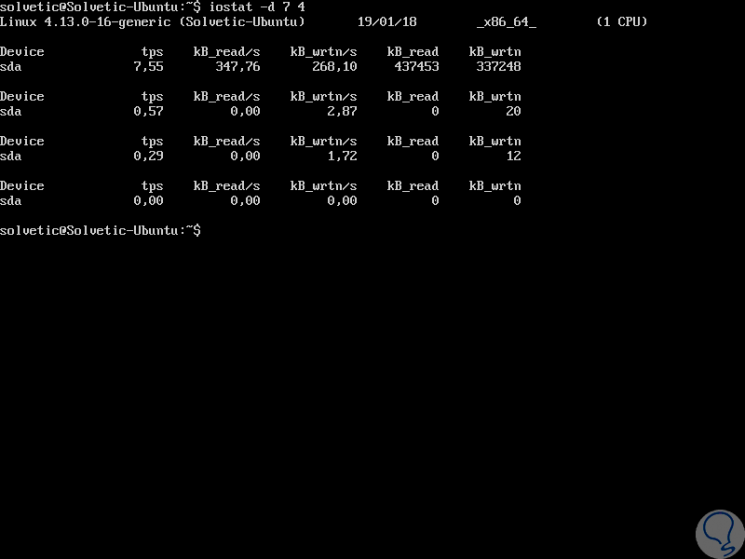
Step 2
To see the report of this device continuously every 7 seconds, for 4 consecutive times we will execute the following line:
iostat -d 7 4
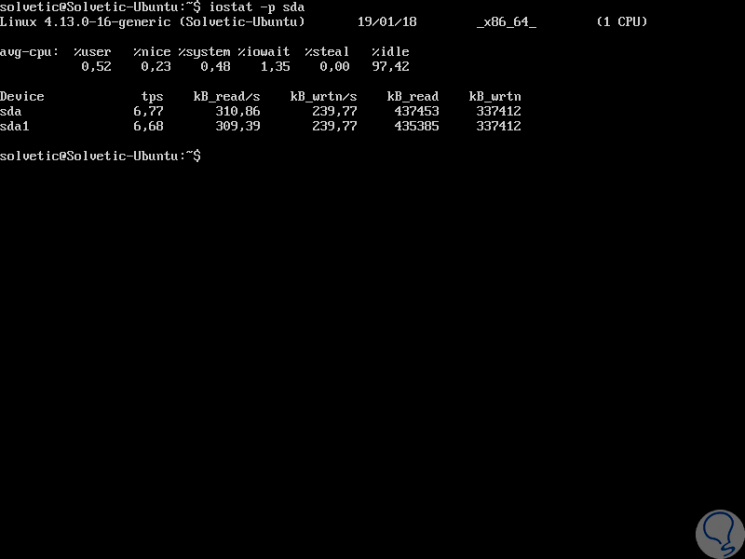
Step 3
If we want to see the statistics of specific devices, we will use the following command:
iostat -p sda
Step 4
We can see the statistics of several devices at the same time by executing the following:
iostat -p sda, sdb, sdc
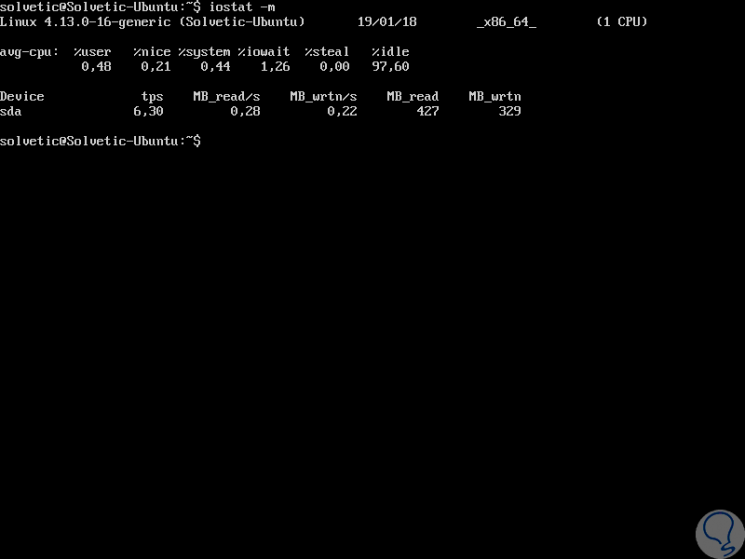
Step 5
To obtain the device I / O statistics in MB / second, we will execute the following command:
iostat -m
Step 6
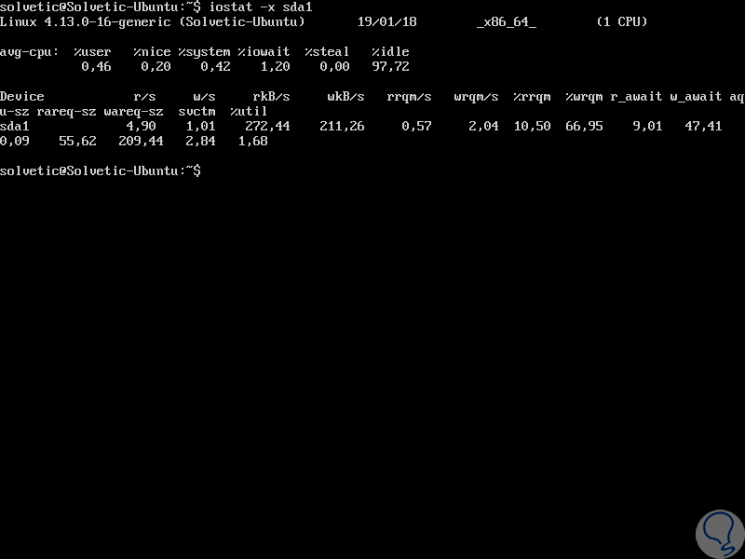
To obtain the specific information of an extended partition we must use the following command:
iostat -x “partitionâ€
Step 7
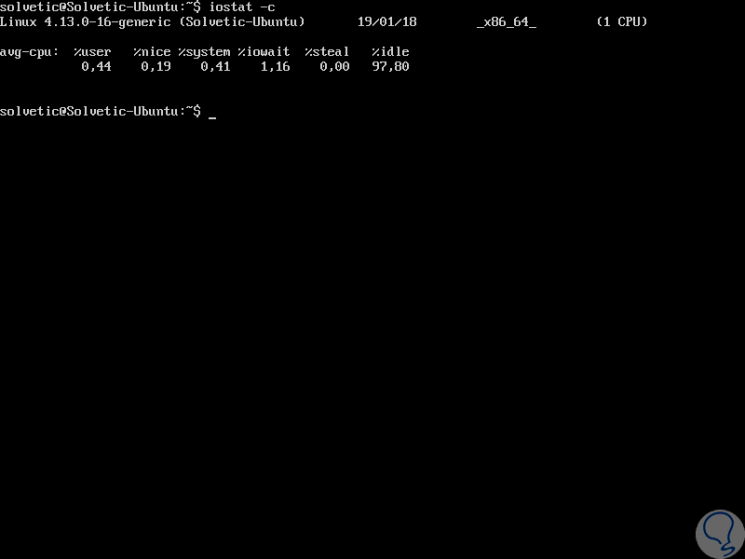
To display the CPU usage statistics the command to be used will be the following:
iostat -c
4. Reports of iostat in Ubuntu 17.10
Now, we can see that each one of the options to be used is practical, but each line contains a certain value that at first glance we will not be able to understand very well, that is why TechnoWikis will explain what each of these values ​​means to better understand the results generated by iostat understanding that the iostat command generates three types of reports that are:
- The network file system report
Step 1
Now, the values ​​are as follows. In the first report generated by the iostat command, we have details of CPU utilization. For multiprocessor systems, CPU values ​​are global averages among all active processors. The report has the following format:
% user
Displays the percentage of CPU usage that occurred during execution at the user level (application).
% nice
It reflects the percentage of CPU usage that occurred when running at the user level with high priority.
% system
Shows the percentage of CPU usage that occurred during execution at the system level (kernel).
% iowait
Displays the percentage of time that the CPU or CPUs were idle during which the system had a pending disk I / O request.
% steal
Displays the percentage of time spent in an involuntary wait for the virtual CPU or CPU while the hypervisor was servicing another virtual processor.
% idle
Shows the percentage of time that the CPU or CPUs were idle and in which the system did not have a pending disk I / O request.
Step 2
The second report generated by the iostat command is the Device Utilization Report in this device report statistics are provided by physical device or by partition. The report can show the following fields, depending on the indicators used:
Device
This column provides the name of the device (or partition), which is shown as hdiskn for 2.2 cores, for the nth device. It is shown as devm-n with 2.4 cores, where m is the main number of the device and n a distinctive number. With newer kernels, the device name will be displayed as shown in the / dev directory.
tps
Indicates the number of transfers per second that entered the device. A transfer is an I / O request to the device, this can be combined with multiple logical requests in a single I / O request for the device. A transfer is of indeterminate size.
Blk_read / s
It refers to the amount of data read from the device expressed in a number of blocks per second. The blocks are equivalent to sectors with 2.4 and later kernels and, therefore, have a size of 512 bytes. With older cores, a block has an undetermined size.
Blk_wrtn / s
Indicates the amount of data written on the device expressed in several blocks per second.
Blk_read
It is the total number of blocks read.
Blk_wrtn
It is the total number of written blocks.
kB_read / s
Indicates the amount of data read from the device expressed in kilobytes per second.
kB_wrtn / s
Indicates the amount of data written on the device expressed in kilobytes per second.
kB_read
It is the total amount of kilobytes read.
kB_wrtn
It is the total amount of kilobytes written.
MB_read / s
Refers to the amount of data read from the device expressed in megabytes per second.
MB_wrtn / s
Refers to the amount of data written from the device expressed in megabytes per second.
MB_read
It is the total amount of megabytes read.
MB_wrtn
It is the total amount of megabytes written.
rrqm / s
It is the number of merged read requests per second that were queued for the device.
wrqm / s
It is the number of merged write requests per second that were queued for the device.
r / s
It is the number of read requests that were issued to the device per second.
w / s
It is the number of write requests that were issued to the device per second.
rsec / s
They are the number of sectors read from the device per second.
wsec / s
They are the number of written sectors of the device per second.
rkB / s
They are the amount of kilobytes read from the device per second.
wkB / s
They are the number of kilobytes written of the device per second.
rMB / s
They are the amount of megabytes read from the device per second.
wMB / s
They are the number of megabytes written of the device per second.
avgrq-sz
It is the average size (in sectors) of the requests that were issued to the device.
avgqu-sz
It is the average queue duration of the requests that were issued to the device.
await
It is the average time (in milliseconds) for the I / O requests issued for the device to be served in the system.
svctm
It is the average service time (in milliseconds) for the I / O requests that were issued to the device.
%Useful
Indicates the percentage of CPU time during which I / O requests were issued to the device (use of bandwidth for the device). Device saturation occurs when this value is close to 100%.
Step 3
The third iostat report is the Network File System (NFS) report which provides statistics for each network file system mounted on the system. The report shows the following fields:
Filesystem
This column displays the host name of the NFS server followed by a colon and the name of the directory where the network file system is mounted.
rBlk_nor / s
Indicates the number of blocks read by applications through the call system reading interface, a block has a size of 512 bytes.
wBlk_nor / s
Indicates the number of blocks written by applications through the call interface of the writing system.
rBlk_dir / s
Refers to the number of blocks read from open files with the O_DIRECT indicator.
wBlk_dir / s
Indicates the number of blocks written in open files with the O_DIRECT indicator.
rBlk_svr / s
It refers to the number of blocks read from the server by the NFS client through an NFS read request.
wBlk_svr / s
Indicates the number of blocks written to the server by the NFS client through an NFS WRITE request.
ops / s
Indicates the number of operations that were issued to the file system per second.
rops / s
Indicates the number of 'read' operations that were issued to the file system per second.
wops / s
Refers to the number of 'write' operations that were issued to the file system per second.
5. General parameters of iostat in Ubuntu 17.10
The parameters that we can use with iostat are:
-C
Generate the CPU usage report.
-d
Generate the device usage report.
-h
It allows the NFS report to be displayed by option: it is easier for a human to read.
-k
Display statistics in kilobytes per second instead of blocks per second. The data shown is valid only with kernels 2.4 and later.
-m
It generates statistics in megabytes per second instead of blocks or kilobytes per second. The data shown is valid only with kernels 2.4 and later.
-n
Displays the network file system (NFS) report. This option only works with kernel 2.6.17 and later versions.
-p
[{device [, ...] | ALL}]: The -p option displays the statistics of the block devices and all their partitions that are used by the system. If we add a device name on the command line, statistics and all its partitions will be displayed. Finally, the keyword ALL indicates that statistics should be displayed for all devices and block partitions defined by the system.
-t
Print the time of each report that is generated. The time stamp format may depend on the value of the environment variable S_TIME_FORMAT.
-V
Print the used iostat version.
-x
Display extended statistics.
-z
Tell iostat to skip the output of any device for which there is no activity during the selected sample period.
As we see, iostat is more than just a simple utility of the system, we must make the most of it and thus administer our operating systems in a much more complete way.