Managing and managing the hardware of a system is not as simple a task as it seems, this is because many times when performing audit tasks, a detailed report of the elements in a system is required (it covers both hardware and software) and This becomes a really complex task since we must know brands, versions, status, etc., of many components and it is natural that the vast majority of opportunities this information is not endorsed by us..
To prevent this from happening, TechnoWikis will explain with this tutorial how you can access all the information on the hardware of your Linux system and thus have the best information that will be useful in many moments of work.
For this tutorial we will use Ubuntu 20.04 ..
What is Hardinfo
Hardinfo is a utility that has been developed in order to provide the user with a complete detailed summary of the system components , this will help avoid headaches when accessing this information manually.
Later we will see all the kinds of details that this utility provides us.
1. How to install Hardinfo Linux
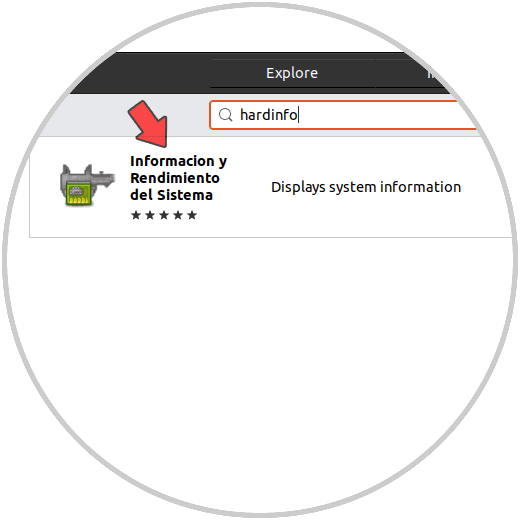
Step 1
To install this utility we have two options, the first is to access the Ubuntu Software Center and search for the utility there:
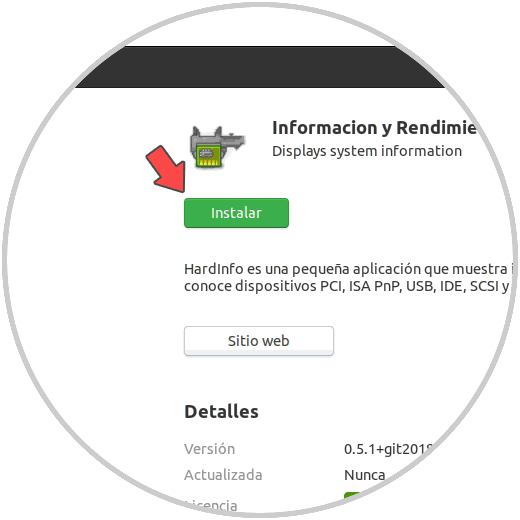
Step 2
We select the application and then click on the "Install" button:
Step 3
The next available method is through the terminal, for this we access the terminal console and execute the following:
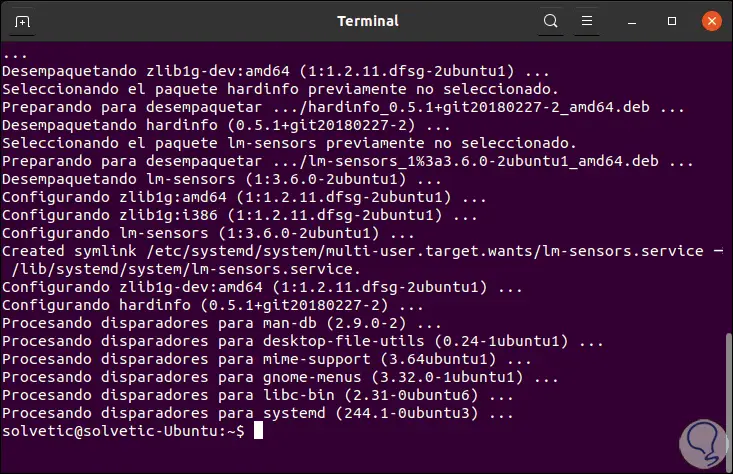
sudo apt install hardinfo
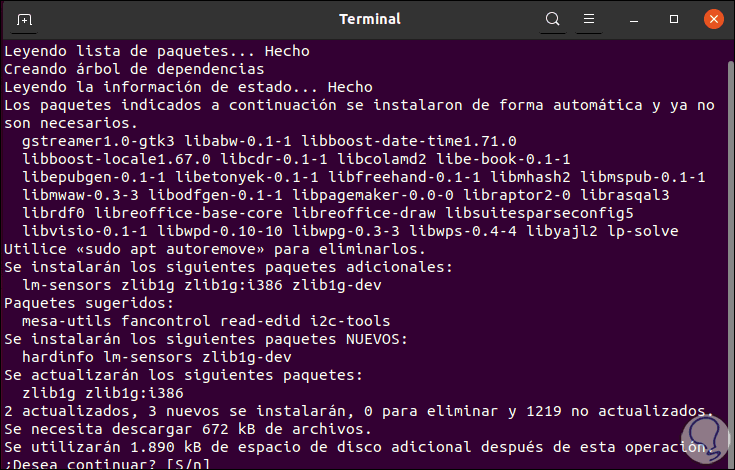
Step 4
We enter the letter "s" to confirm the download and installation of Hardinfo in the system:
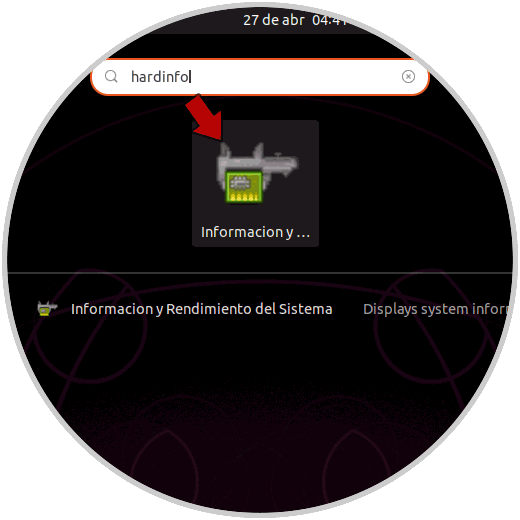
2. How to use Hardinfo Linux
Step 1
Once Hardinfo is installed we go to activities to search for it and launch it from there. The scanning process does not take long to yield the results of Linux hardware and software.
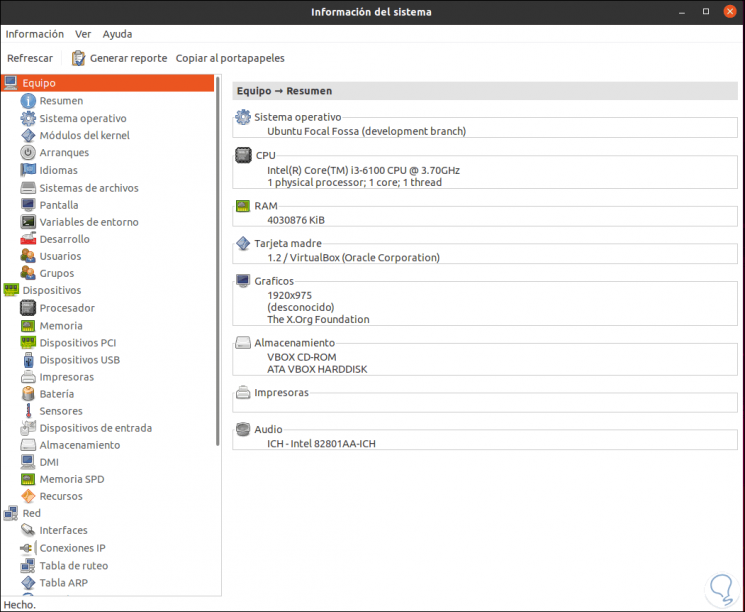
Step 2
We can see that in the lateral column is by categories (Equipment / network / Devices), in the section "Equipment we find specific details such as:
- Type of operating system used
- CPU installed with technical specifications of the same
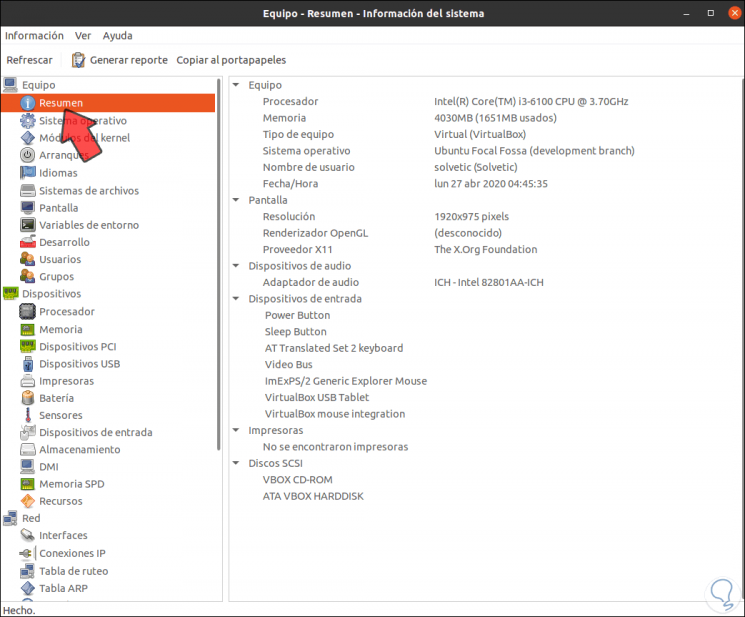
Step 3
If we access "Summary" we find these more simplified details:
Step 4
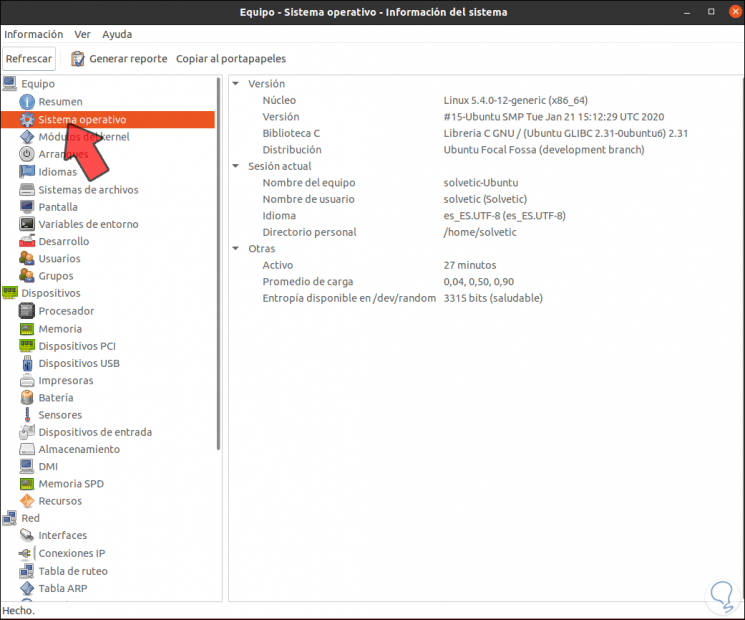
In the "Operating system" section we access all the technical details of the system such as:
Step 5
There are, in this same segment, other ideal variables to manage such as:
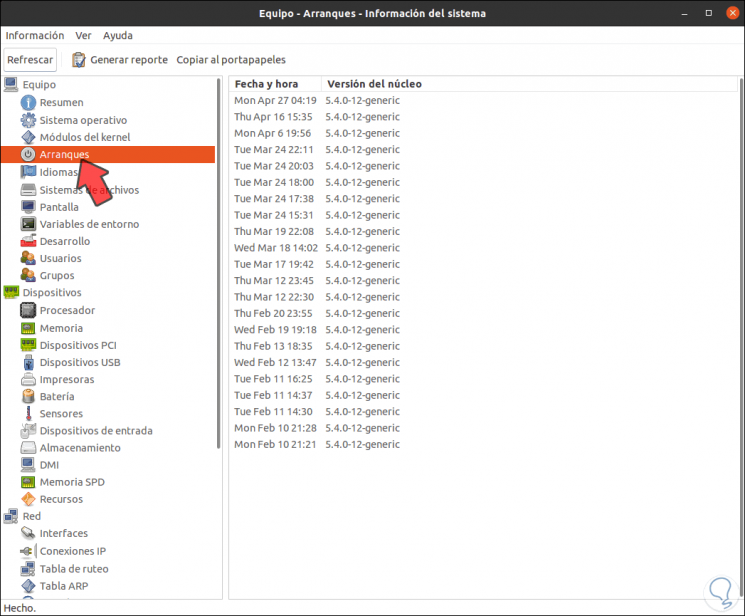
"Starts" where we see the date and time of each session with the respective kernel that was used:
Step 6
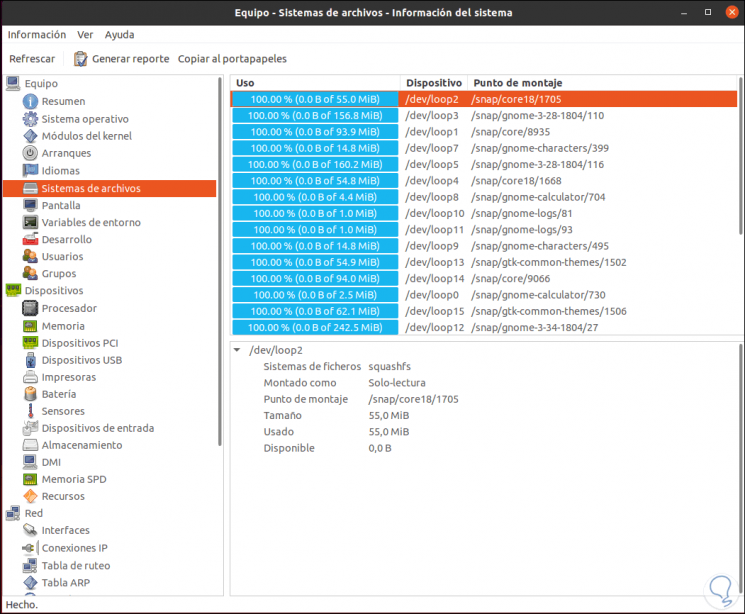
"File systems" where we find a complete summary of the use, mount point and device used:
Step 7
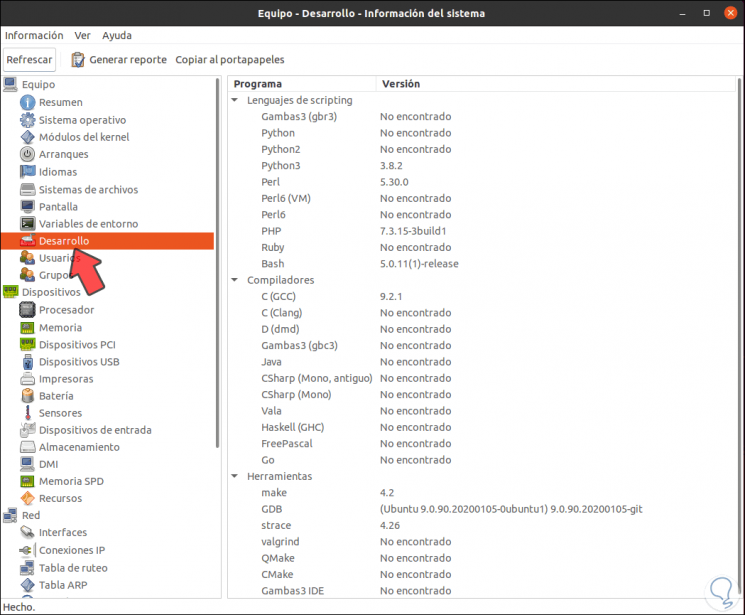
"Development" allows us to see what languages have been installed and in which version:
Step 8
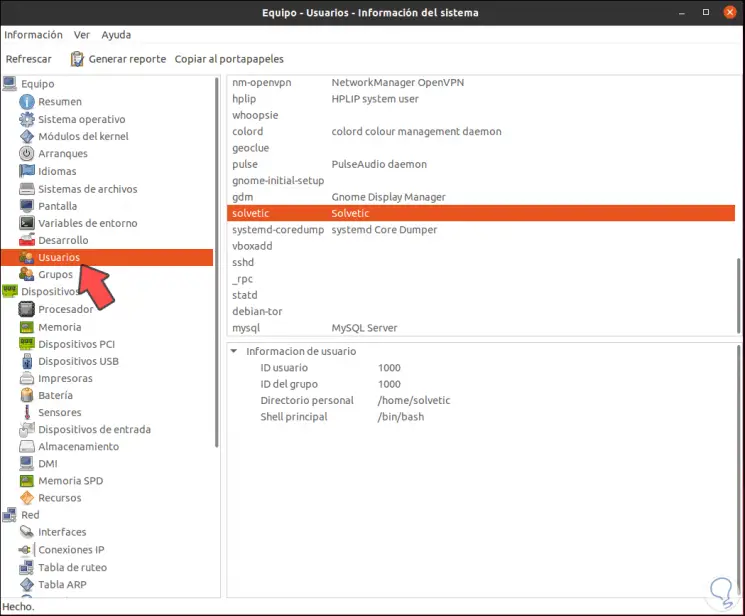
"Users" gives us a complete summary with details of each user that has been created in the system:
Step 9
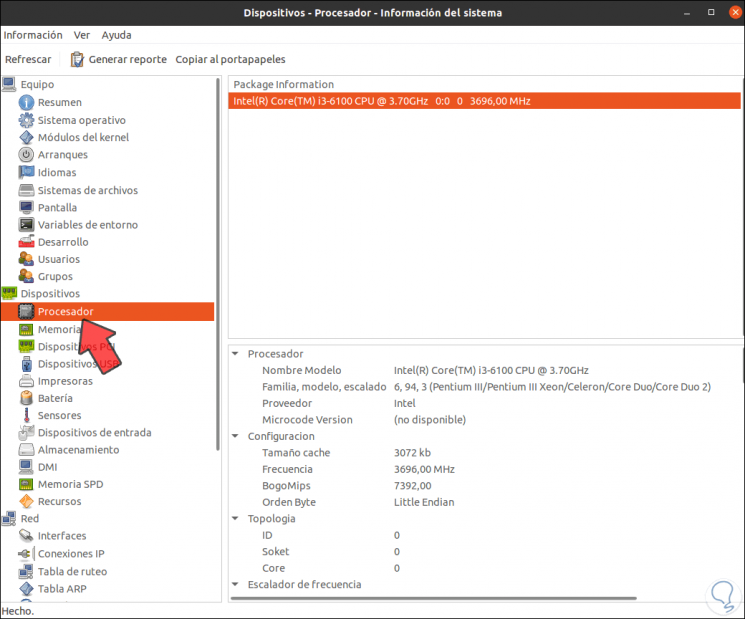
In the "Devices" section we find another group of variables that help the administrative tasks of each one of us, for example, in the "Processor" section we can select the current processor with all its technical details:
Step 10
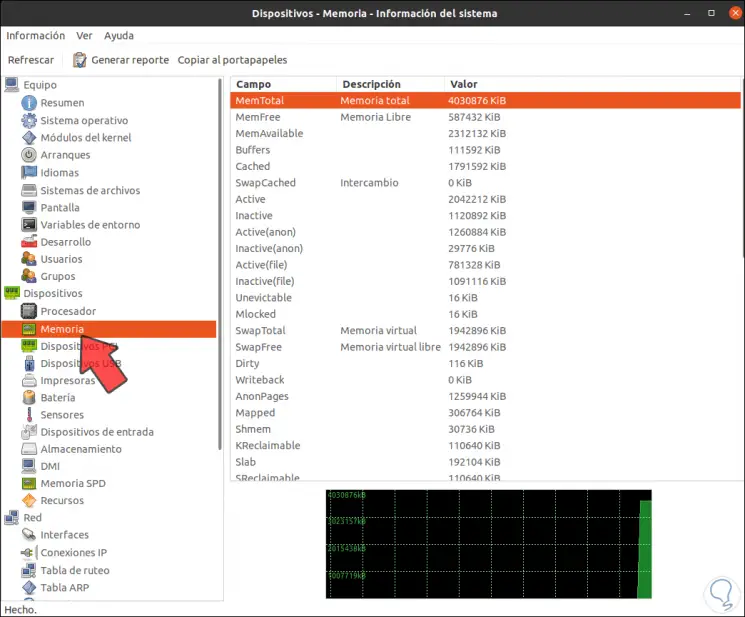
"Memory" allows us to access a complete summary in real time of the RAM memory, as well as a graph of its live use:
Step 11
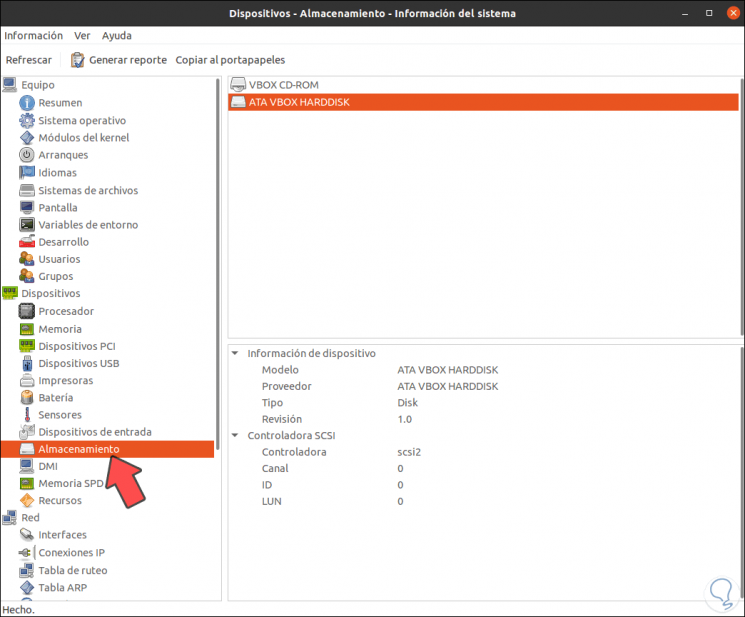
In the other sections we find specific details of USB devices, PCI, disks, etc, which display full details of each one of them.
Step 12
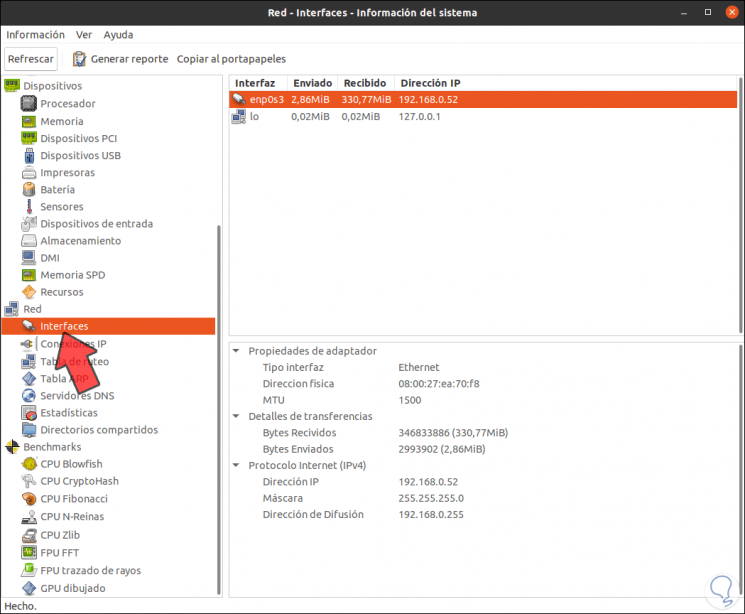
In the "Network" section we can access a complete summary of the network parameters in Linux, if we go to the "Interfaces" section we can see the details of the network cards such as:
- Number of bytes sent and received
Step 13
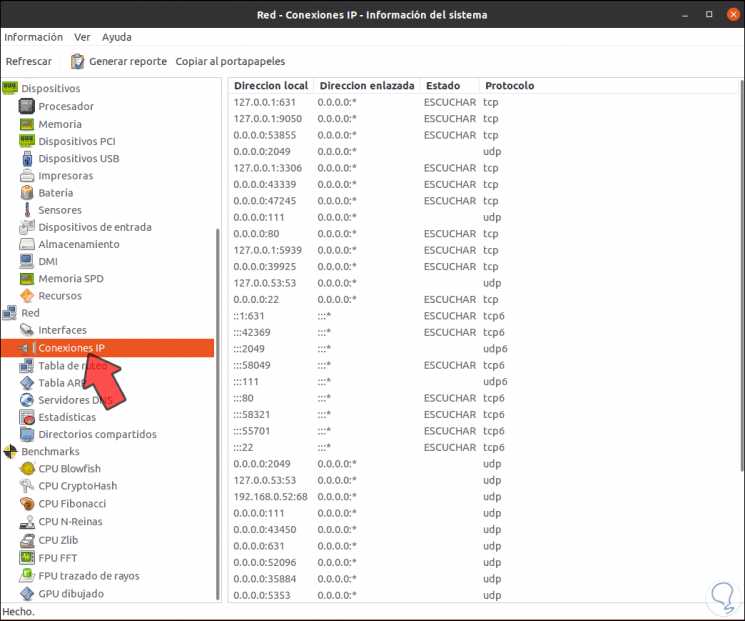
In "IP Connections" we find the connections made together with the type of action performed:
Step 14
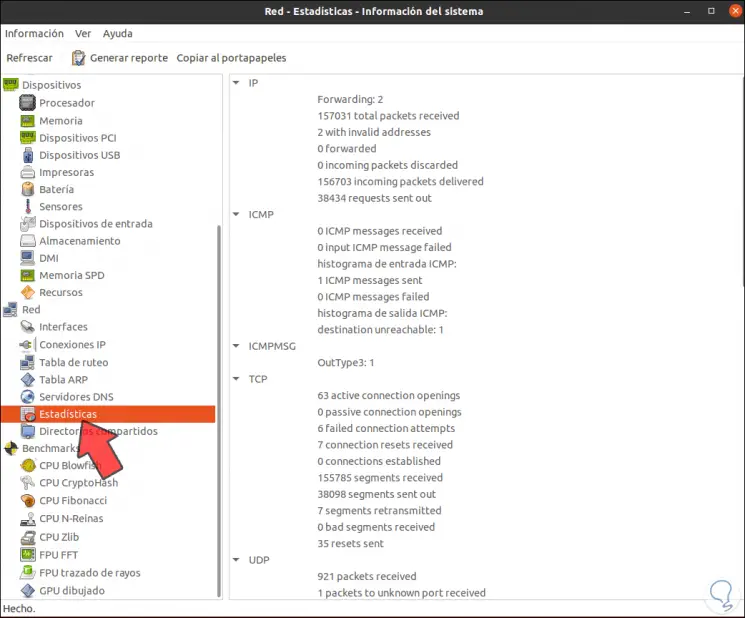
In "Statistics" we access a summary of each protocol with its statistics:
Step 15
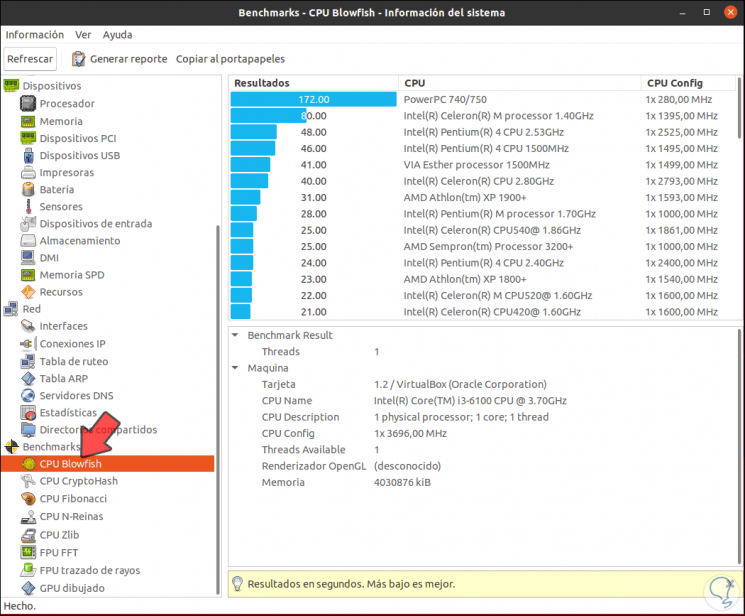
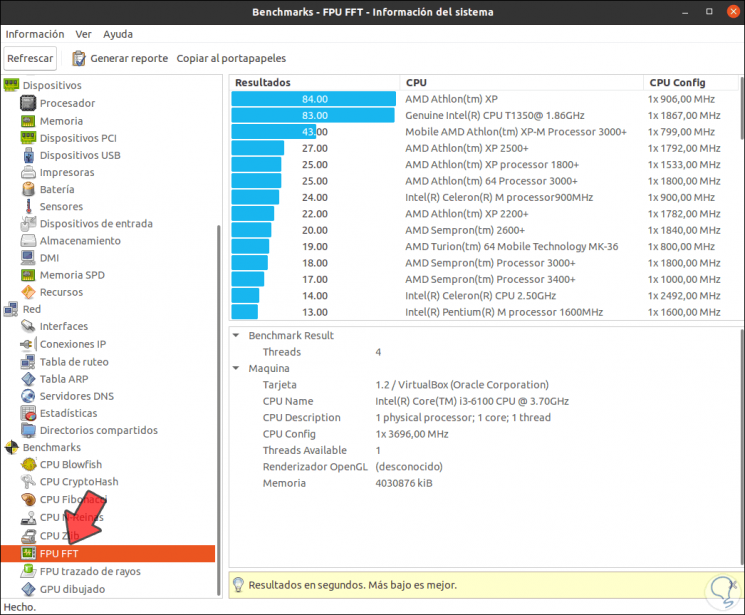
In the “Benchmarks” section we have system analysis tools, which are a collection of benchmarks to verify the performance of the equipment, in “CPU Blowfish” we find specific details:
Step 16
Thus we can select the desired options according to the criteria to be used:
Step 17
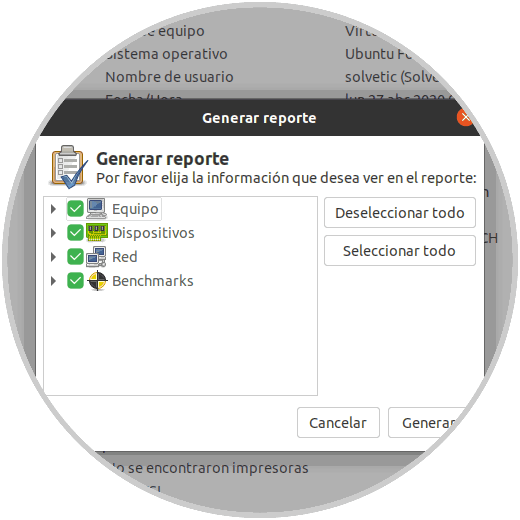
In addition to all this, Hardinfo gives us the possibility of generating a report by clicking on the button "Generate report" and it is possible to define from which section the report is to be generated:
Step 18
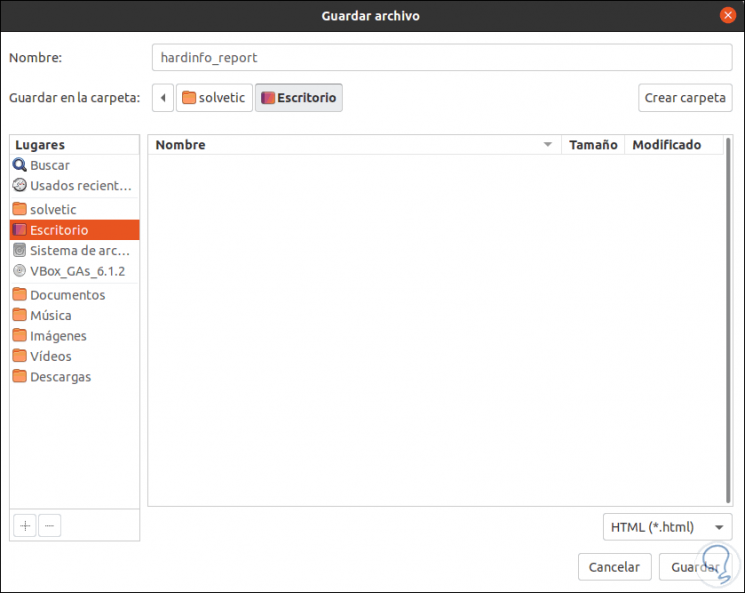
Once selected, click on the "Generate" button to create it and define where to save it:
Step 19
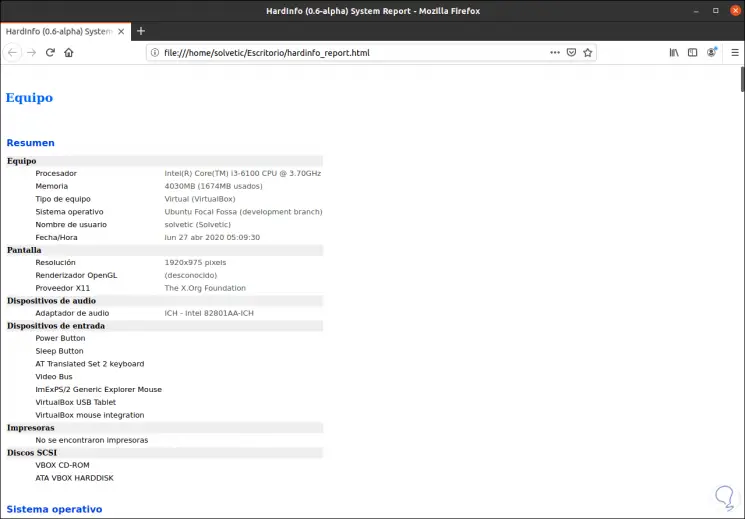
This file is created in HTML format, and we can access it from a browser:
As we see, this is a simple application that gives specific details of each aspect of hardware in a simple but fully functional way..