Microsoft Excel has evolved over the years by entering or improving new functions and formulas with the aim of making data management easier and easier to carry. This is due to the fact that we can face large amounts of both numerical and text data or dates where if any of them fail or are incorrectly configured, a series of errors are triggered that can lead to a headache..
But Microsoft Excel goes far beyond functions and formulas. For many users it is not a conscious fact that Excel will integrate practical and truthful solutions through which it will be possible to carry out a hypothesis based on the function of the data entered . This is something really useful for all that we need to be sure of how much we can spend, sell or manage in a specific way.
This is achieved thanks to the Solver function which we can install in Microsoft Excel 2016 or Excel 2019 and will be of great help for this type of tasks..
TechnoWikis will explain in detail how to use Solver in Excel 2019 and thus achieve one more point of administration and control in this valuable application of the Office suite. This process is similar in Microsoft Excel 2016.
What is Solver
Solver is an add-on developed by Microsoft as an Excel add-in through which it will be possible to run an analysis and if (what-if). When we implement and use Solver, it will be possible to detect an optimal value, whether minimum or maximum, for a formula in a cell. This cell (called the target cell) is subject to limitations in the values ​​of other formula cells in a spreadsheet.
The main purpose of Solver is the simulation and optimization of various business and engineering models. Solver works with a group of cells called decision variable cells which are used to calculate formulas in the target cells..
Solver is responsible for adjusting the values ​​of the decision variable cells so that they meet the limits of the restriction cells and finally generate the result we expect in the target cell. Basically Solver will be a great ally to determine the maximum or minimum value of a cell by modifying the value of other cells. Solver is made up of three elements that are:
To keep up, remember to subscribe to our YouTube channel! SUBSCRIBE
1. How to activate Solver in Excel 2016 or 2019
Step 1
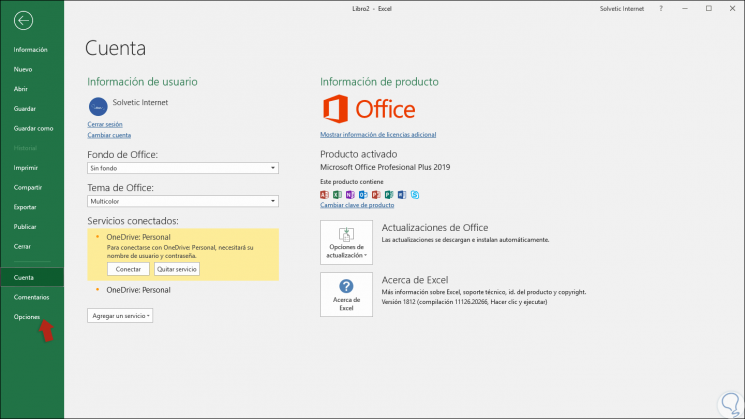
The first step that we must carry out will be to activate the Solver add-in in Microsoft Excel, for this we go to the File menu where we will see the following:
Step 2
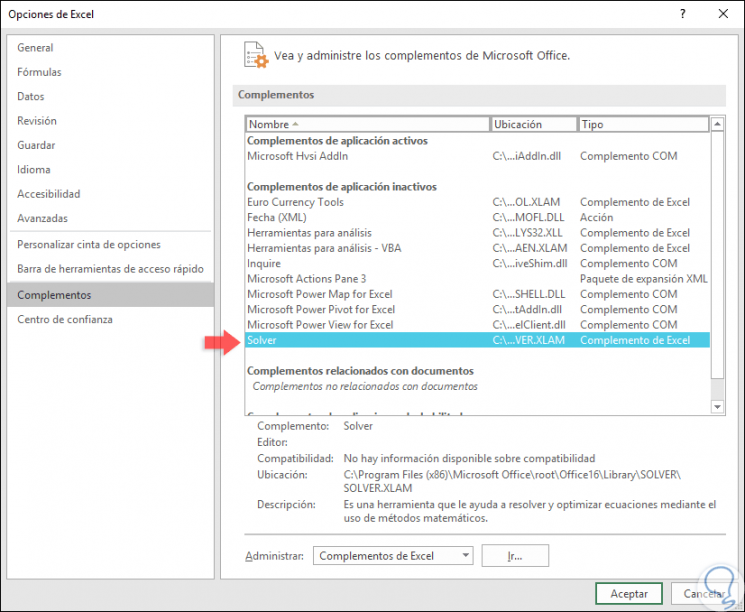
There we click on the “Options†category and in the window we will go to the “Add-ons†section and in the central panel select “Solverâ€:
Step 3
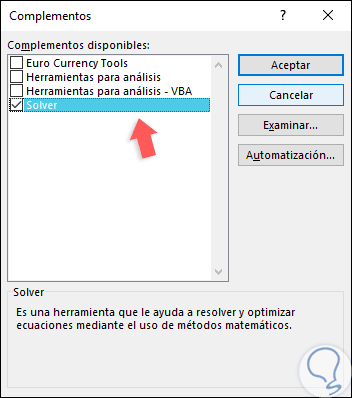
At the bottom we will click on the "Go" button located in the "Manage" field, and in the pop-up window we activate the "Solver" box:
Step 4
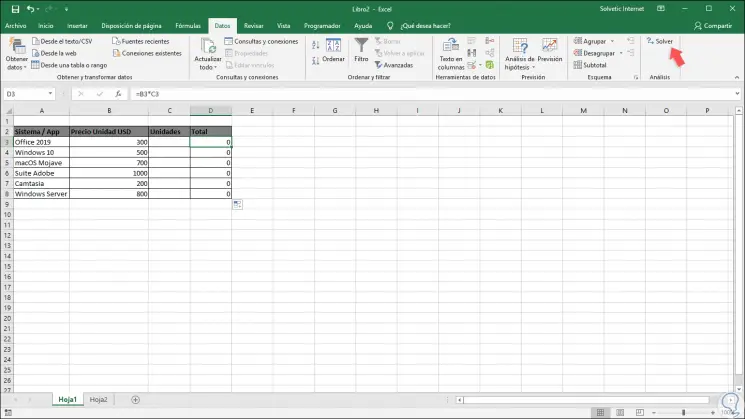
Click on OK to apply the changes. Now, in the “Data†menu, “Analysis†group we will find the “Solver†option:
2. Use Solver in Excel 2016 or 2019
Step 1
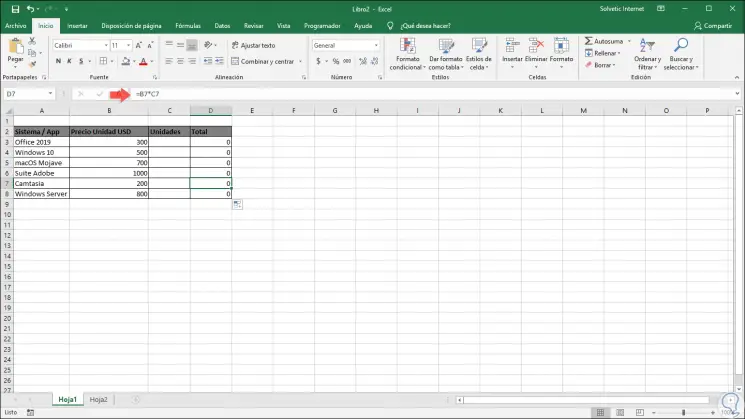
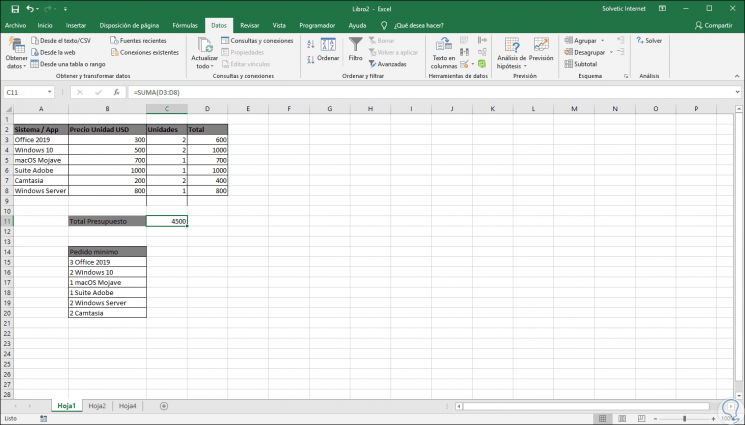
To use Solver in Excel 2019 we have the following information:
- A list of systems or apps
- A column with the price of each of them
- A list of units of each item
Step 2
Now, with this data, in the column Total cost we will multiply the unit price by the units with the following formulas:
= B7 * C7
Note
We can drag this formula to all the lower cells to copy the formulas.
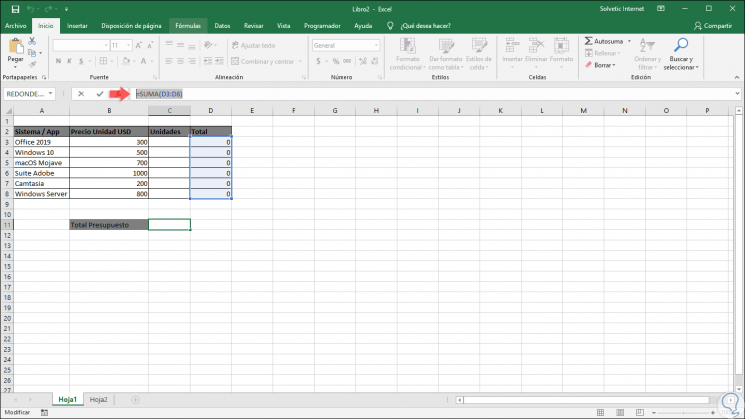
Step 3
Now, we will add a new row called Total Budget where we will add the entire range of the Total column with the following formulas:
= SUM (D3: D8)
Step 4
Now we go to the Data menu, Analysis group and there we click on Solver and the following wizard will be displayed:
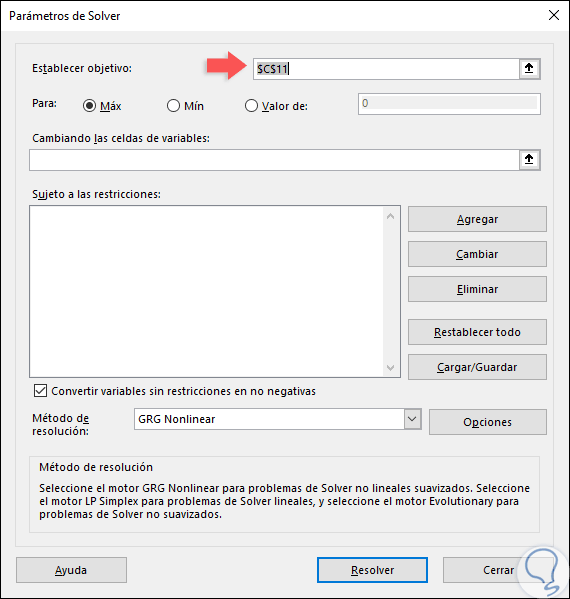
Step 5
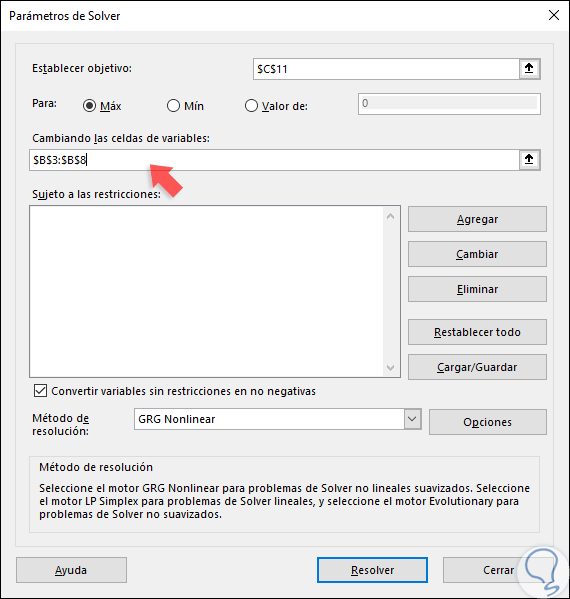
There we will indicate the target cell, field "Set target" and in this case we select cell C11. Then it will be possible to adjust the objective, “To†field, either the maximum, the minimum or a specific value depending on the criteria of the results, for this example we will activate the “Maximum†box. The next step is to establish the variable cells, for this we go to the field "Changing the variable cells" and there we select the desired range which will be in this case the USD unit price column:
Step 6
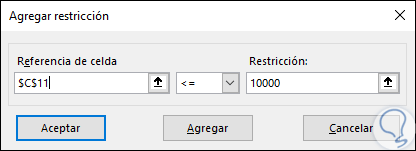
Then, it is time to define the restrictions, for this example we assume that we have a limit of USD 10,000 for purchases, to set this restriction we click on the “Add†button in the “Subject to restrictions†field and in the pop-up window We define the following:
- In the "Cell reference" field, enter the Total budget cell.
- We assign the restriction Less or equal to (<=).
- In the Restriction field we assign the maximum value to use in this case 10000.
Step 7
Click on "Add" to apply the changes. Now, the following restriction will be that both the systems and the apps are sold complete, there we click on Add again and this time we select the range of Units and select the value “int (integer)â€:
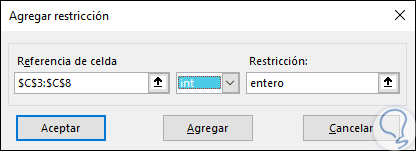
Note
This last parameter is optional.
Step 8
Click on Add and finally, we will define the minimum amount of each system or app to use, for this we have the following:
Step 9
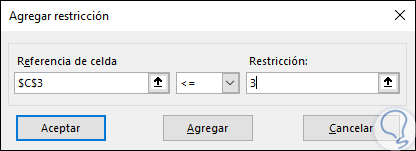
To do this, click on Add and do the following:
- In the “Cell reference†field we enter the cell for each system or application in the Units column, for example, for Office 2019 it will be C3, for Windows 10 it will be C4 etc.
- We assign the parameter less than or equal to (<=) and assign the maximum amount in the “Restriction†field.
Step 7
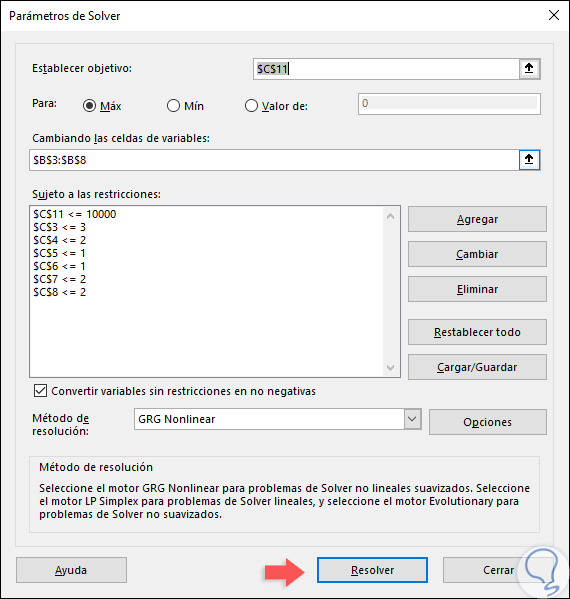
We repeat this process for each element. Once this process is done we will see something similar to this:
Note
The available restriction options are:
- <= (less than or equal to
- > =: greater than or equal to
Step 8
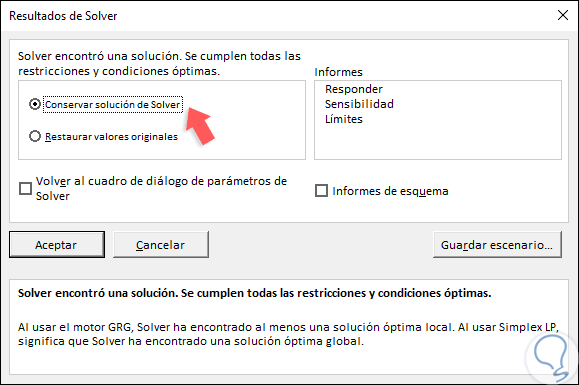
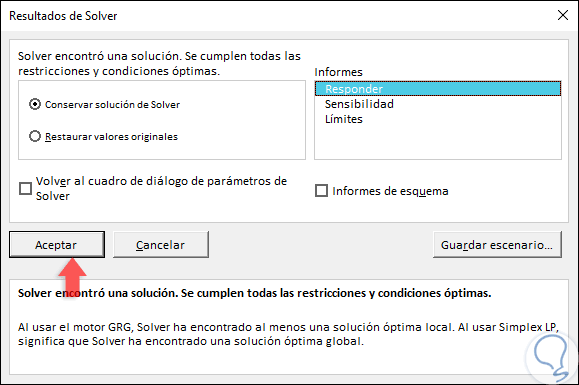
Once this is defined, click on the “Solve†button to execute the analysis and the following window will be displayed:
Step 9
There we have the following options:
- If we want to keep the values ​​of the solution in the spreadsheet, we will click on “Keep Solver Solutionâ€.
- If we want to restore the original values ​​before clicking on Resolve, we will click on “Restore original valuesâ€.
- In order to interrupt the resolution process, we press the Esc key, Excel will update the spreadsheet with the last values ​​found for the decision variable cells.
- In order to create a solution-based report after Solver finds the solution, we select a type of report in the Reports box and click OK. The report is created in a new spreadsheet of the book, in case Solver does not find a solution, the option to create a report will not be available.
- To save the values ​​of the decision variable cell as a scenario to use later, we must click on Save Scenario in the Solver Results dialog box and then enter a name for the scenario in the Scenario Name box.
Step 10
For this case we select the option “Keep Solver Solution†and click on OK to see the results:
Step 11
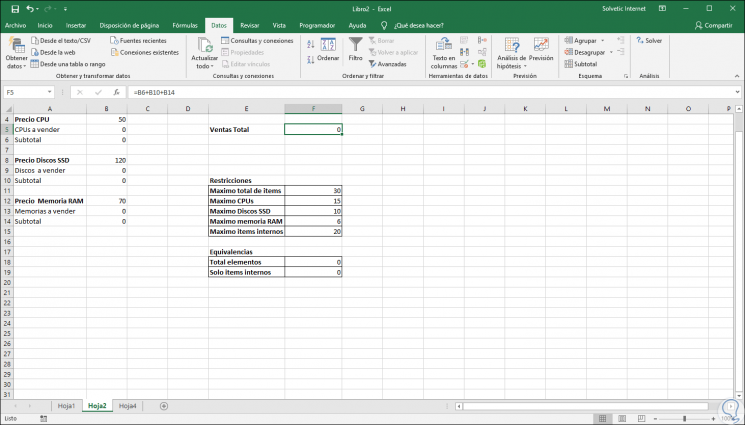
As we can see, Solver automatically analyzes the maximum amount based on the selected criteria. Let's see another example of how Solver is useful for the entire analysis process. In this case we have the following data:
Step 12
There we have the following information:
- Prices of items such as CPUs, SSDs and RAM.
- The subtotal of each item has been defined by multiplying the quantity by the unit price.
- We have assigned total sales by adding all subtotals.
- Restrictions have been applied through a maximum total sales, maximum quantity of each item and a maximum of internal devices (disks and memory).
- In the final part we have added the sum of all the elements that Solver will calculate, as well as only the filter of the internal elements.
Step 13
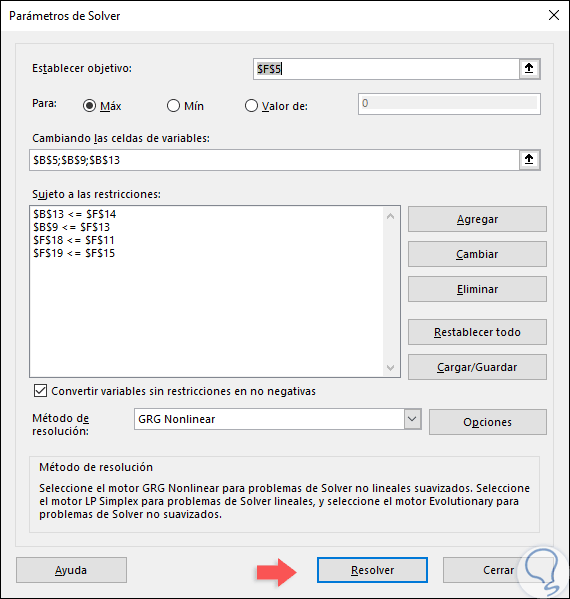
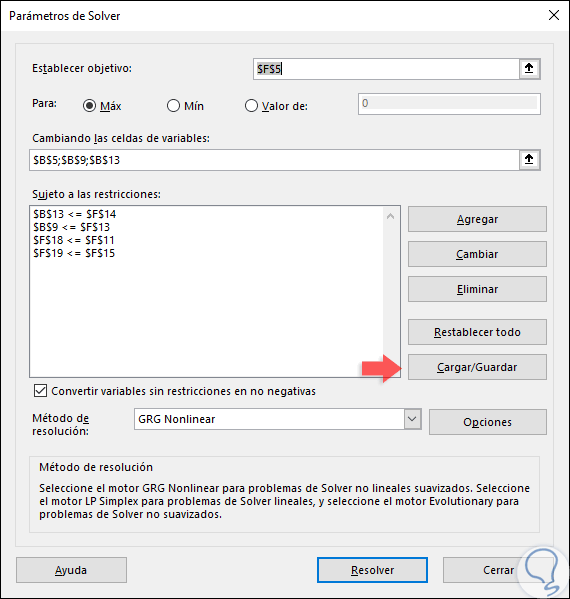
Like the previous point, we go to the Data menu and in the Analysis group we select Solver and there we will define the following parameters:
- In the "Set target" field, enter the desired cell which is in this case F5 (Total sales).
- In the field "Changing the variable cells" we enter each cell assigned to the subtotals.
- In the restrictions we add the following.
Step 14
In the field of restrictions we use the following options to understand the operation:
- $ B $ 13 <= $ F $ 14: there we indicate that the amount of memory to be sold must be less than or equal to the amount indicated in cell F14 (maximum RAM).
- $ B $ 9 <= $ F $ 13: there we indicate that the quantity of disks to be sold must be less than or equal to the quantity indicated in cell F13 (maximum SSD disks).
- $ F $ 18 <= $ F $ 11: there we indicate that the total items to be sold must be less than or equal to the amount indicated in cell F11 (maximum total items).
- $ F $ 19 <= $ F $ 15: there we indicate that the quantity of internal items sold must be less than or equal to the amount indicated in cell F15 (maximum internal items).
Step 15
Click on "Solve" and Solver will be in charge of the analysis which if correct will launch the following message:
Step 16
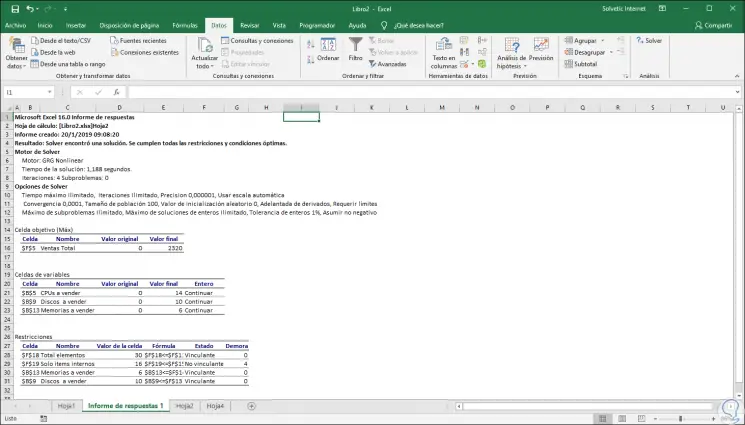
There we can select if we want the type of report to use. Click on OK and we will see the analysis carried out by Solver in Excel:

Step 17
If we have chosen to use the report option, it will be available on a separate sheet and its format will be as follows:
Step 18
Solver has the following resolution methods:
GRG Nonlinear
This type of method is used for nonlinear problems, that is, in which at least one of the constraints is a uniform nonlinear function of the decision variables.
LP Simplex
It is based on the Simplex algorithm developed by the American mathematician George Dantzig, this method is used to solve linear programming problems, there, mathematical models are characterized by linear relationships, that is, they consist of a single objective represented by a linear equation. which should be maximized or minimized.
Evolutionary
It is used for the most complex type of optimization problems to solve since some of the functions may be discontinuous, and in this way it will be more complex to determine the direction in which a function is increasing or decreasing.
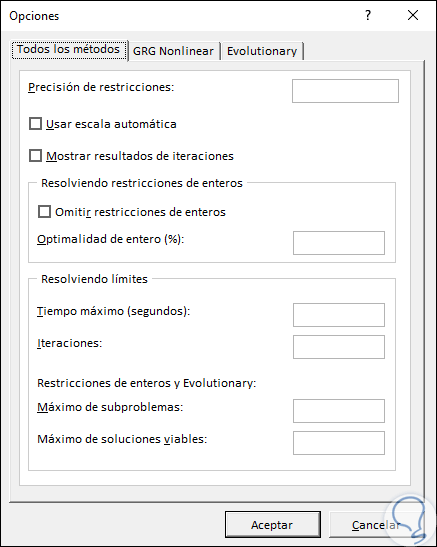
Step 19
By using any of these methods, we can see that the front of this is the "Options" button which allows us to configure its variables as we deem necessary:
Step 20
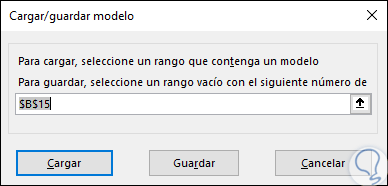
After executing the solution through Solver it will be possible to save said project or load one already stored, for this we click on the “Load / Save†button:
Step 21
The following window will be displayed where we define the range with the Solver model to save. Click on Save to apply the changes.
Thus, we have seen how Solver is a more than practical solution for the analysis and projection of data which will be very necessary for future management and administration.