The hard drive in any operating system is essential to perform hundreds of tasks, not only to save files or install the system itself and applications..
When performing these tasks, the hard drive performs both read and write actions, which is technically known as I/O (input/output), and as administrators or users, it is ideal at some point to know what the status of these tasks is like, since a read or write error can give errors like:
- Application or file closures
TechnoWikis will explain some tools for Linux with which it is possible to know the status of the hard disk at the I/O level.
To stay up to date, remember to subscribe to our YouTube channel! SUBSCRIBE
1 Monitor Linux Hard Drive | IOSTAT Tools
Iostat (I/O Status) is a utility that creates a report with CPU or processor details as well as input/output (I/O) statistics for devices, partitions, and network file systems and these statistics are taken by benchmarking the time the device is active against average transfer rates.
With this information generated, it is possible to perform a balance that optimizes the input/output load of the physical disks..
Step 1
By default, the first report generated with iostat gives us statistics on the time elapsed since Linux was started, after this each report will be the period between the previous report and the new one, we open the terminal and install Iostat:
sudo apt install sysstat
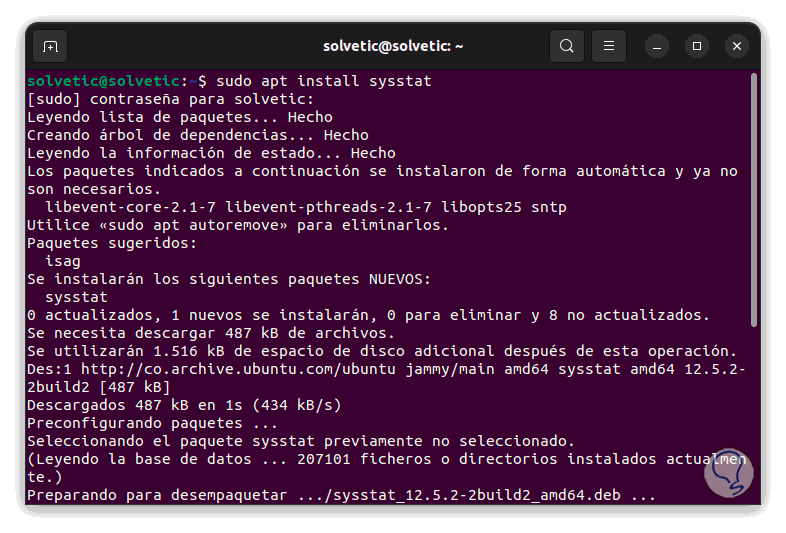
We hope that this operation will come to an end.
Step 2
For other versions of Linux run:
- sudo yum install sysstat (RHEL/CentOS/Fedora and Rocky Linux/AlmaLinux)
- sudo emerge -a app-admin/sysstat (Gentoo Linux)
- sudo pacman -S sysstat (Arch Linux)
- sudo apk add sysstat (Alpine Linux)
- sudo zypper install sysstat (OpenSUSE)
We execute:
iostat -d -t
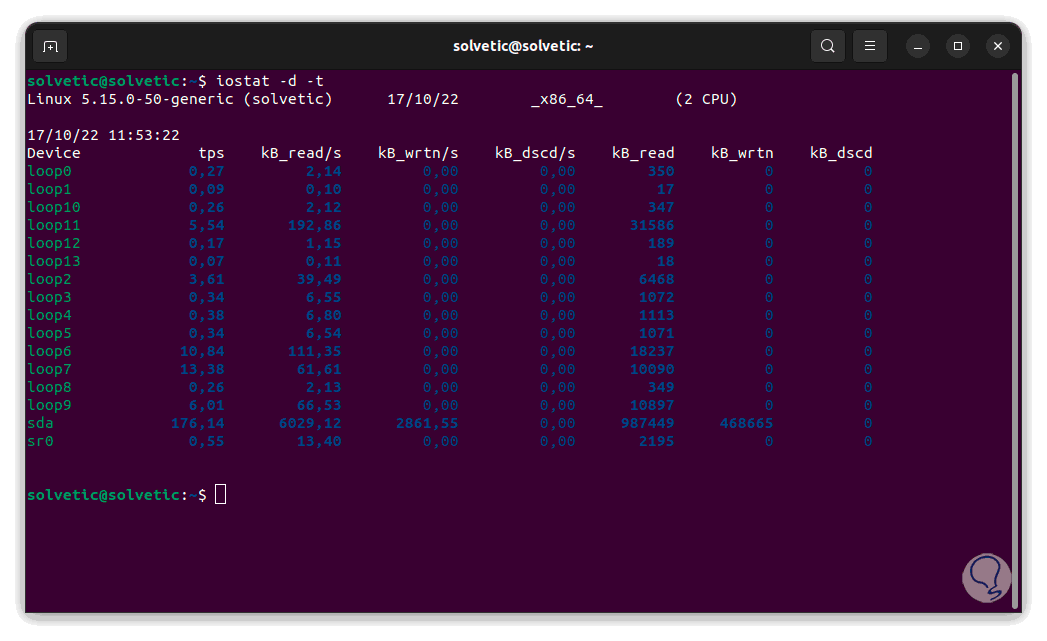
Step 3
The iostat command is responsible for creating 3 types of reports that are
- network file system report
For more complete data we execute:
iostat -d -x -t
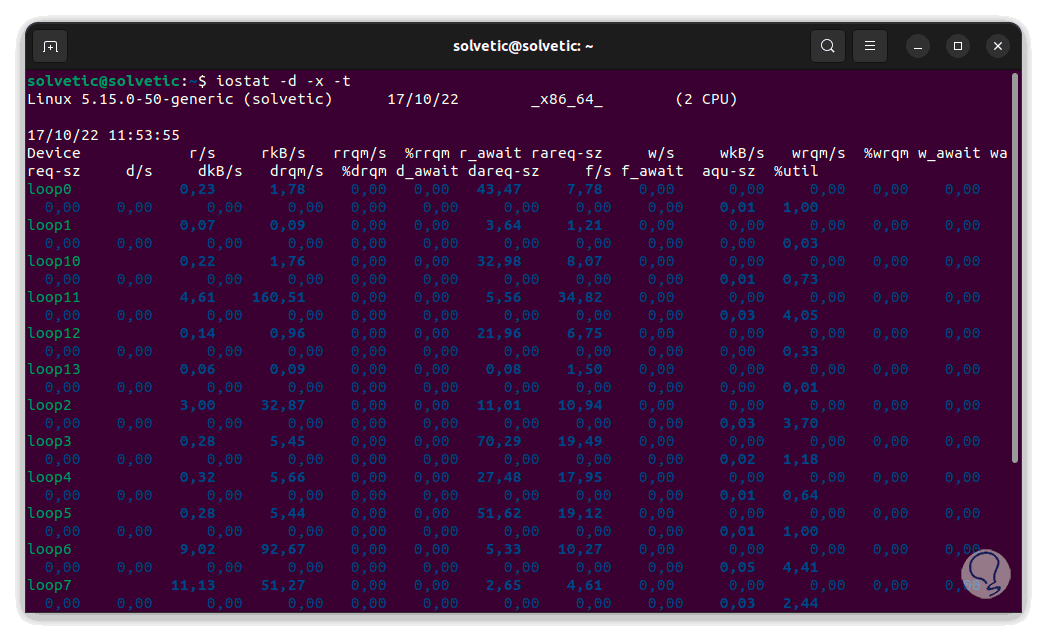
We see each device with its I/O rates..
Step 4
To display results in certain seconds we execute the following:
iostat -d #
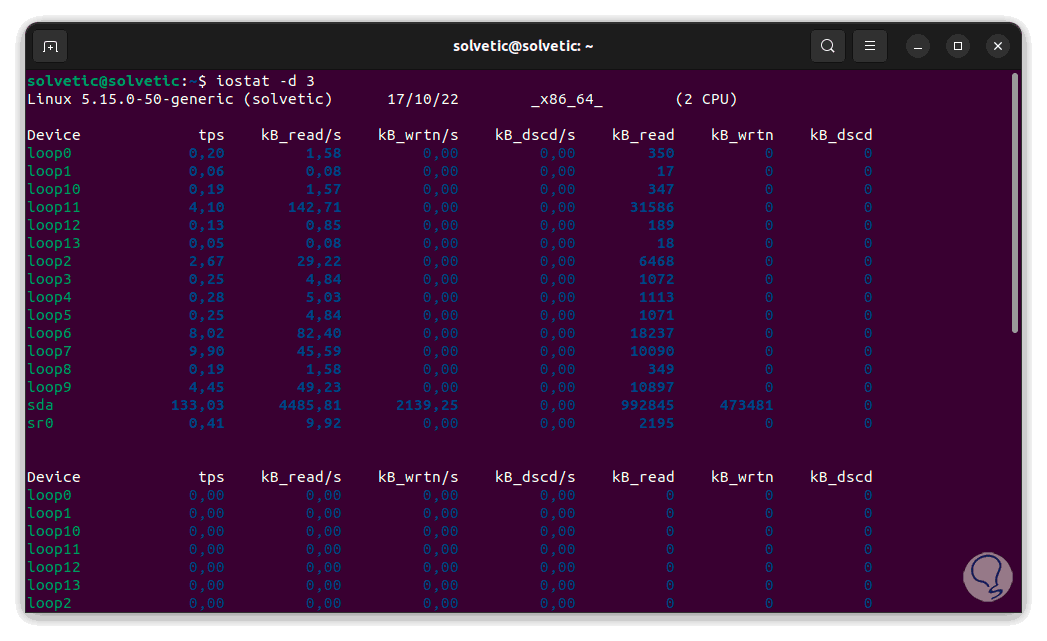
step 5
The measures available in the report are:
- Blk_read/s. are the amount of data read in number of blocks per second, its default size is 512 bytes
- Blk_wrtn/s: are the amount of data written to the device in number of blocks per second
- Blk_read: is the total number of blocks read
- Blk_wrtn: is the total number of blocks written
- kB_read/s: are the amount of data read in kilobytes per second
- kB_wrtn/s: is the amount of data written in kilobytes per second
- kB_read: indicates the total number of kilobytes read
- kB_wrtn: is the total number of kilobytes written
- MB_read/s: is the amount of data read in megabytes per second
- MB_wrtn/s: is the amount of data written megabytes per second
- MB_read: indicates the total number of megabytes read
- MB_wrtn: is the total megabytes written
- rrqm/s: are the number of read requests per second queued on the hard drive
- wrqm/s: Write requests per second queued to disk
- r/s: is the number of read requests sent to the device per second
- w/s: is the number of write requests sent to the device per second
- rsec/s: indicates the number of sectors read from the device per second
- wsec/s – Indicates the number of sectors written to the device per second
We look at each chunk of time for a detailed look at what's happening at the I/O level on the hard drive.
step 5
It is possible to generate the result in a file, we execute:
iostat -d #_seconds Number_reports > name.txt &
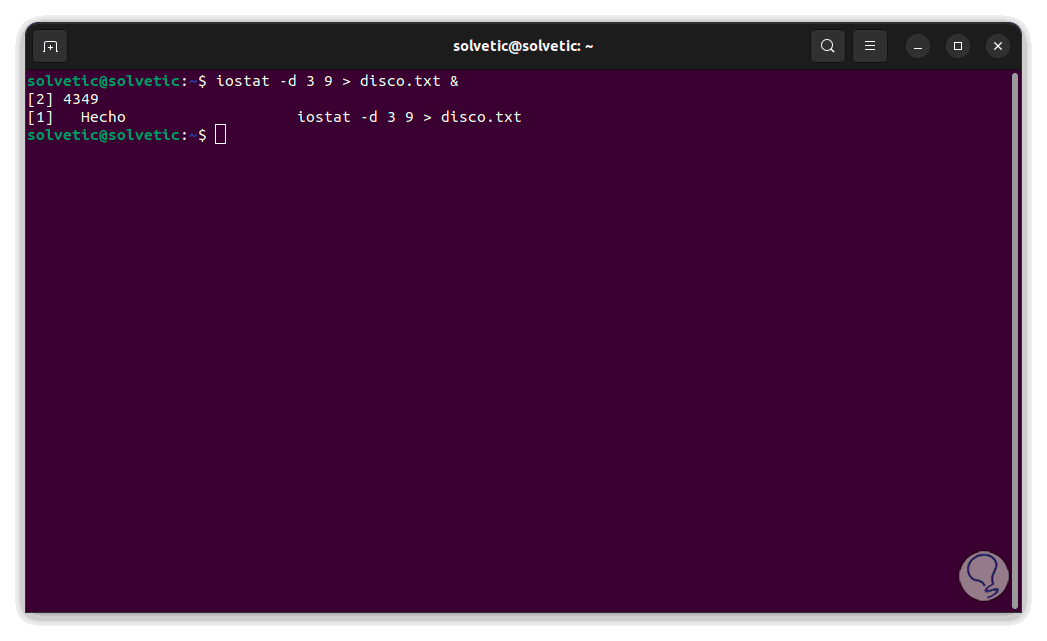
Step 6
It must be indicated how often the data is captured and the number of reports to use, we validate that the file has been created:
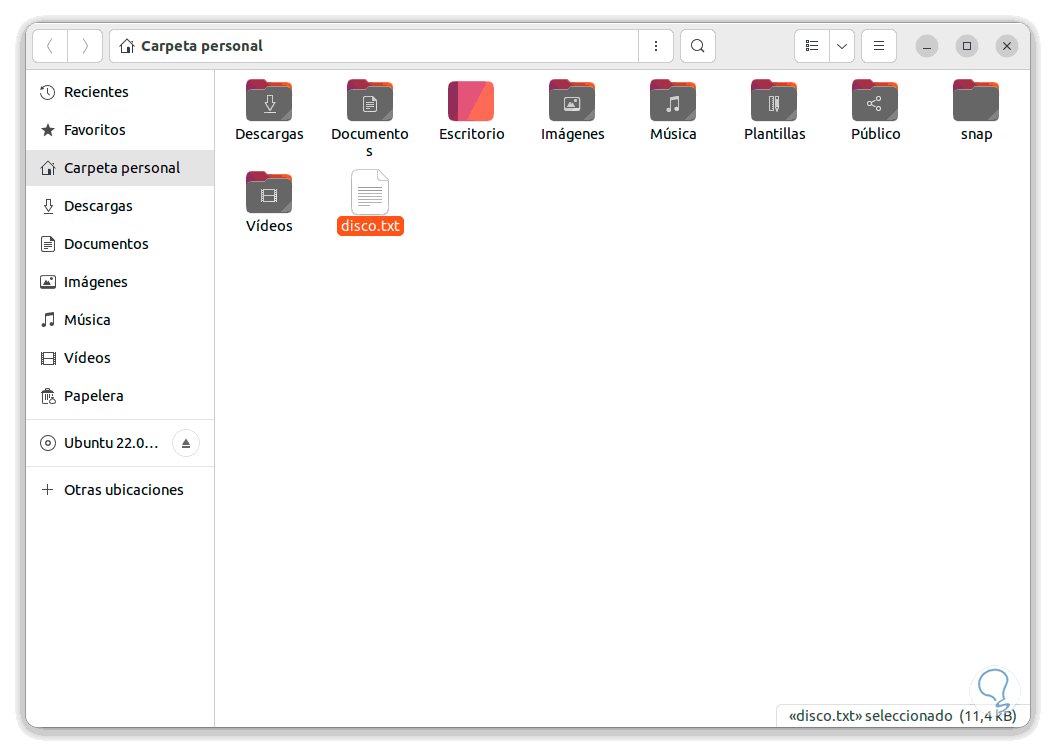
Step 7
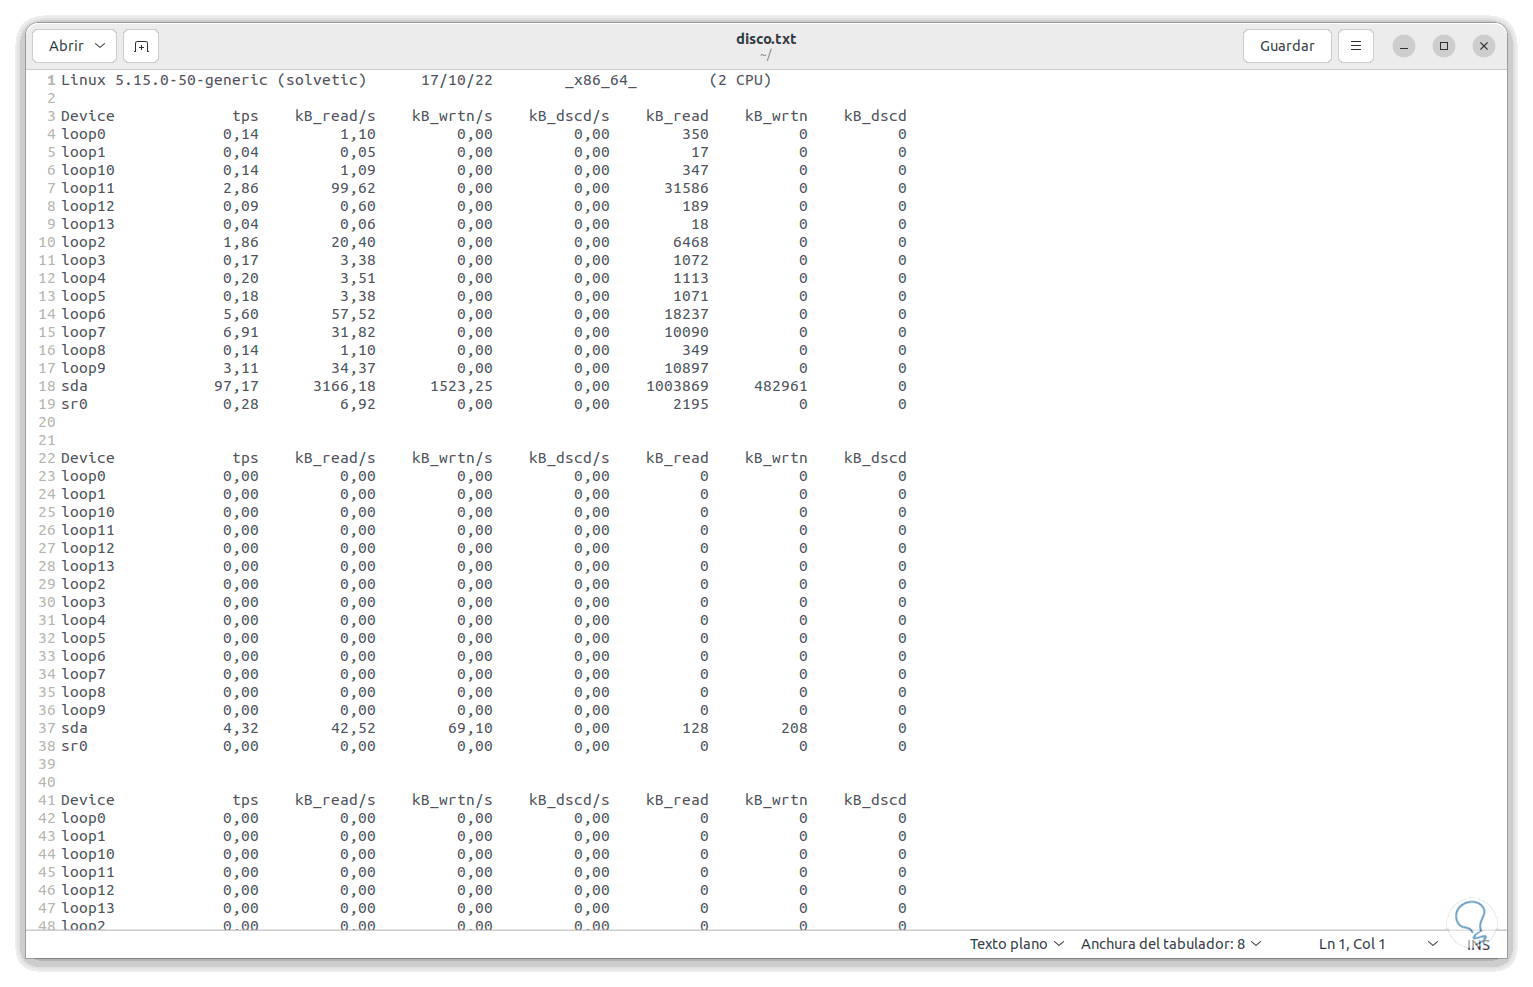
Open the created file to see the structure of the data:
The parameters available to be used with Iostat are:
- -c: display the CPU usage report
- -k : output in kilobytes per second instead of blocks per second
- -d: show device usage report
- -h: create a more understandable report
- -m: show data in megabytes per second instead of blocks or kilobytes per second
- -N. displays the registered device mapper names for the disk
- -p [ { device [,...] | ALL } ]: displays the statistics of block devices as well as partitions
- -t: prints the time of the generated report
- -V: display the version number
- -x: generate more complete statistics
2 Monitor Linux Hard Drive | SAR Tools
The sar utility is inside the sysstat package and its task is to collect, report or save information about the operating system activity, by default the available kernel data will be saved in the data file.
Step 1
We are going to enable Sar to collect data, this is enabled in the /etc/default/sysstat file, for this we open the configuration file with the desired editor:
sudo nano /etc/default/sysstat

Step 2
We will see the following:
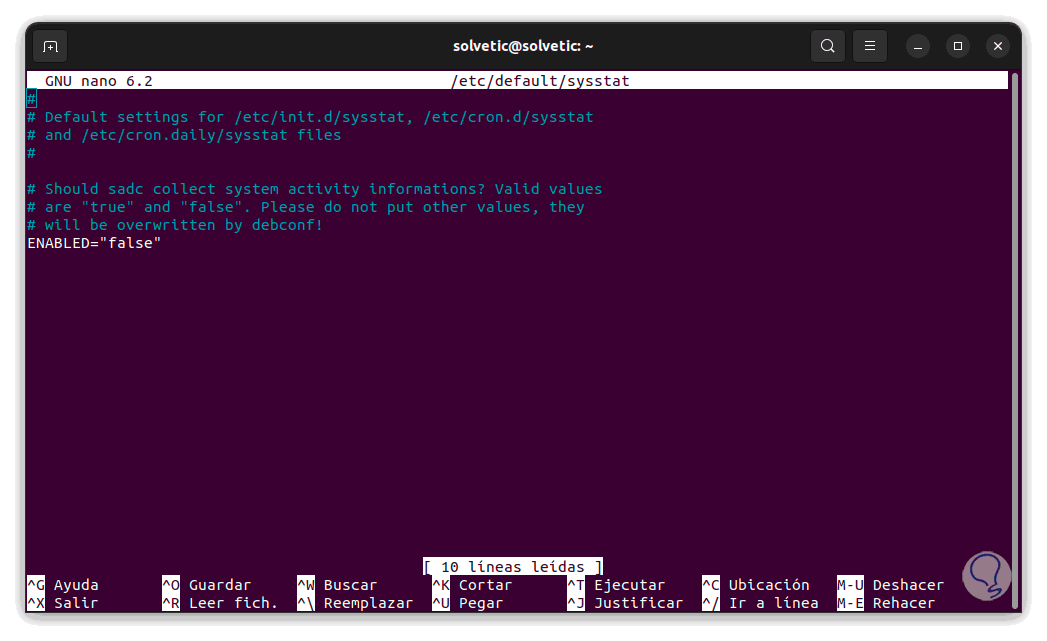
Step 3
In the "ENABLED" field set "true":
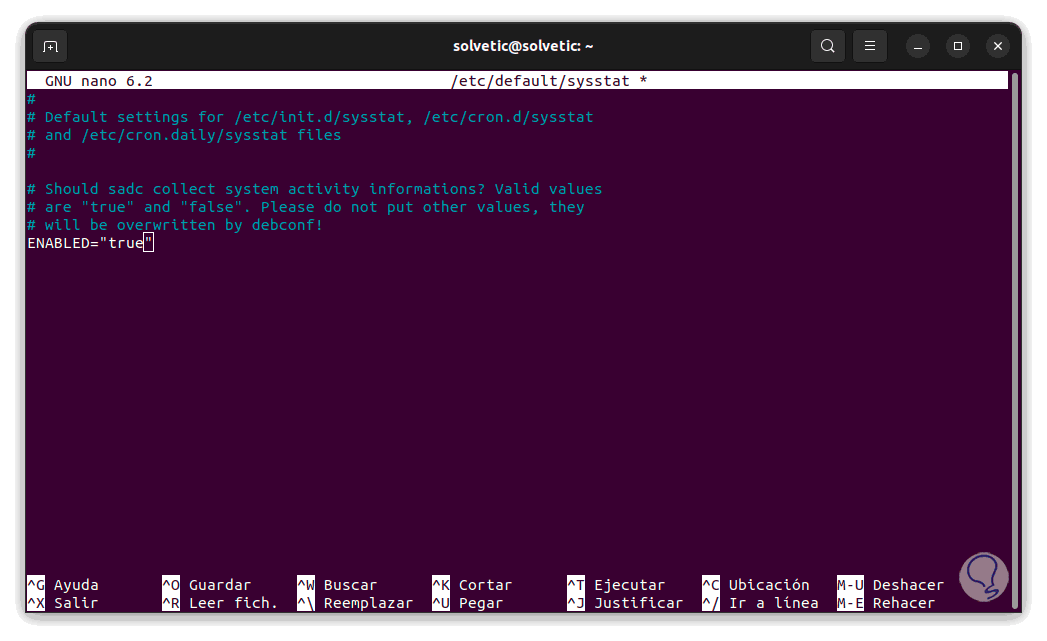
We apply the changes with Ctrl + O and exit with Ctrl + X.
Step 4
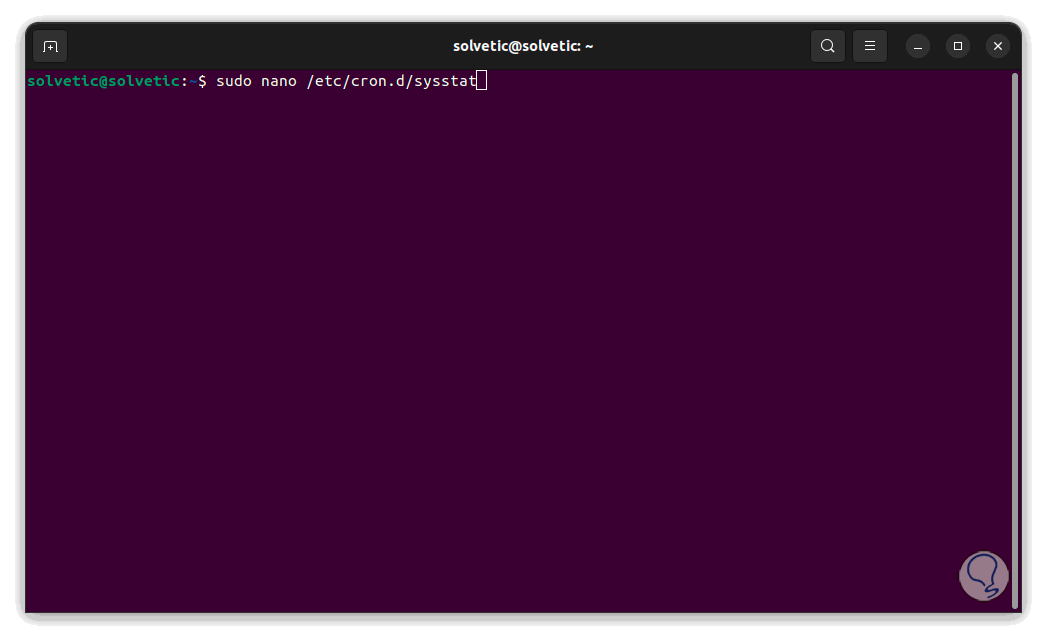
Now we are going to reduce the default data collection interval of sysstat, for this we open the Cron file:
sudo nano /etc/cron.d/sysstat
step 5
We will see the following:
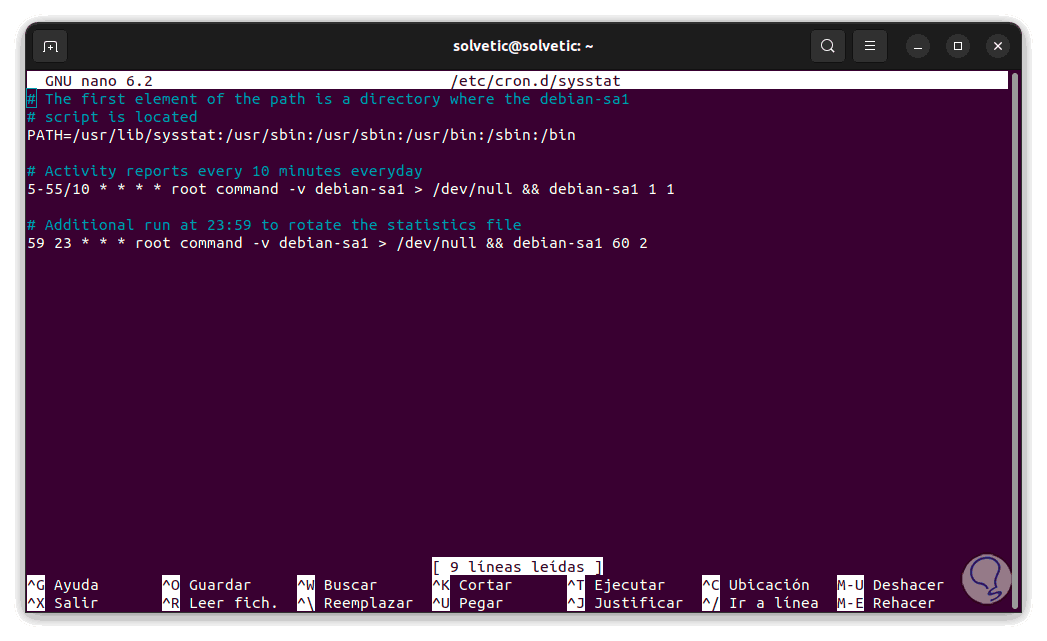
Step 6
We adjust the number of minutes in the respective line:
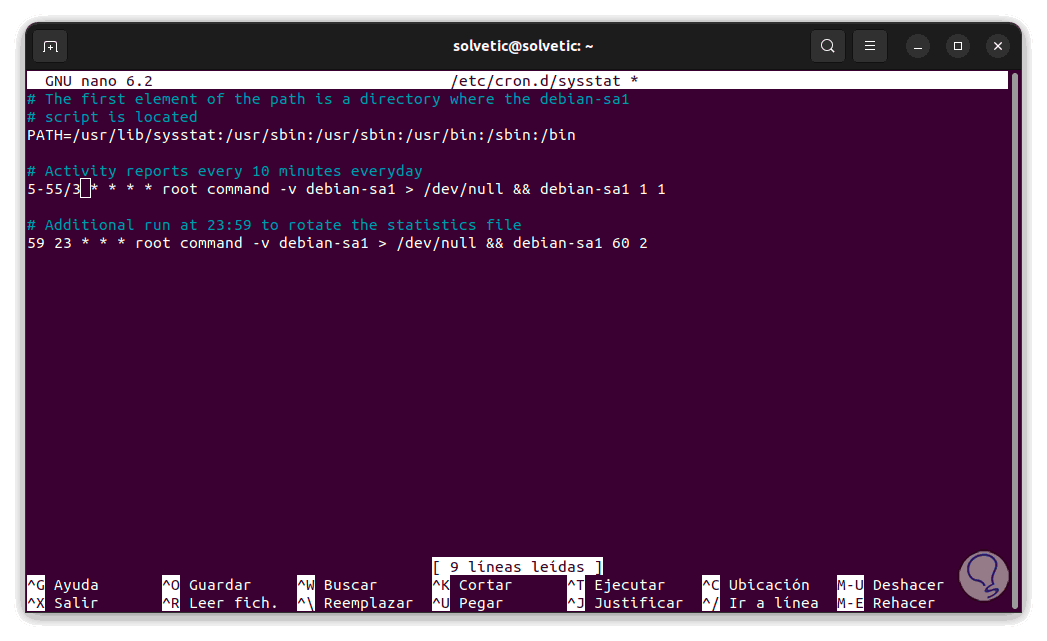
In this case, data collection has been left every 3 minutes.
Apply the changes.
Step 7
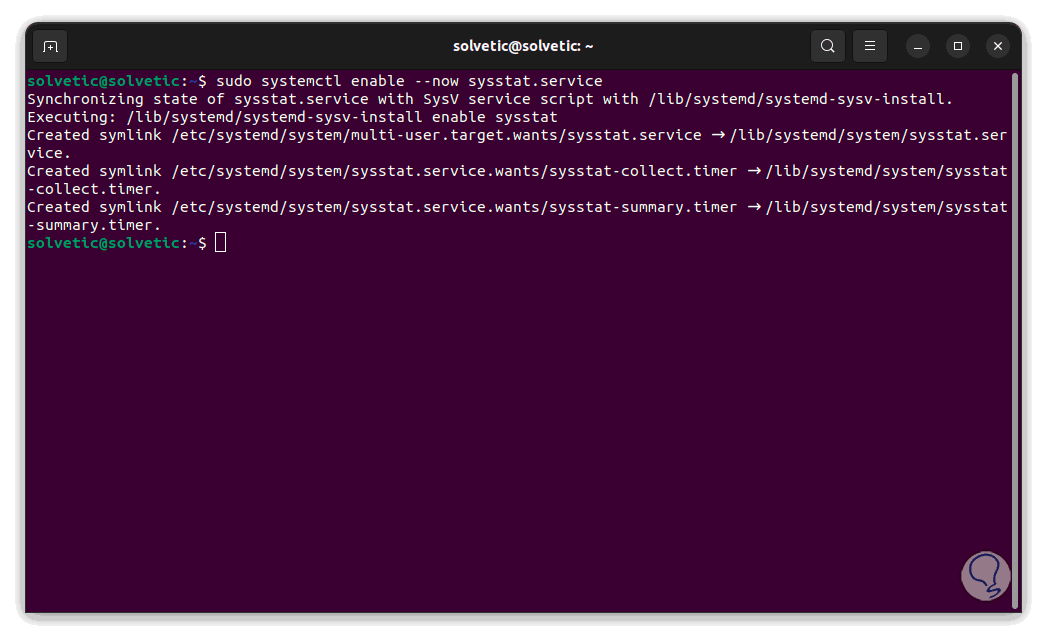
Enable the Sysstat service by running:
sudo systemctl enable --now sysstat.service
step 8
Now we run:
sudo systemctl enable sysstat.service
step 9
We execute:
sar -d -b
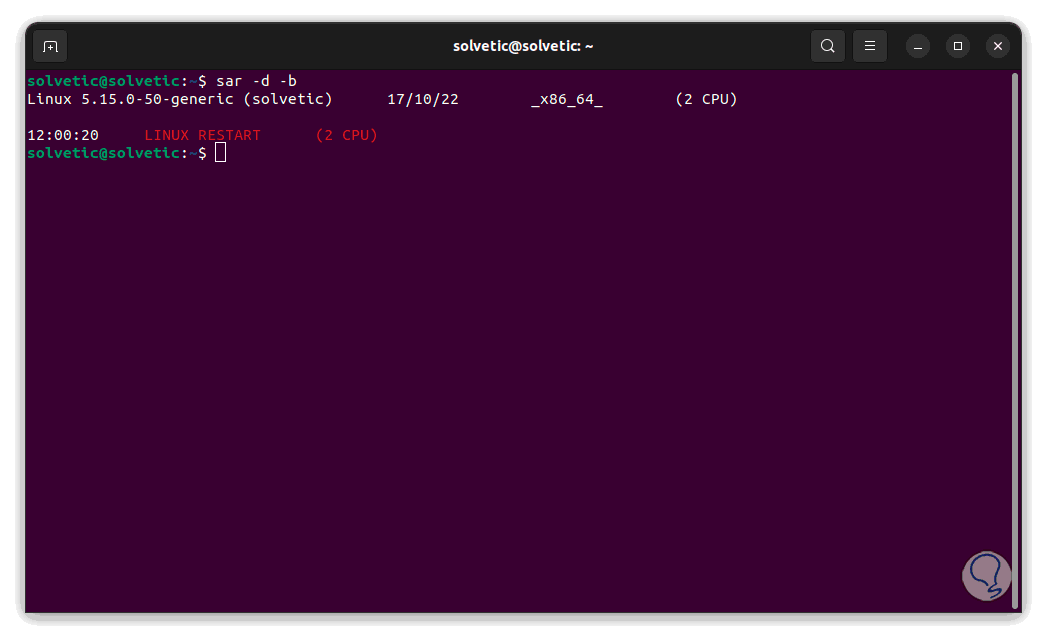
step 10
You can wait the configured number of minutes to access I/O data:
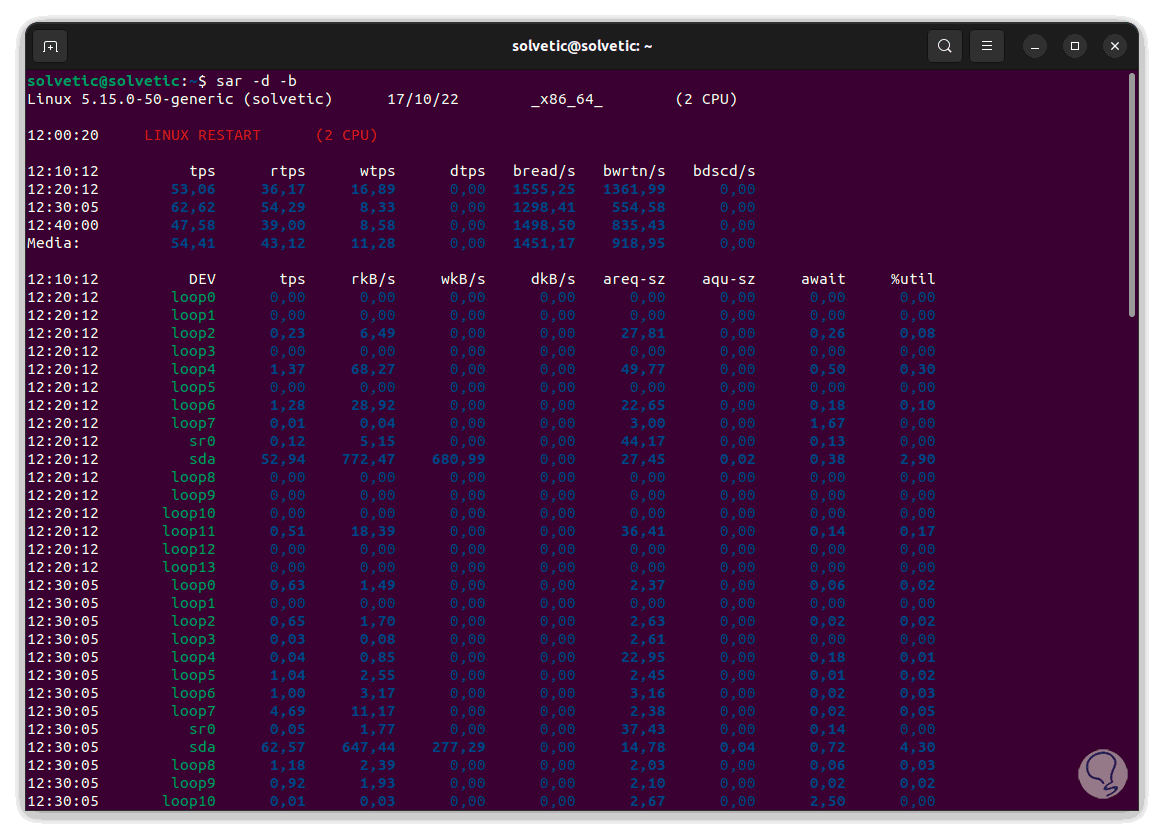
There we find each interval defined with the respective data.
The general usage options are:
- -b: create a report with transfer rate and I/O statistics
- -B: Create a pagination statistics report
- -C: when reading data from a file, sadc comments will be displayed
- -d – Create an activity report for each block device on Linux
- -e [hh:mm:ss]: allows us to define the end time of the report
- -f [filename]: allows to extract the records from the filename
- -i interval: allows to indicate in how many seconds the data will be taken
- -m: add power management statistics
The values displayed in the report are the same as those previously explained in Iostat.
3 Monitor Linux Hard Drive | IOTOP Tools
Step 1
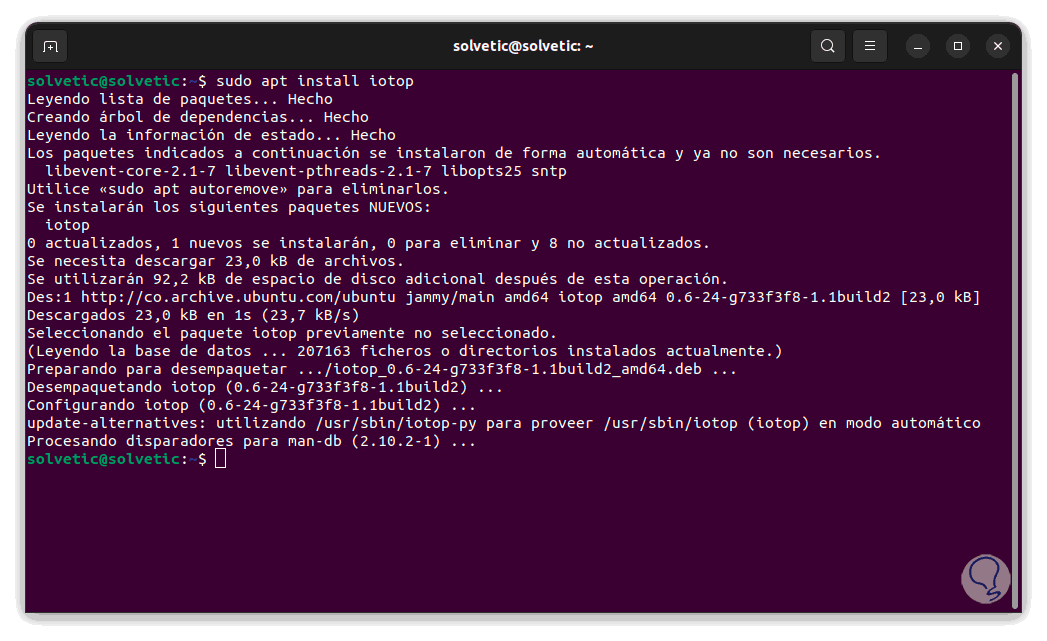
Another of the utilities to know the details of I/O is Iotop, this is an I/O monitor to display data in real time of the data on the hard disk, we open the terminal and install Iotop:
sudo apt install iotop
Step 2
To install on other distributions run:
- sudo yum install iotop (RHEL/CentOS/Fedora and Rocky Linux/AlmaLinux)
- sudo pacman -S iotop (Arch Linux)
- $ sudo apk add iotop (Alpine Linux)
- sudo emerge -a sys-processes/iotop (Gentoo Linux)
- sudo zypper install iotop (OpenSUSE)
We execute:
sudo iotop
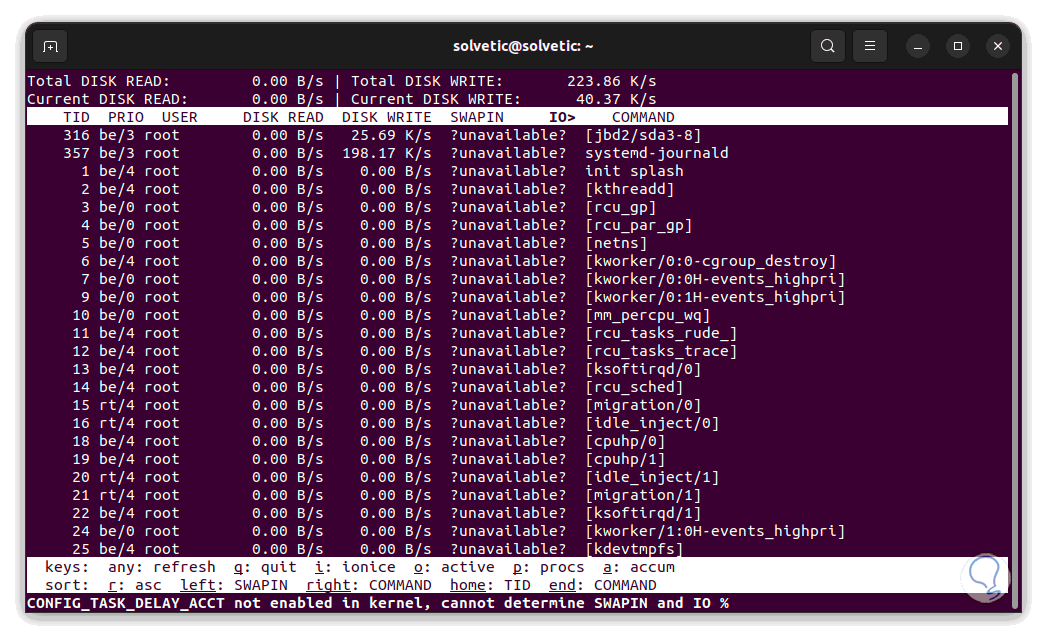
Step 3
We find the specific details of I/O, to see the processes run:
sudo iotop -P
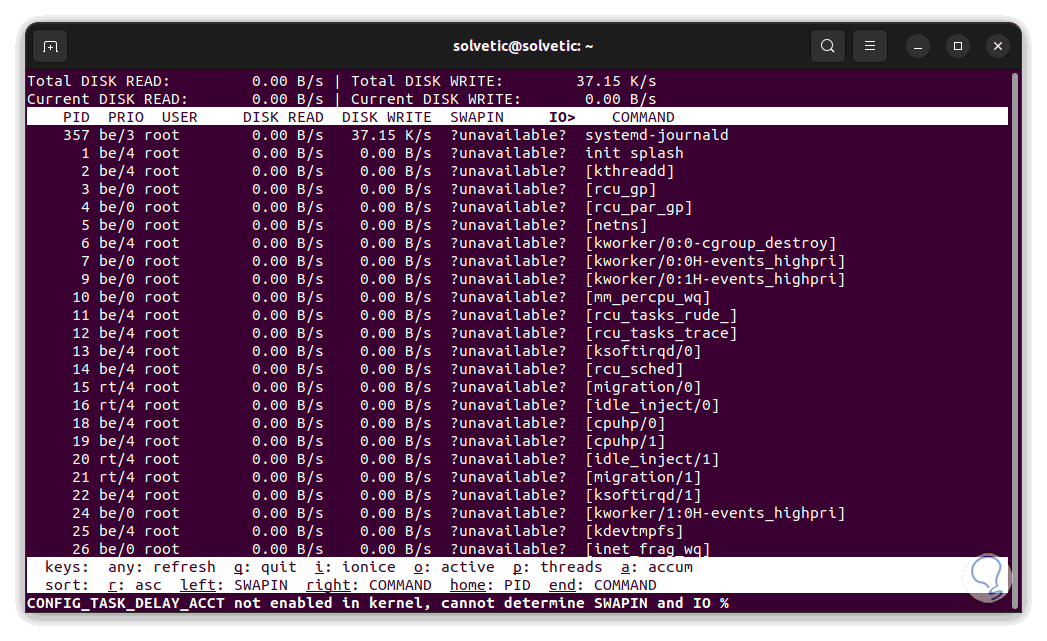
Step 4
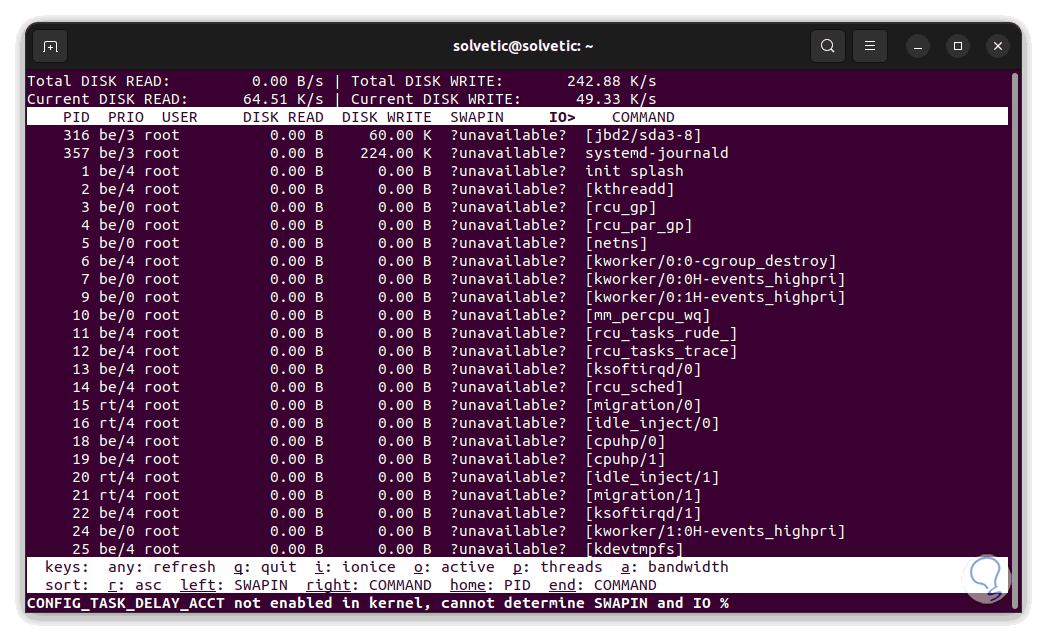
To see processes and bandwidth run:
sudo iotop -P -a
Some extra options are:
- -o, --only: show processes or threads that perform I/O operations
- -b: activate non-interactive mode
- -n NUMBER, --iter=NUMBER: indicates the number of iterations to use
- -p PID, --pid=PID: is a list of processes/threads to monitor
- u USER, --user=USER: allows you to enter a list of users to monitor
- -a: display accumulated I/O instead of bandwidth
- -k, --kilobytes: use kilobytes instead of the default size
- -t, --time: add a timestamp on each line
With these options it is possible to have an administration on the I/O of the hard disk in Linux.