A Linux server offers the administrator multiple options when it comes to managing the processes and tasks that this type of system covers and something essential for everything to work as expected is the performance of the system and this in turn is linked to the performance of the equipment. where it is installed and two of the key components are the CPU and RAM. That is why it is interesting to know methods to be able to monitor Linux servers to know what is happening..
If any of these presents overload or instability, we will be facing a general impact on the server's performance and as administrators we will be able to supervise and monitor their values in real time when we can even monitor Linux hard drives to see their behavior. It is for this reason that TechnoWikis will explain how to monitor the performance of a Linux server and as a bonus we will teach you those steps in a client system such as Ubuntu 22. We are going to see the importance and usefulness of monitoring a Linux server when we want to have information about Linux server performance in real time.
To stay up to date, remember to subscribe to our YouTube channel!
SUBSCRIBE ON YOUTUBE
1 Monitor Linux server performance using Glances
Glances is an application written in Python that can be used on GNU/Linux, FreeBSD, OS X and Windows systems, this is a monitoring tool which seeks to generate a detailed report based on a graphical resource or on some systems using the Glances based interface. On the web, some of the information parameters used include:
- It is possible to export system statistics to CSV, InfluxDB, Cassandra, OpenTSDB, StatsD and more
Step 1
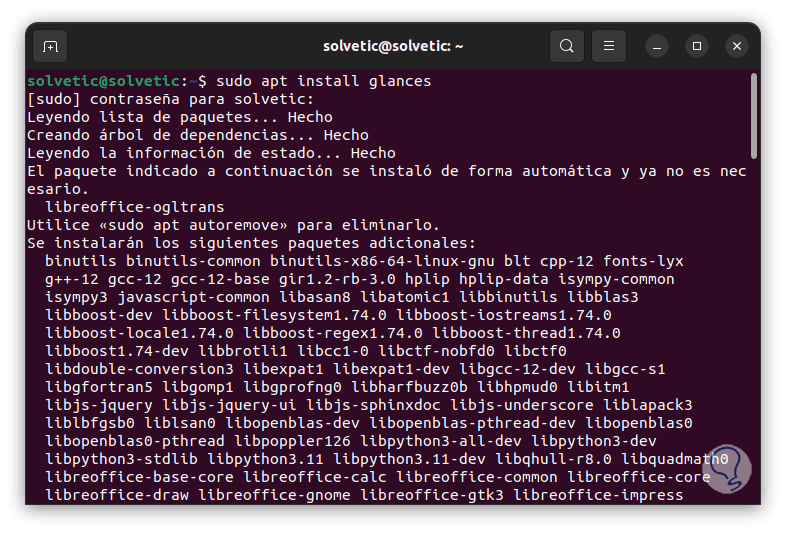
We install Glances on the server by running:
sudo apt install glances
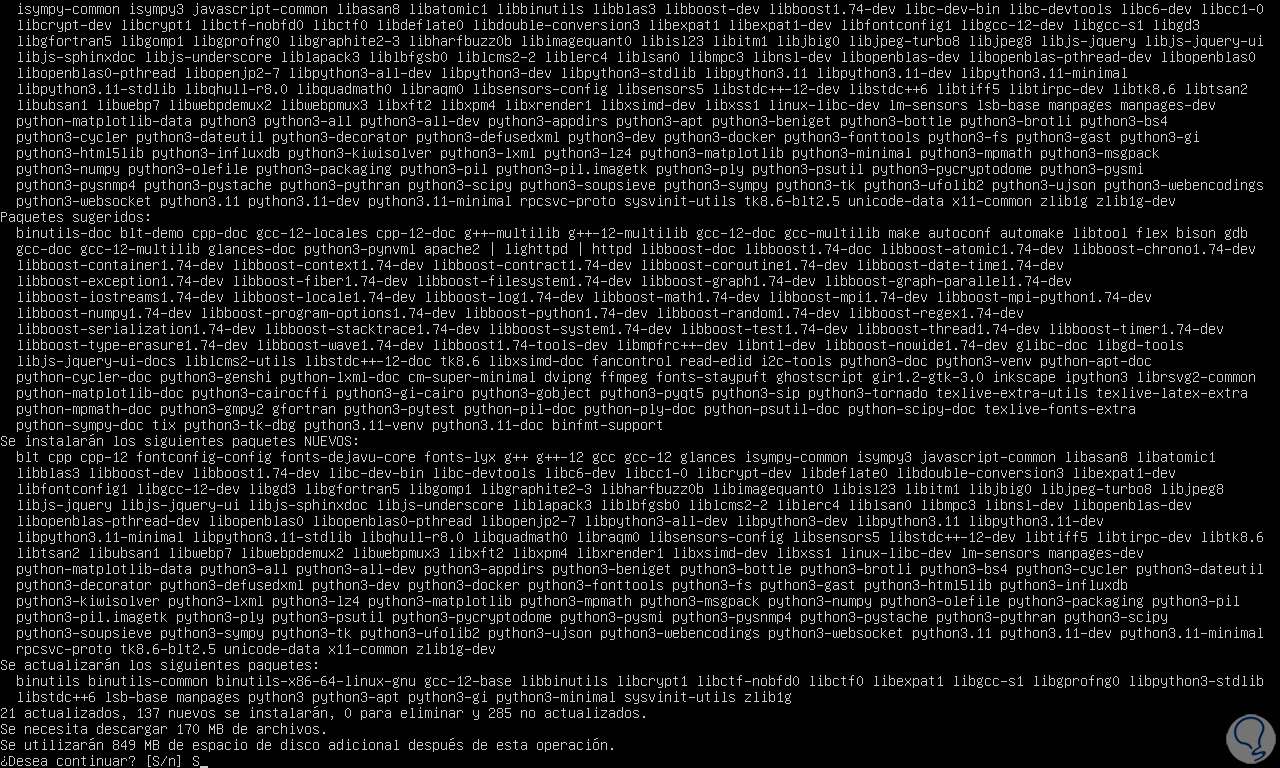
Step 2
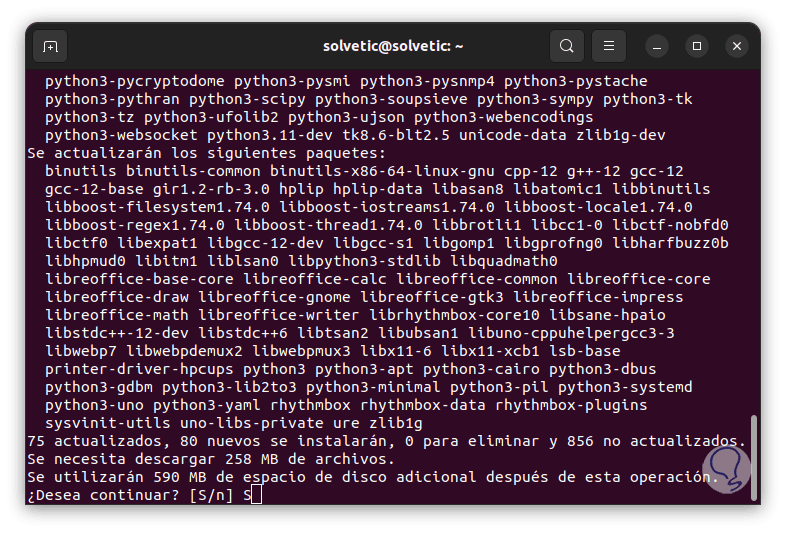
We enter the letter S to confirm the process:
Step 3
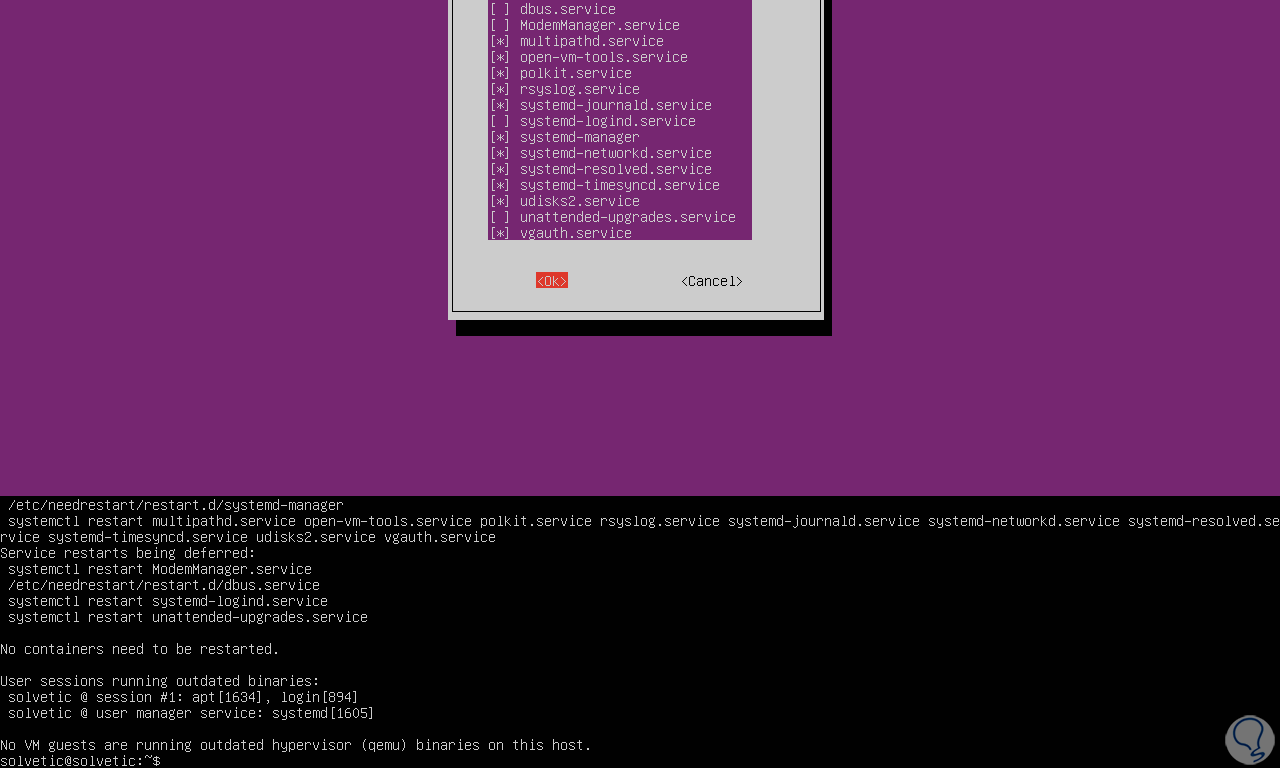
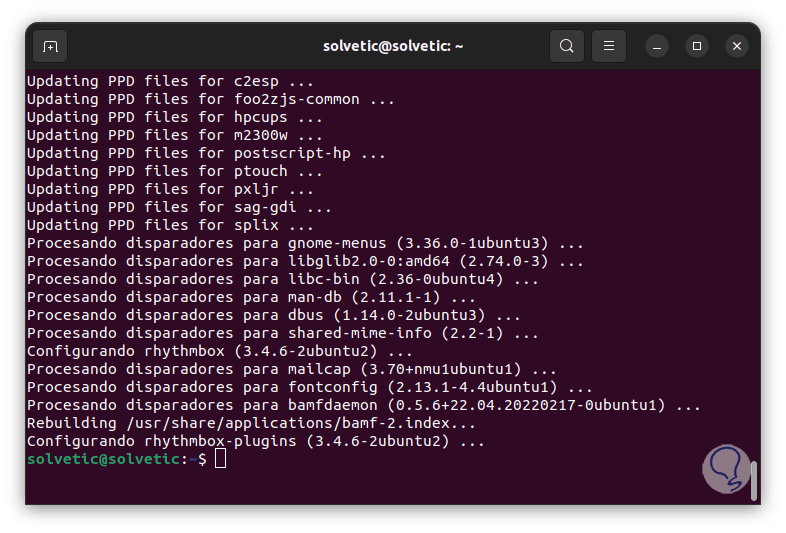
On the server we will see the following message indicating the processes that have to be restarted:
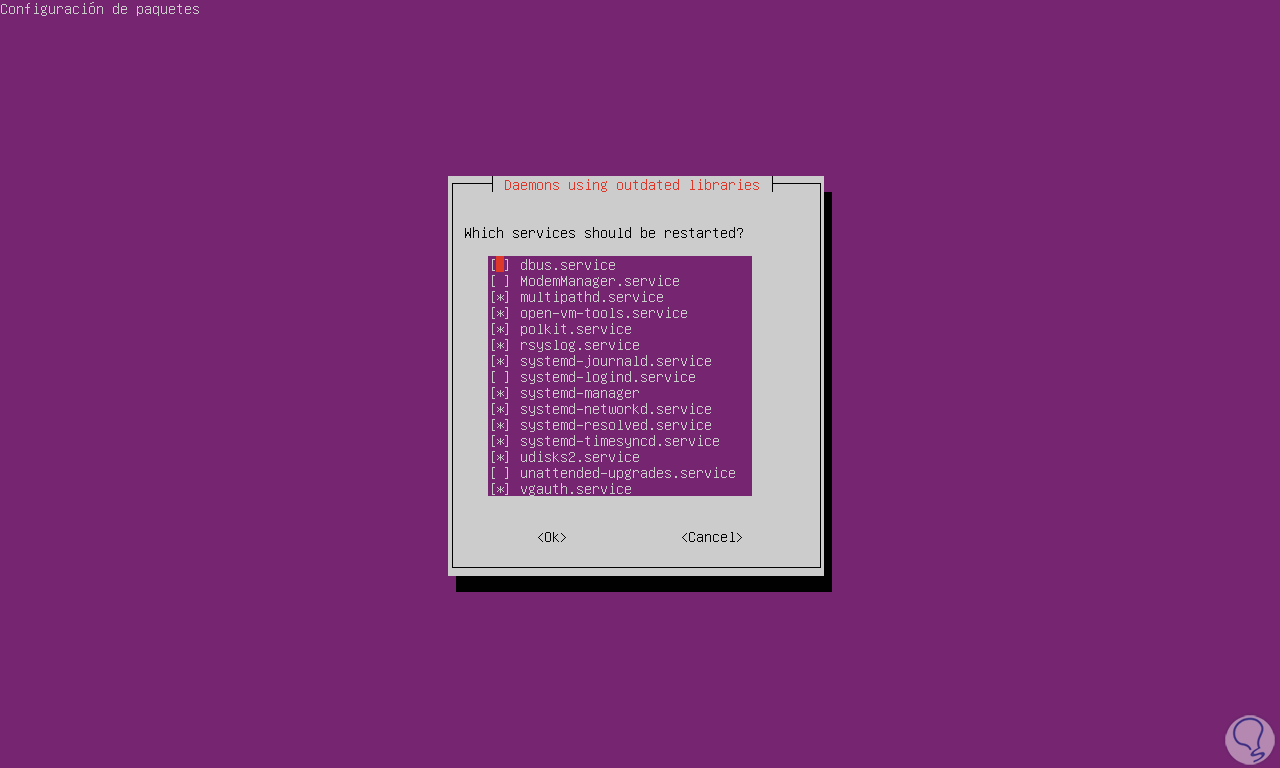
Step 4
We click OK to complete the process:
step 5
If we do this process in Ubuntu 22 we execute the command:
sudo apt install glances
step 6
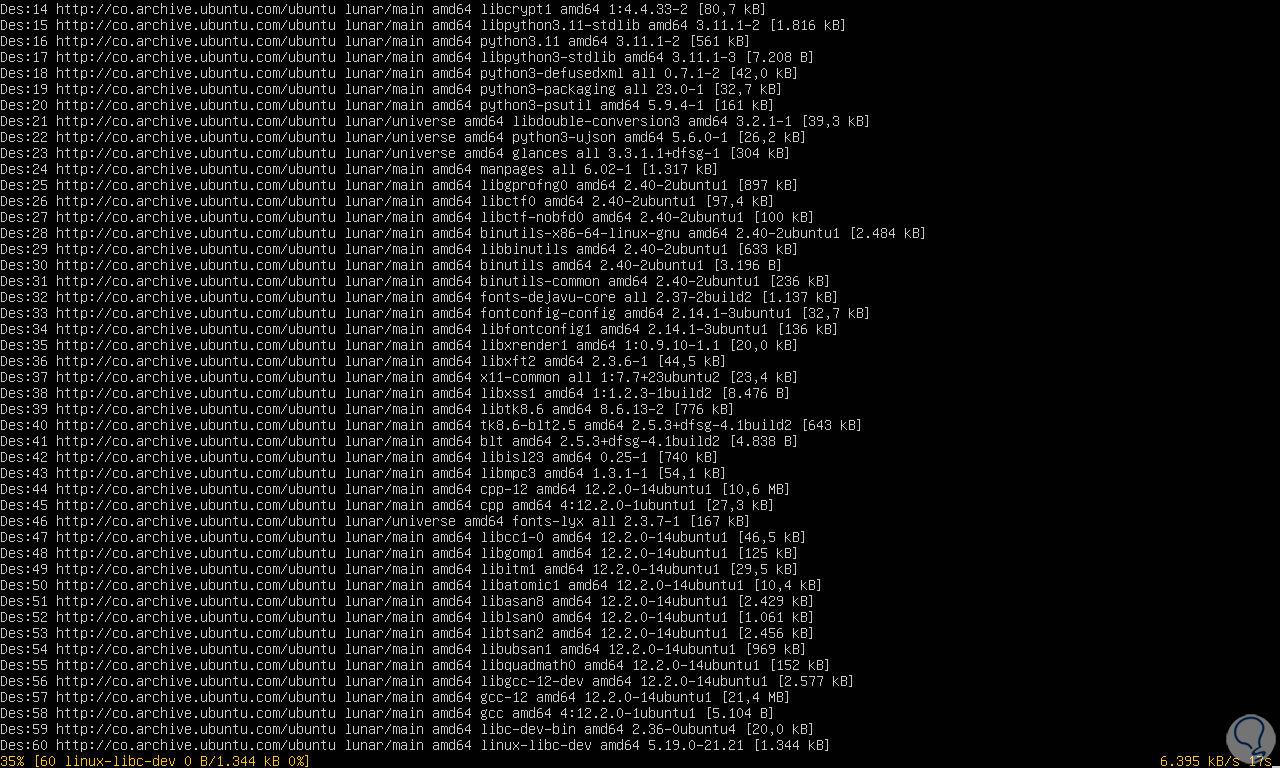
We confirm the download and installation:
step 7
We hope it comes to an end:
step 8
For other editions of Linux we execute the following to install Glances:
- sudo yum install glances (RHEL/CentOS/Fedora and Rocky/AlmaLinux)
- sudo emerge -a sys-process/glances (Gentoo Linux)
- sudo apk add glances (Alpine Linux)
- sudo pacman -S glances (Arch Linux)
- sudo zypper install glances (OpenSUSE)
step 9
On the server run:
glances

step 10
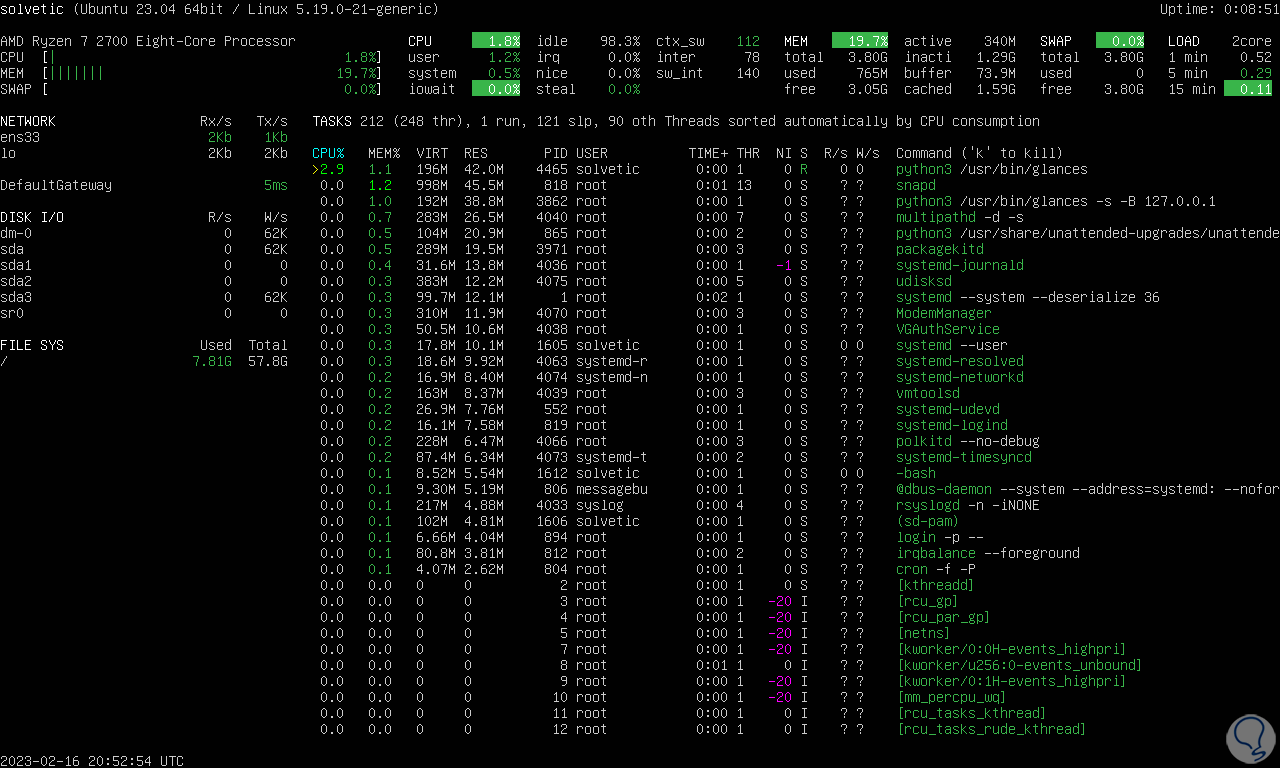
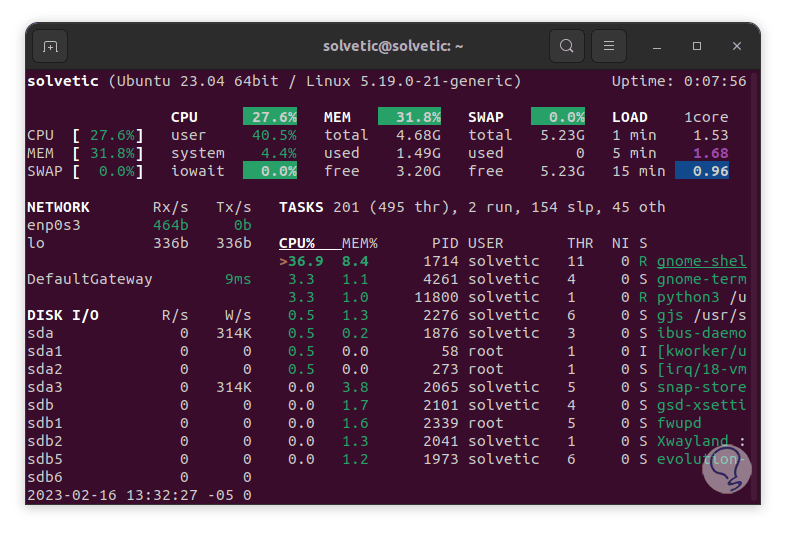
On the server we will see the following:
step 11
We see at the top a complete summary with details such as:
- Used percentage of RAM, CPU, and SWAP memory
step 12
In the central part we find:
- Number of tasks in real time
- CPU and memory usage for each task
- PID and user assigned to the task
- Command associated with the task
step 13
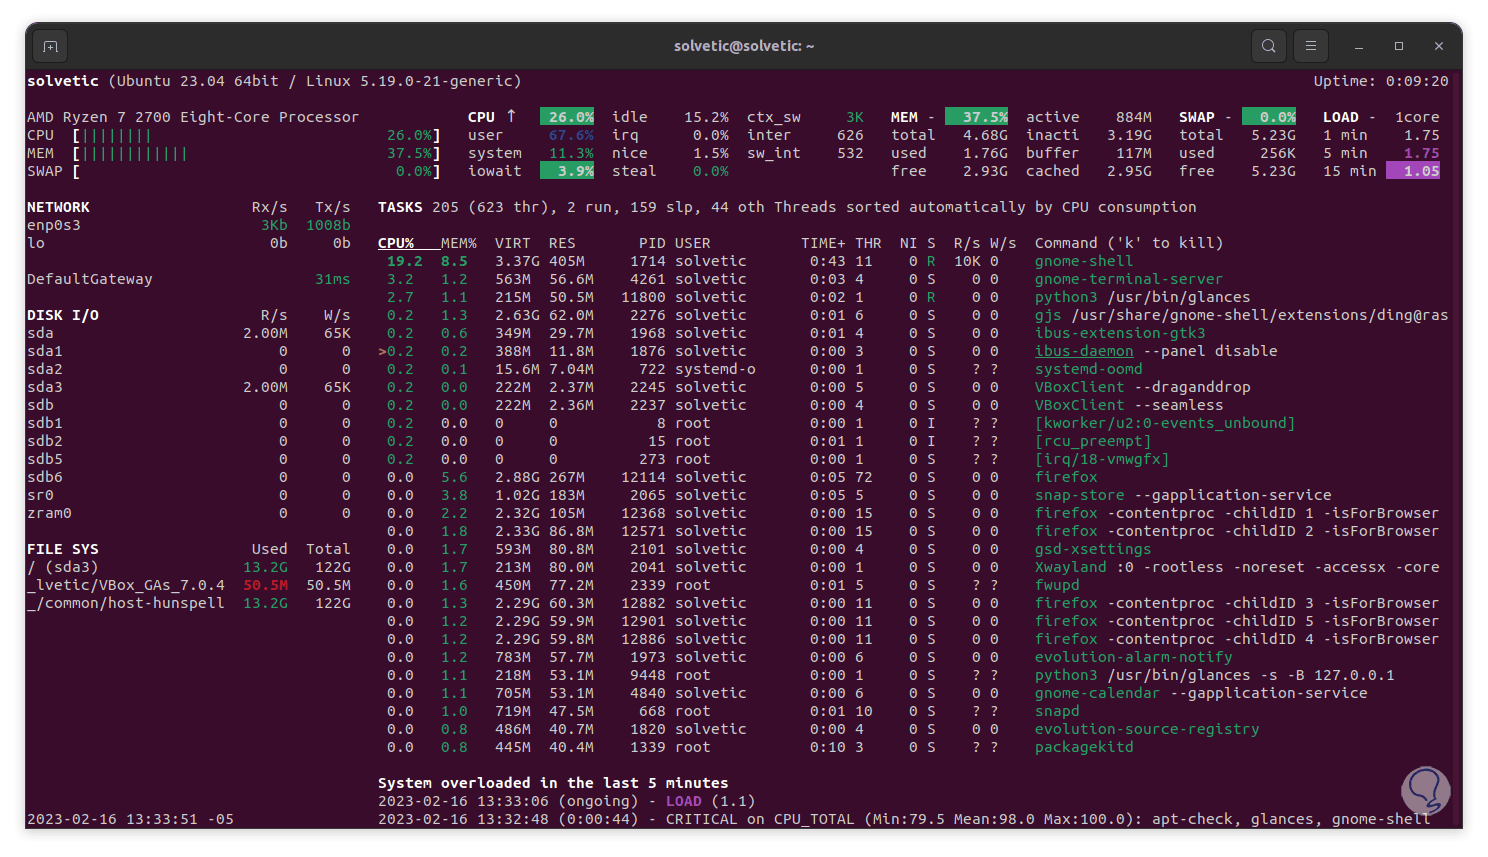
In the case of graphical Ubuntu we find the same details, only in a more organized way:
step 14
We can extend the terminal for a better perspective of the data:
2 Monitor Linux server performance using Top
Step 1
This command is very popular in Linux to access details of the performance of the system and its components, by default it is installed on the server and to use it we just execute "top":

Step 2
As a result we will see the following:
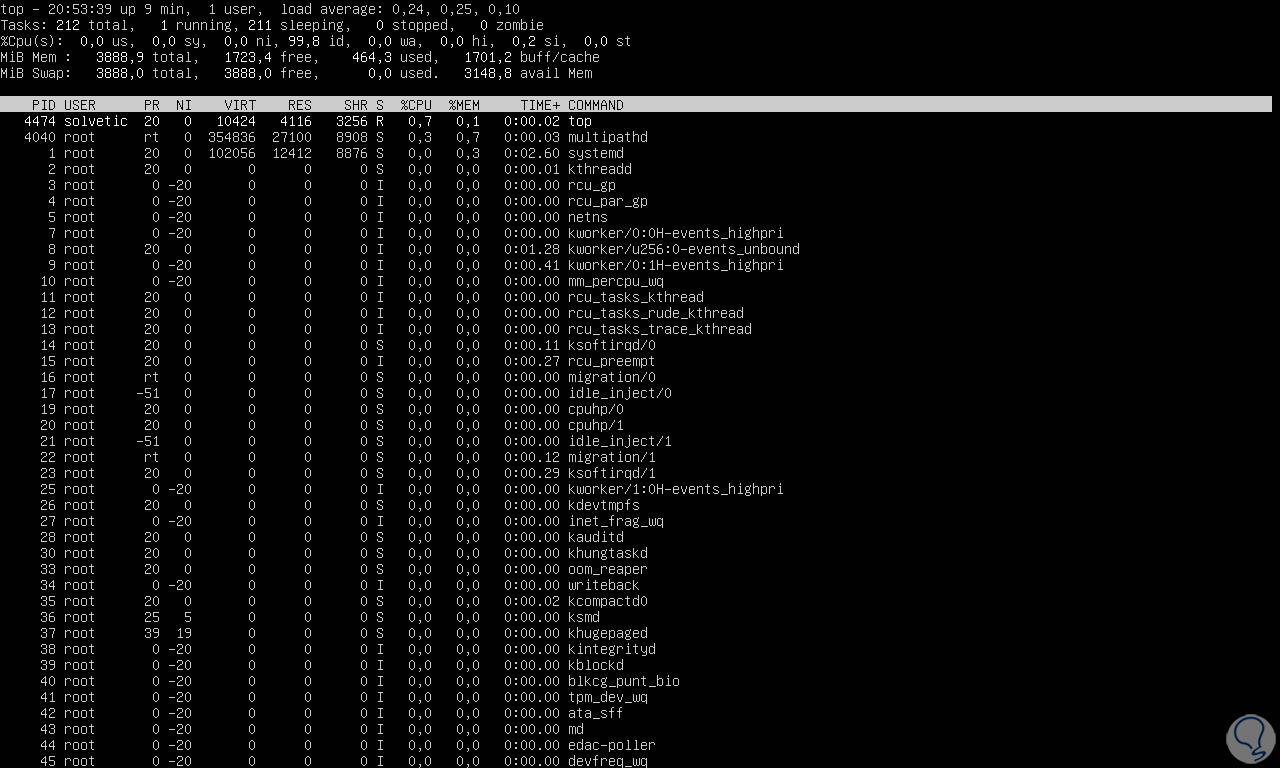
Step 3
At the top we will see details about:
- Number of active, running and sleeping tasks
- Number of connected users
Step 4
In the central part we will see:
- PID and user of each process
- RAM and CPU usage percentage
- Shared memory size (kb) used by a task (SHR)
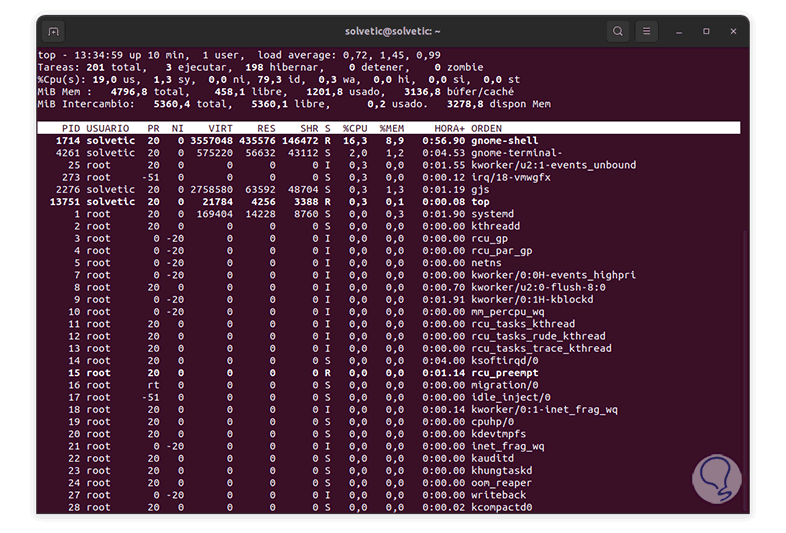
step 5
In the case of Ubuntu the result is similar:
3 Monitor Linux server performance using Htop
Step 1
Htop is an improved version of Top in terms of details and information, since it makes use of interactivity, we execute "htop" on the server (it is installed by default):

Step 2
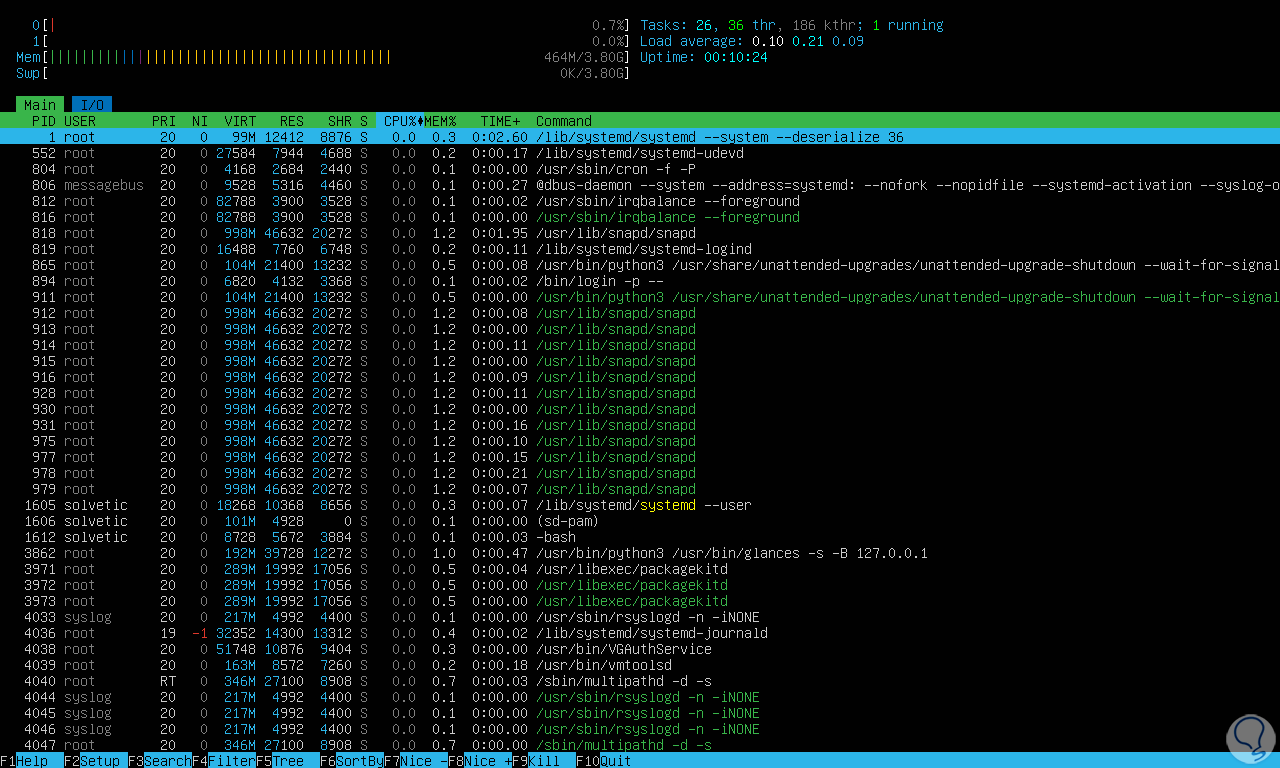
The result will be the following:
Step 3
At the top we find details such as:
Step 4
In the central part we find:
- Amount of virtual memory used
- Usage, in percentage, of CPY and RAM
step 5
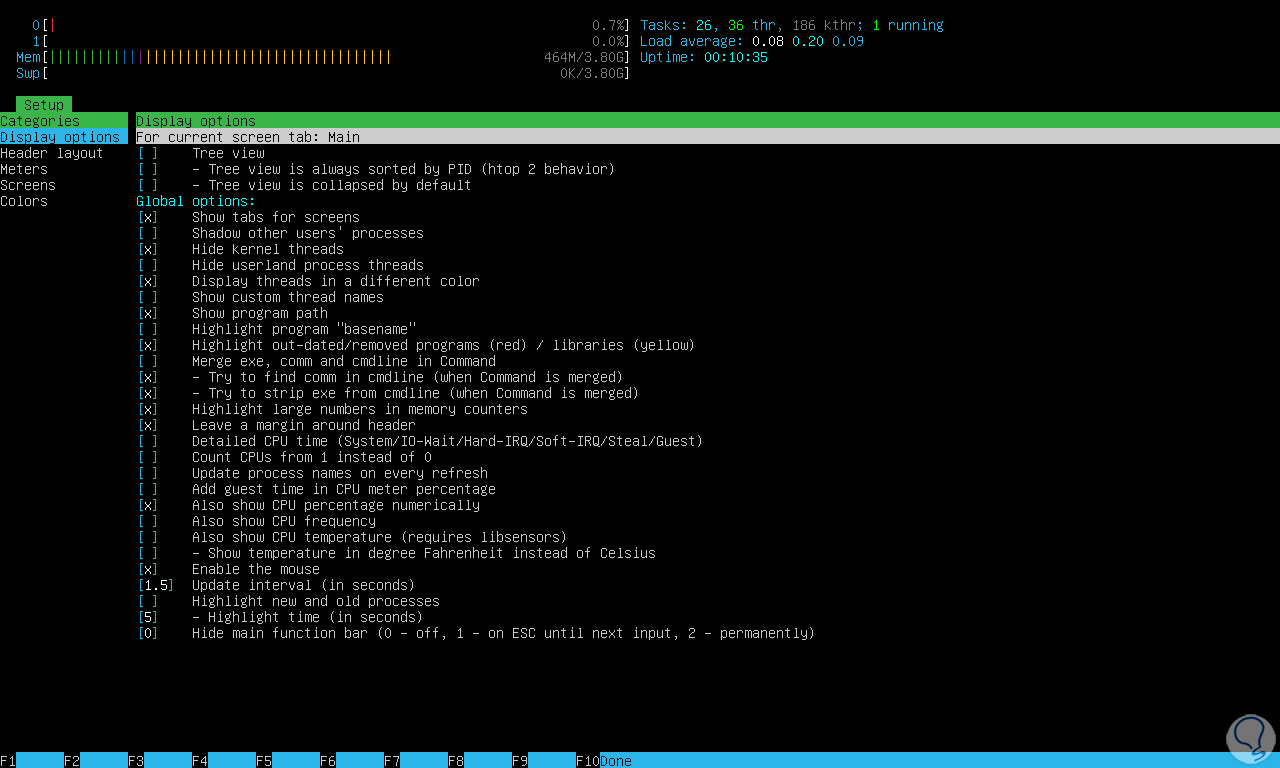
By pressing the F2 key it will be possible to access the configuration menu:
step 6
In the "Display" section it will be possible to activate (with the space bar) the visible results, with the Tab key we can navigate between menus.
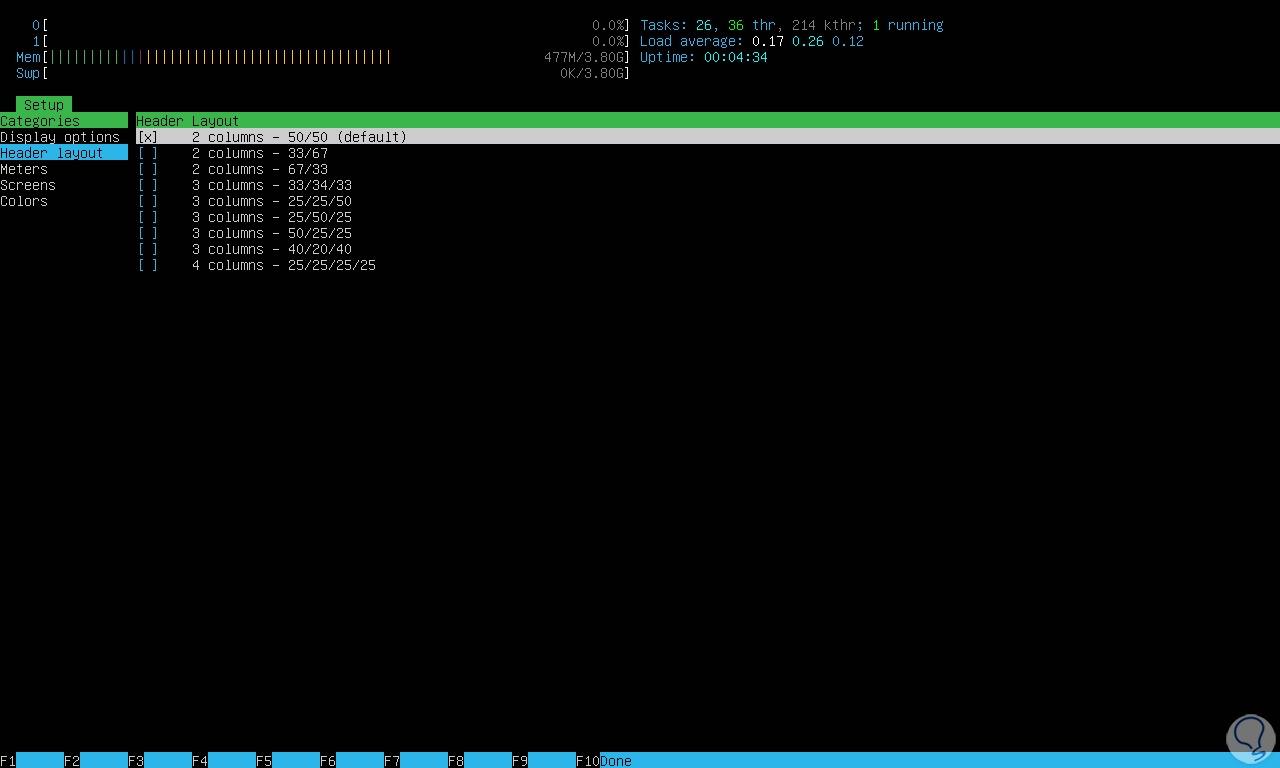
In Header we define the number of columns to use:
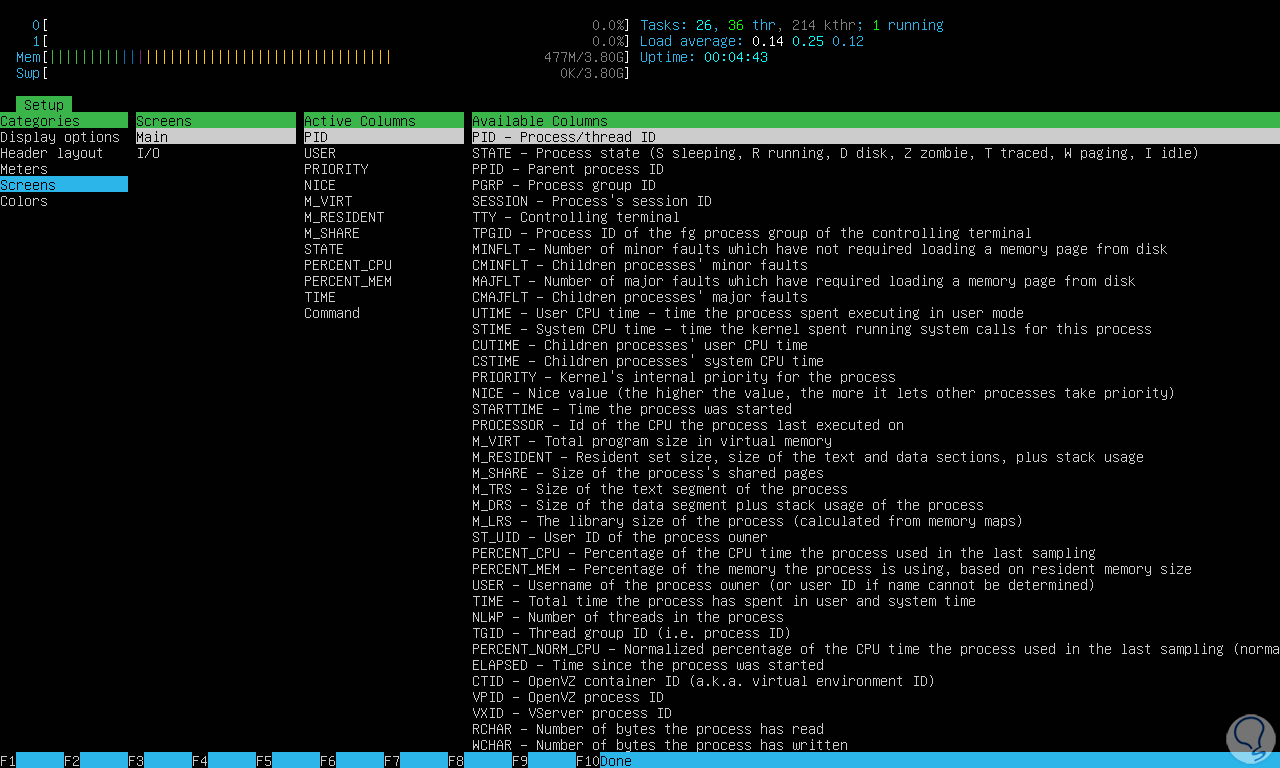
step 7
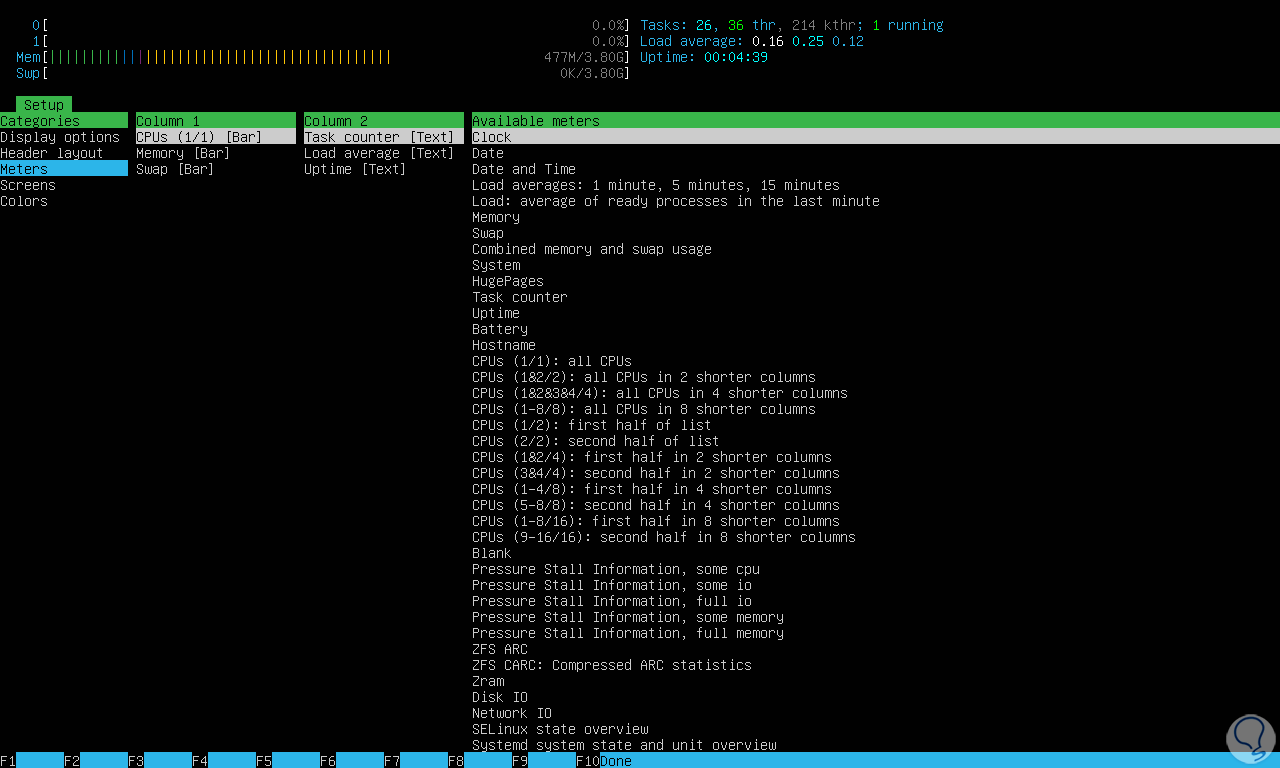
In "Meters" we can define which criteria will go in each column:
step 8
In “Screens” we can see the main screen (Main) and the auxiliary screen (I/O) with each descriptor displayed there:
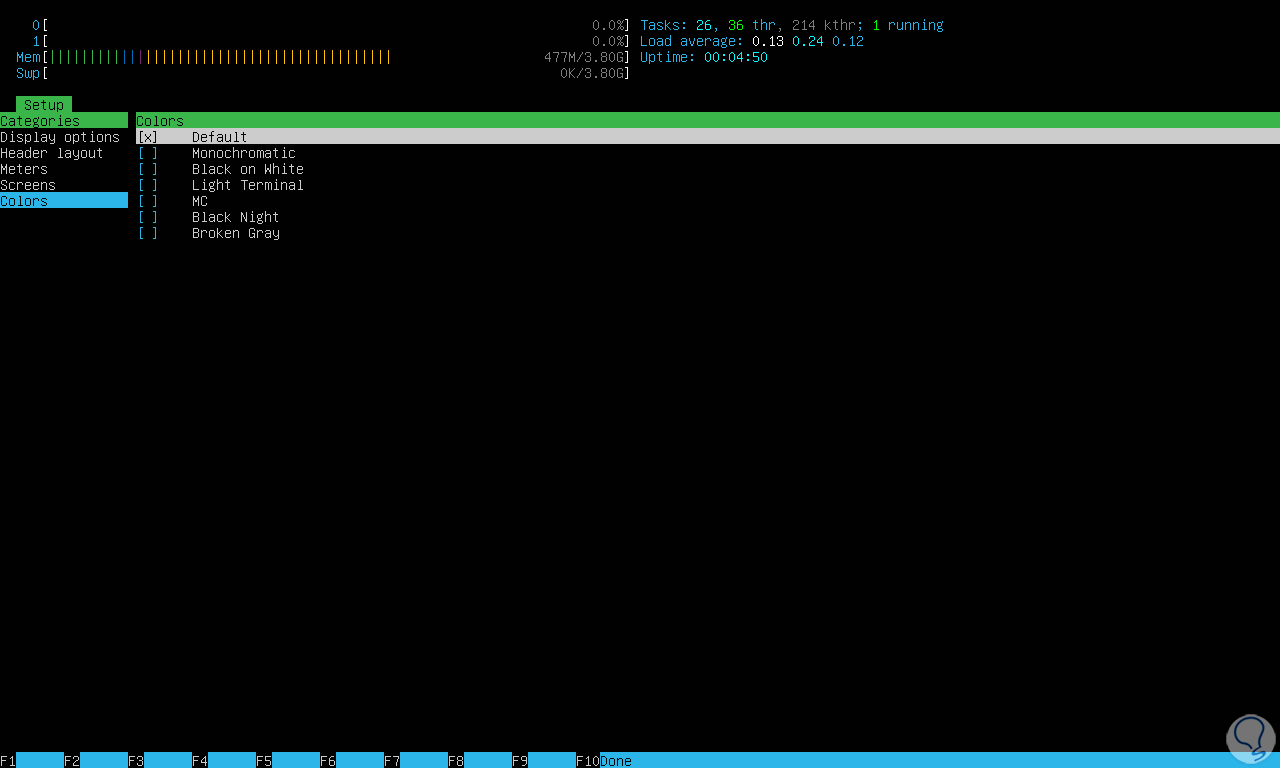
step 9
In "Colors" it will be possible to define the color to be displayed:
step 10
In the same way in Ubuntu 22 we can access all this information but there, on client computers, it will be necessary to install htop, for this we can use one of the following options:
- sudo apt install htop (Ubuntu and Debian)
- sudo yum install htop (RHEL/CentOS/Fedora and Rocky/AlmaLinux)
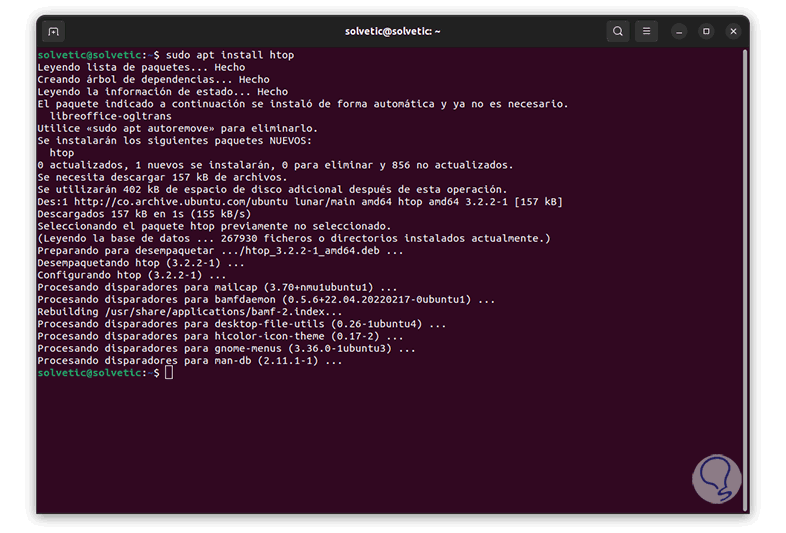
step 11
We execute htop to access the results:
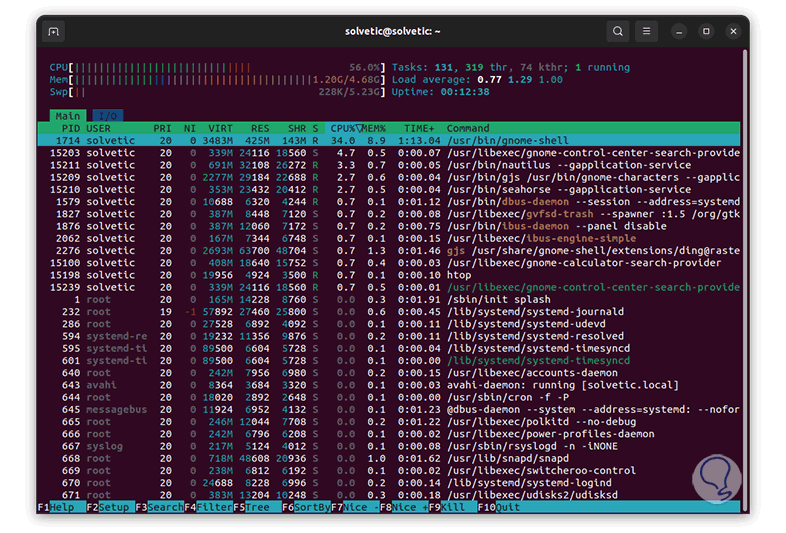
step 12
As an extra point, it will be possible to know the uptime of our server with the "uptime" command:

step 13
To know the total number of processors we can execute:
cat /proc/cpuinfo | grep processor

step 14
To see the main running processes by CPU usage, we execute:
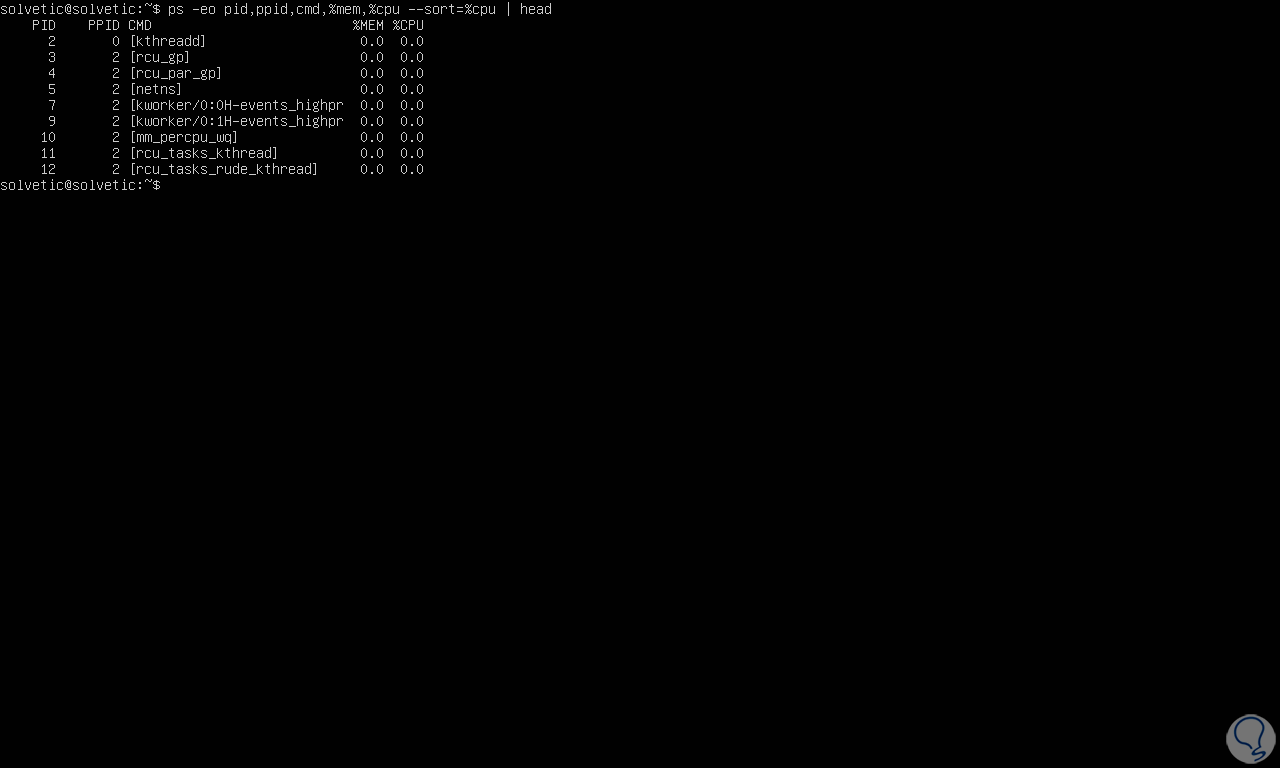
With these options that TechnoWikis has taught you, it will be possible to know the performance of the server and thus work directly on it..