Joining information from two tables when we work with data is a task that is as frequent as it is necessary on many occasions where the information is disaggregated and we must find a way to join it. Joining the information from two tables makes sense from a reporting and analysis point of view, when we have the task of analyzing the data and making decisions, we must have all the important information where the indicators, KPIS or objectives are located..
In other words, when making decisions, the information must be true, we must first make sure that the data is correct, does not contain errors and faithfully reflects what happened, but we must also ensure the integrity of the data, we must be sure that we are working with all the necessary information, we must be convinced that the information is complete. Let's say that, in order not to see a half-truth, we must always have the complete photo, although at the time of reporting and of course not all the fields are shown later.
With this objective, that of always working with complete information, Power BI includes two functions that are really useful and we will always use them once we know of their existence, and whenever it is necessary to join two or more tables. These functions are called combine data and append queries. Although we already explained where the join tables function is and how to use it briefly in how to use the Power BI Editor, below, we will explain in detail what options exist in Power BI to be able to join tables, depending on the organization of the tables..
Combine queries and append queries
As we will see below, there are two very useful functions when we need to merge data with different sources, or that are found in different files. When the information we need to analyze is separate, when the information is not in the same document or file.
Being able to join tables in Power BI is an important function as we have mentioned because you can combine data from various sources or origins in such a way that they are merged and can be seen as a single table, in a single view, facilitating the analysis and subsequent elaboration of the results. reports.
When we put tables or information together, we can make more accurate and complete reports, we can make reports that combine the information that is important to count, and we can make the right decisions by taking all the information into account. Let's say that having all the information collected in a table will allow you to have a single database with which to work, and which will also be the one that you are going to use to make the reports..
Being able to gather data accurately is a useful function whenever we have disaggregated information, and especially when we find information hosted in different sources, files or different Excel sheets. As we will see below, there are different ways to join the information, depending on which final table we want to create, depending on the data that we are going to join.
- Join data tables horizontally: When it comes to joining two tables in Power BI that complement each other, then we will use the "Join Queries" function or tool.
- Join tables vertically; When we want to add new records to a data table with those of another table. When the data we want to join is positioned one below the other because they have the same data structure (same columns, same column names, same information, and in the same order).
1 Differences between combining queries and appending queries in Power BI
When wanting to join two or more tables in Power BI, we will use the Power BI tools "combine queries" and "append queries" . There are two functions of the Power BI editor to respond to different demands when joining tables:
Combine queries in Power BI. What does it mean to combine queries in Power BI? Data joining or query joining is the joining of multiple tables of data (which may be from different sources) into a single data set. This data set will have more complete information at the column level, since we will be adding more information to the original data tables. We say that it is complementary information since by merging two or more tables we are obtaining a single table with more data structured in columns.
The combination of data is therefore an information crossing where a common field is used, a column that contains the two tables with a unique identifier. In this way, with a unique identifier in two tables, we will be able to cross information and create a single table that contains all the information.
As we will explain later, there are different ways to combine the information, creating a new query or changing the query on which we are working.
We call data joining in Power BI a horizontal table join; As we have explained to you, when we combine data we are adding more information with new columns.
For example, let's imagine a supposed case in which we have, on the one hand, a file with data on sales made, with information only on the salesperson who made the sale in each case; And, on the other hand, in another file, we have the information on the sales made with the information on the product that has been sold, the dates, and other information regarding the sales. When making reports, we are interested in having this information united in a single table. If we have a unique identifier in both tables, such as a sale ID, we can use this data column to cross-reference information and have sales and commercial information in a single table, how about the products that have been sold. Thus, we will know, for example, which commercial sells more of each product, when each commercial sells more at the product level,
In this case, when we combine queries, we must work with a common field that is present in the two tables that we want to join, or in all the tables that we want to join in case there are more than two. What matters in this case is that the unique identifier is well associated with each sale, it is not repeated, that all sales have a unique identifier, and that this is a pattern that is repeated in the different tables that we want to merge.
Append queries: There is another type of data unification, which refers to the "vertical data fusion". That is, said in a more simple and vulgar way when we want to paste the data from one table below the other. This type of data unification is normally used when we have different files that contain the same data structure in terms of columns, but in order to analyze it objectively and globally it is necessary to unify them.
For example, let's imagine in this case that we have several stores in different regions, with information on the sales made in each store. Each store in this case generates a file independently from the other stores, which contains all the information regarding its sales. In this case, we would be interested in being able to unify all the files that each store generates with the information on their sales in one single file. In this way we will be able to analyze all the information jointly, and we will be able to make reports in which we can see which stores generate the most sales, which product each store sells the most, who are the commercials that sell the most globally, where each product is sold the most, etc It gives us, in short,
These are just a few examples of decisions we could make at the company level, as long as we look at the data together and comprehensively.
In order to append queries, it is advisable to review the files that we are going to join so that they all have the same data structure: same columns, in the same order, and with the same column nomenclature. These are details that can make our work much easier. In this case we would not need a unique identifier or field in common, but we need the files to be merged to have the same structure and order.
2 How to combine Power BI data
As we have just seen, combining data is a Power BI option to be able to join several tables and with different sources into a single data set, in order to be able to analyze the information together and be able to report the information with the integrity of the data. In this case we will use a common field that, as we have commented and emphasized, must be a unique identifier.
To combine queries, we are going to use the Power Query editor, which we can access at the time of data import, or from the Power BI Desktop menu.
Steps to be able to combine data in Power BI
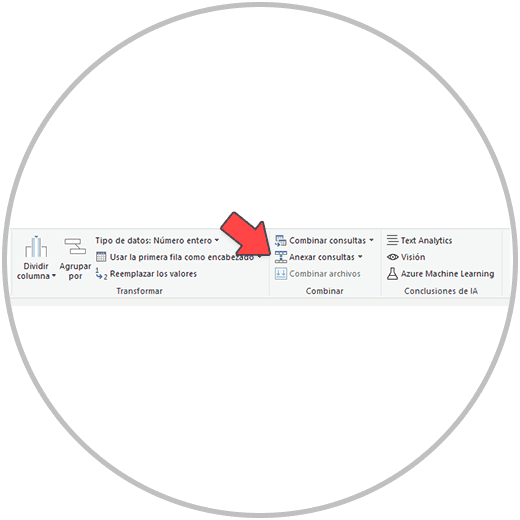
From the Power BI start menu, in "Start" we will find the "Transform Data" option as shown in the image below

But we are going to explain the start process, from the import of the data, so that you can see better and understand the complete process. As an example, we are going to use an Excel file with two sheets that corresponds to the sales of a fictitious company that offers computer services and products.
On the one hand, we have a data sheet with information on the sale, on the other we have an Excel sheet with the information on the product or service sold. In both channels, we have a unique identifier for each sale made (we call it IDU from now on). This is the column that we will use to carry out the information crossing.
From the Power BI Desktop menu, we are going to go to Start, and click on “Excel Workbook”, as in the image below.

Next, we must select the Excel file that we want to import. We select the file where the Excel sheets that we want to combine are, and we click on the "Open" button.
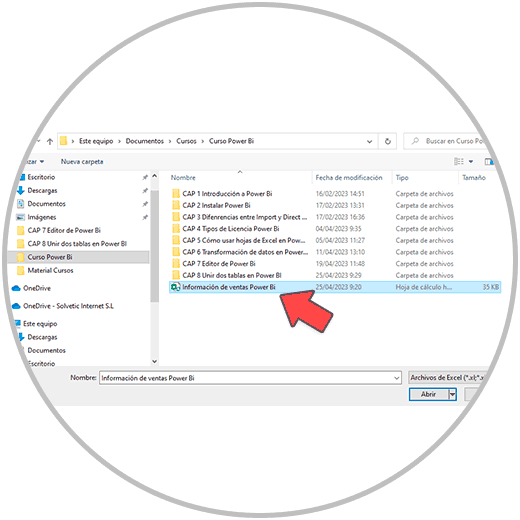
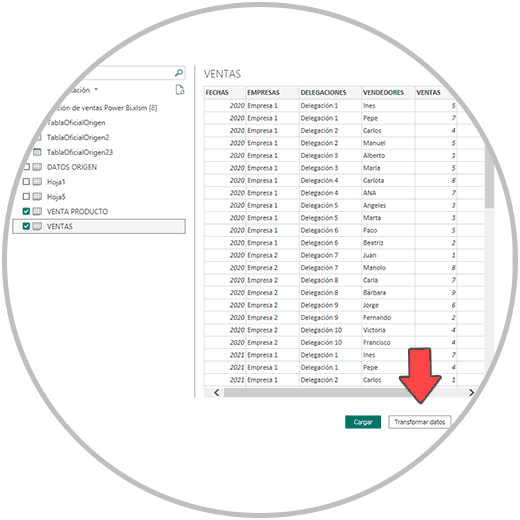
Next, we are going to see how a new window opens, where we have to choose the Excel sheets that we want to import. In the example, we select the Excel sheets "SALES" and "PRODUCT SALES" which are the sheets where the information we want to merge is located. Once the sheets to import into Power BI have been selected, we click on “Transform data”.
IMPORTANT
If instead of clicking transform data, you clicked load, that's okay, you don't need to go through the import process again. As we have already mentioned, we can access the Power Query editor for data transformation at any time from the Power BI menu, by clicking on "Transform data" within the "Start" options.
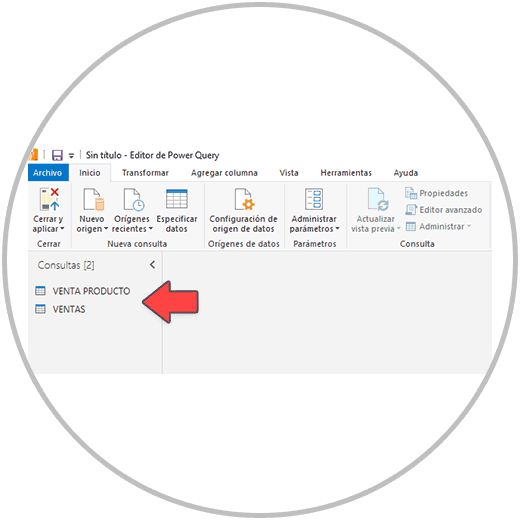
By clicking on "transform data", either from the import, or from the Power BI menu, we will see our imported Excel sheets in the Power BI Power Query editor, as we see below in the image, have been created as queries and we can now work with the data inside the editor to transform the data. In this we are going to cross the information of the two imported Excel sheets.
To cross-reference information (combine the two imported Excel tables), first click on one of the imported sheets. In our case we select the query "SALES" which is the sheet that has more information. Next, we are going to look for the “Combine queries” option in the menu.
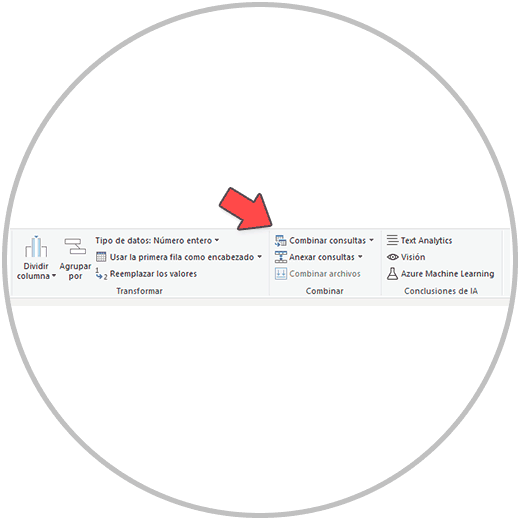
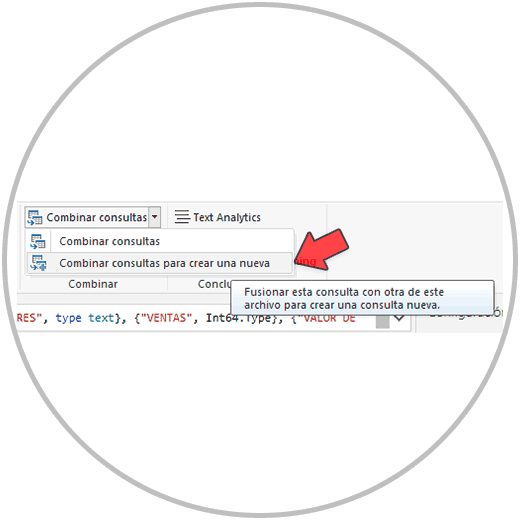
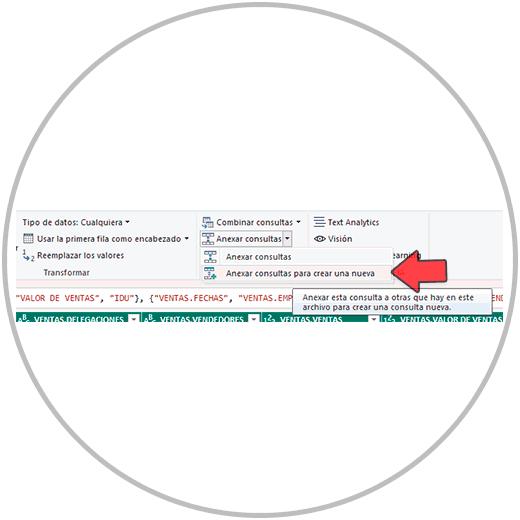
If we click on the arrow on the right we will see two options. Both options work for us, in this case if we want to create a new query, we will click on "Combine queries to create a new one". In this way, we leave intact the queries that we already had, which are the two imported Excel sheets, and a new query will be created with the complete information from the two sheets. We click on “Combine queries to create a new one”.
A new window opens where we must choose which data (queries) we want to combine in Power BI. From this new window, we must select the two queries to combine from the drop-downs, in this case following the example we choose the queries "SALES" and "PRODUCT SALE".
Once we have chosen each one in the drop-downs, what we are going to do is select a column in each case, in this case the "IDU" column, which is the column with the unique identifier that we are going to use to perform the crossover.
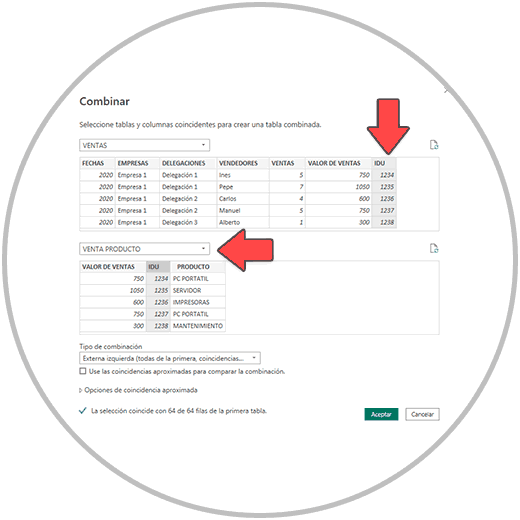
Now we have to choose the type of combination we want to perform. You can choose from the drop-down list the option that best suits the crossing you are making. As a rule, you can also create a full join of the two tables so that you can see all the columns in a single file; And then in the next step, delete the columns that you don't need, or that are duplicates if that were the case. We are going to select “all columns”.

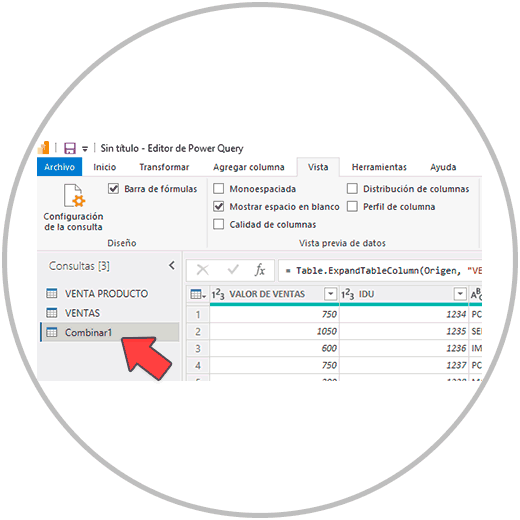
By accepting, we will see the new table with a new column. As we have chosen "Combine queries to create a new one", a new query will be created as we see on the left, called in this case "Combine1",
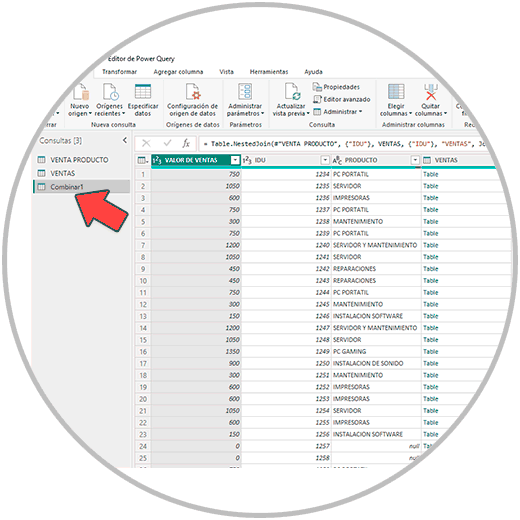
Now in the table that has been generated, we are going to see how there is a new column where the crossover has been made. In the cells of that column we will see in all an underlined text that says "Table".
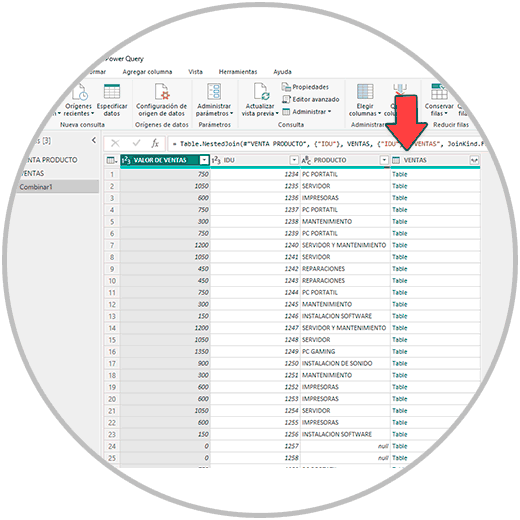
Next, what we are going to do is display the columns that we want, since as we have said we want to see all the columns of the two sheets that we imported from the Excel file. To perform this step, we have to click on the icon that appears on the right, in the last column. When clicking we will see how a small menu is displayed where we can choose which columns we want to add from the second table.
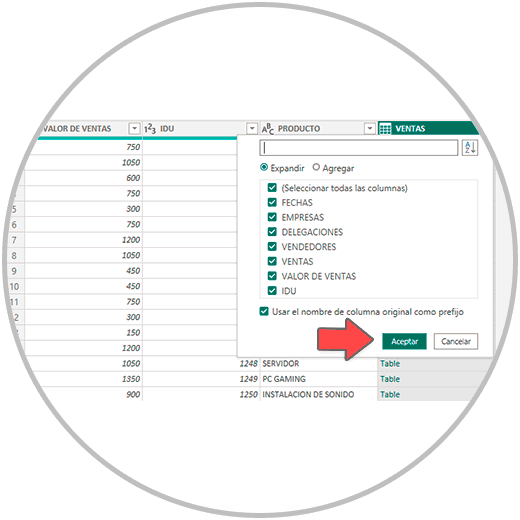
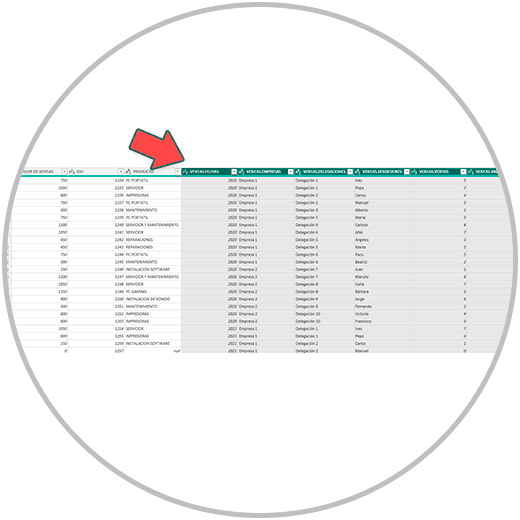
For this reason, we recommend that, as we have mentioned, you select "all columns" beforehand when making the crossover. In this step, you can select the columns you want. And in the case of including all by mistake, later you can eliminate the column or columns that you do not want to show in the table. We select all, and click on the accept button to now see if the new table (query) created from two different Excel sheets.
IMPORTANT
We remind you that, at any time, you can undo the steps carried out from the right side menu, called "Query configuration. Remember that CONTROL + Z does not work in Power BI, but that you always have this menu available to be able to go back to previous steps, since all the changes or steps that you carry out in your project are saved as steps, and that, in case of wanting to go back to a previous point, either by mistake, by mistake, or for another reason, you can quickly undo.
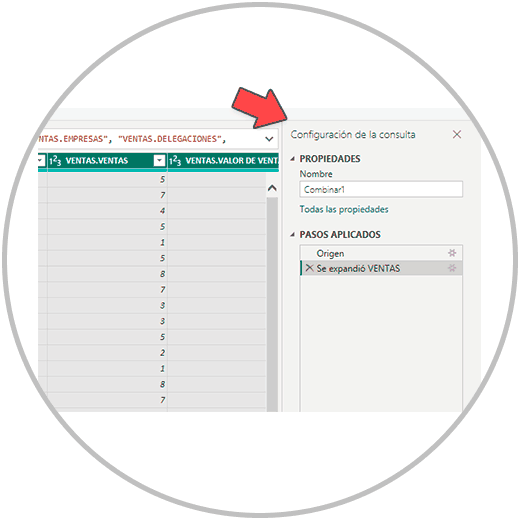
If at any time you have closed this window, also remember that you can display it at any time from the view menu, where if you have closed the window you will see that you will see the option to activate "Query configuration" first.
3 How to append queries in Power BI
When joining different tables, or databases in Power BI, as we have explained, there are different ways to join the data, depending on the need for the type of union we want to perform. If it is about joining databases by crossing information, as we have explained in the previous section, we will use the Power BI function called "Combine queries".
However, if the type of table fusion that we want to perform is to paste data one below the other in order to build a single table, then we must use the append query function, which, as we will see in the image below, is located just below of the “combine queries” option.
As happens in the combination of data, when we want to append queries, we will be able to create it from one of the queries already made, or as we recommend, we can create a new query. In this way, a new table will be created (new query) and we will leave intact the queries that we have already created. As we see below, we then select "Append queries to create a new one".
Now we only have to select the data (queries) that we want to append and Accept.
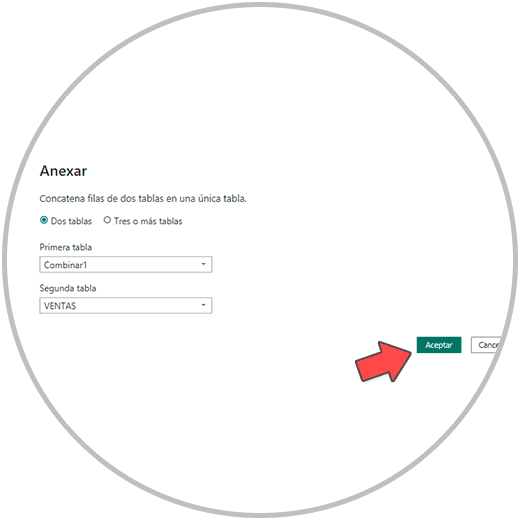
We will then see how a new query has been created, which we will see reflected with a name in the list of queries that you will see in the menu on the left. In the resulting table, you will be able to see how the data has been positioned one below the other according to the structure of the two tables. At this point it is very important that you check if the table created is correct and the data in the columns of the new query created are correct, that is, in the vendors column, in all the cells of the vendors column there is a name of people, and that in the cells of the sales value column, the sales values are seen.
Now that you know how to import data, and how to combine queries and attachments, you will be able to create new queries. That is, new tables that contain the necessary values, as we said at the beginning, that they be true and complete, in order to create our reports, visualizations or to generate a new model.
As we have seen, Power BI is a very complete tool, and it has an answer to the demands of professionals who have to manage a lot of data. Not only from the point of view of reporting, or analysis, but also from the management and treatment of data; Very relevant tasks to ensure the integrity of the data and the veracity in the reports that we will carry out later.
As we have commented, in the "data transformation" phase when we work with Power BI, the most important aspect is to be able to confirm that the data with which we are going to work is valid. For this reason, Power BI offers the Power Query editor with which we can transform data: make changes to the data imports that we make in Power BI, changes that go in the dynamics of being able to establish the same criteria of nomenclature, order and structure, as well as to confirm the veracity of the data.
One of these tools that stands out in the transformation of data due to its tremendous utility is the combination and annex of queries, with which we can unify several data tables into one. A fundamental aspect when analyzing the reports holistically, that is, taking into account the globality of the data, we can subsequently analyze and report the data at all levels: jointly, but also more individually or segmented. But to be able to compare data and make decisions, unifying the information is a fundamental aspect, which Power BI assumes in order to offer solutions that help unify tables. (cross information with guarantees of success).