Calculated fields are a very useful Power BI resource, as we saw and explained in the differences between calculated fields and measures in Power BI. It is a very useful resource to be able to add new information to our data tables, to be able to complement the information with new columns where we can perform calculations and operations, just like we do in Excel or other spreadsheet programs..
The calculated fields are useful, and in many cases necessary to be able to carry out calculations that will later be reflected in our visualizations, in our reports. This opportunity, or need in many cases, arises after connecting the tables and building our data model. By connecting our data tables, we are relating all the information contained in various data tables. And it is at this moment where the opportunity (or need) of having to perform calculations, new columns with ratio calculations, or perform other operations may arise.
If we are used to using Excel, Google Sheets, or another spreadsheet program, it will be easy for you to create calculated fields within Power BI. The language base, or the formulas that we use in Excel for example to add, concatenate cells, calculate the maximum value, the minimum, conditional functions, ... in Power BI follow the same structure in the function, although they are represented in a different way , as we will see below in the example..
In Power BI, the concept of a cell disappears, unlike in Excel. Calculations in Power BI are performed at a table and column level. In this way, all the information that a calculated column collects has been done using the same logic. The possibility of not having dragged a formula to the end of a table disappears, for good, something that can happen to us in Excel. As we have already mentioned, Power BI establishes a more general calculation logic so that the work can be carried out in a more dynamic, faster way, without errors, automating part of the work that we are used to doing manually.
1 Characteristics of a Calculated Field in Power BI
As we already explained to you in differences between calculated fields vs measures in Power BI, calculated fields are operations that are performed on new columns. These columns will be created in the table where we are making the calculated field..
- New column in a table: To be able to make calculated fields, as we will see in the example, we must create a new column in one of the tables of our model. Calculated fields are very useful for custom calculations using information from one or more columns of our tables. This means in practice that we can carry out operations of addition, subtraction, multiplication, division (among many others), using various columns of a table; Just as we can also use only the information in a column to multiply it by a value, divide it, or perform any other operation.
- One of the main characteristics of the calculated fields is that the operations are carried out at the table level, as we have said, creating a new column where we can see the result of the operation that we carry out. At first, this can lead us wrongly to the conclusion that it is not possible to perform a calculation that involves using two columns from different tables in the same formula. A limitation that doesn't really exist, because we can use a Power BI resource in two ways to deal with this situation; This resource is called "Related", and it is a Power BI function that we can use in two different ways: We can use the "Related" function to bring a column from another table to the table in which we are working. It works like a “Search v” (v look up). We can also use the “RELATED” function, but this time directly in the formula, without having to bring us the column from another table so that the operation can be performed. An especially useful function since in practice what we want is the result of the calculated field, and not increase the number of columns of a table to be able to carry out an operation.
In the example that we are going to see below, we are going to explain how to make a calculated field, and how to use the "Related" function to be able to perform any operation between tables;
Important
We remind you at this point that in order for us to use the "Related" function in Power BI we are going to need to have our data table connected to the other data table where the other column is located. For this reason, we always insist on the need to build a data model that is valid, with data tables connected to the model.
Calculated Fields in Power BI are useful and also very easy to apply. Once we have already learned the characteristics that make calculated fields very useful for our project, we are going to see two very important aspects of calculated fields:
- The syntax or structure of the formula
- The procedure and requirements to be able to make a calculated field in practice
2 Formulas in Power BI: Syntax and structure of a formula in Power BI
When creating the formula in Power BI, the most important aspect to note is the way to create the calculated field, using the Power BI operations bar. When representing the formula, as we have already mentioned, the operations are carried out with a column hierarchy (and not a cell). The operations bar is also a practical resource where we see the Power BI philosophy reflected when it comes to working with data easily and quickly, using automation.
Power BI because, as we are going to see in the images, it makes it easier for us to work enormously with the text suggestions that it shows as we write. In this sense, it works like the search bar of a browser like Google or Bing, showing word suggestions as we type. In Power BI, in order to make a calculation, we must write the names of the columns that we want to include in the operation.
The field or column in the formula must be spelled exactly the same, and in the formula it must be enclosed in square brackets [] with the name of the table preceding the square brackets.
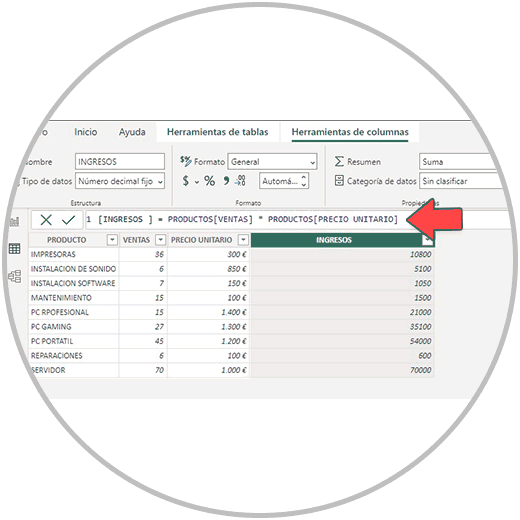
As we can see in the example below we are working on a table called Products. And within the table, we are multiplying two columns: one called "SALES" and the other called "UNIT PRICE". We have called the new column where we are making the calculated field "INCOME".
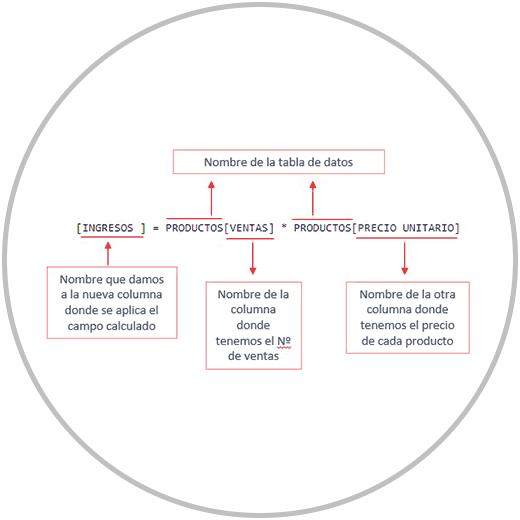
Formula of a Calculated Field in Power BI
In the calculated field formula, with the example we are seeing, we therefore see all these elements that are part of the formula:
- Name of the new column that we have named “INCOME”.
- Column name “SALES” enclosed in square brackets [] with the table name first. (The data table is called INCOME.)
- Finally, Name of the column "UNIT PRICE" between square brackets [] with the name of the table first, which as we have said we have called "INCOME".
The structure of the formula that we have seen is a reflection of how Power BI works, breaking with the classic concept of Excel where you can work at the cell level; In Power BI, in this sense, working cell by cell disappears, to work in a much more macro way. We work at the column level. These are differences that we are observing in learning and managing Power BI.
The syntax of a calculated field, as we have seen, has a different way of representing itself, where the names of the columns and the column tables are reflected in the formula itself.
Next, in the example, we will see how to make a calculated field. We are going to see the process from the import of the data, to see the complete process in an easy way, but going through all the previous phases such as the import, the transformation of the data, the creation of the model, establishing the relationship between tables , and finally we are going to calculate a calculated field with information that is in two tables.
In the example, we are going to see information from a company that sells computer equipment and servers and some accessories and peripherals. In this fictitious example we are going to see how to upload two Excel sheets to Power BI. The information of the products and the No. of sales is found in an Excel sheet "PRODUCT SALES" and in another sheet "PRODUCT PRICE" we have the unit price information.
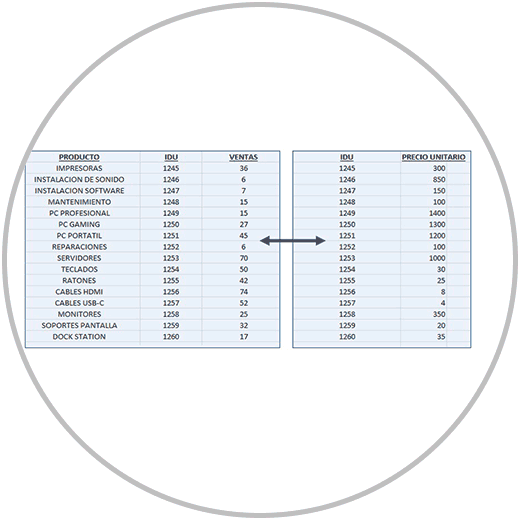
In the two Excel sheets, we have a common field that we are going to use as a key column to be able to relate the two and build our data model.
Then we will create a common field in one of the tables (PRODUCT SALES) that will act as a fact table. We will finally use the “Related” function first to bring us to what will be the fact table (PRODUCT SALES) the unit price column that will be in the “PRODUCT PRICE” table. Once we have all the information in the fact table, we will calculate the revenue per product by creating a new column.
Later, we are going to see how we can perfectly calculate the income per product directly using the related function in the formula to be able to multiply two columns that are in different tables.
3 Steps to create a calculated field in Power BI
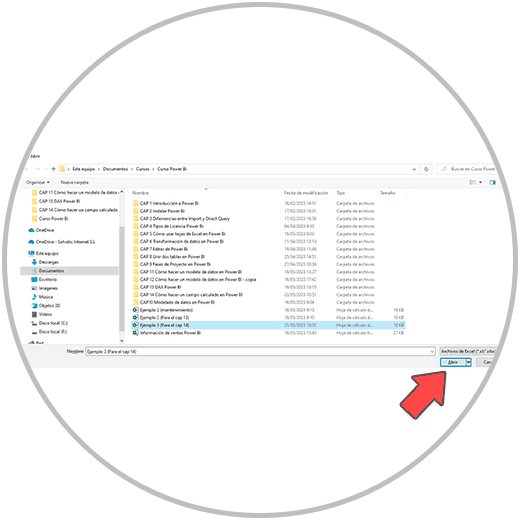
First of all, we are going to open Power BI Desktop to be able to import the data found in our example into an Excel file. Once Power BI Desktop is open, we will go to the taskbar and click on "Open Excel", within the options that we will see in the Start menu.

We now select the Excel file where the data we are using for the example are, and then click on the open button, as in the image, located in the lower right corner of the window.
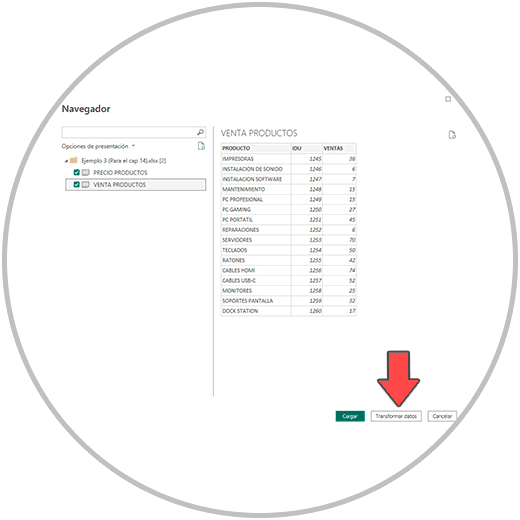
In the next window we will see the Excel sheets on the left. We have to select the two sheets. We first select the "PRODUCT SALE" sheet that will be our matrix table or fact table, and then we select the other sheet "PRODUCT PRICE". After selecting the sheets, we are going to click on the “Transform data” button. (If by mistake you have clicked on "Load" the data directly, something common since the load button is highlighted in green, don't worry, remember that you can always access the option to transform data from the taskbar , at the beginning).
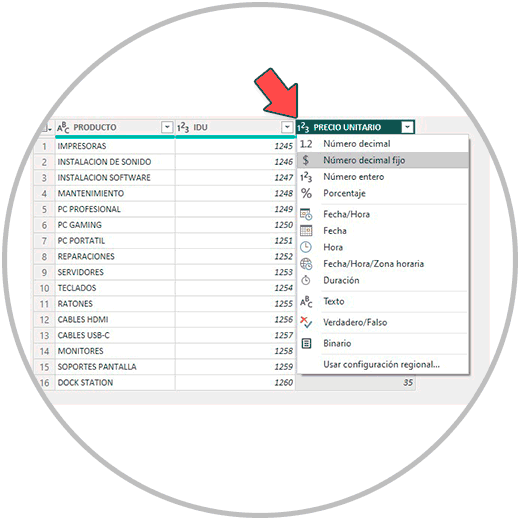
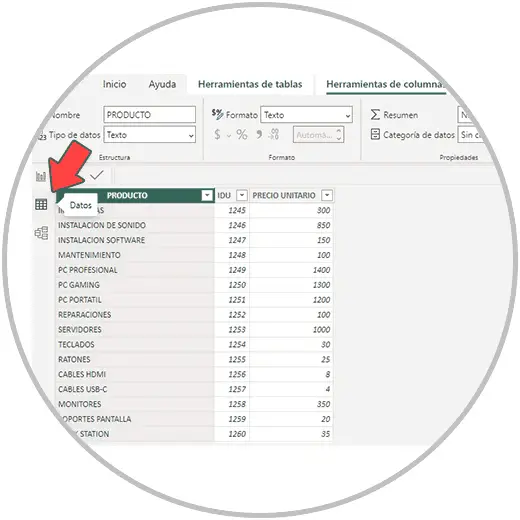
Clicking Transform Data will open the Power Query Editor. You will now see on the left that our Excel sheets have been converted into queries in the Power Query editor. We review the data that has been imported that it is correct, and we are going to see column by column the format that Power BI has taken us by default. We can see this detail in the header of each column. The only change that we are going to make in the example is the change of format in the "UNIT PRICE" column. By default Power BI has selected a whole number format for this column, and we are going to change it to a fixed decimal number, because it is a price format. To make this change remember that it is simple, you just have to click on the icon that shows us in front of the column name. We click on the icon
Once this change is made, we are going to take advantage of this phase of the project to review the data thoroughly. We have to make sure that we don't have empty rows, data errors, repeated or duplicate rows, etc. Check that the data is correct. We are going to pay special attention to the column that we have in common in both Excel sheets, which in our example we have called (IDU, Unique Identifier). Remember that the standardization of nomenclatures is a very important factor that we must review and correct in case of error.
Once we have reviewed the queries, we are going to “close and apply” the changes made so that our queries are imported into Power BI Desktop, so that we can already work on the data and the data model. We then click on “Apply and close” as in the image below.
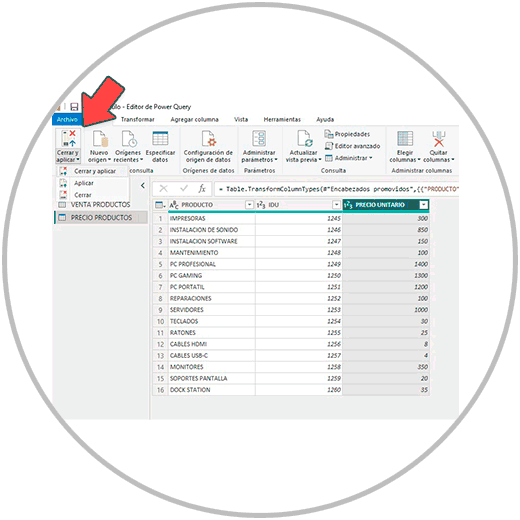
It will take a few seconds to load your data. Now we are going to go to the “Model” view to see our tables and create our data model.
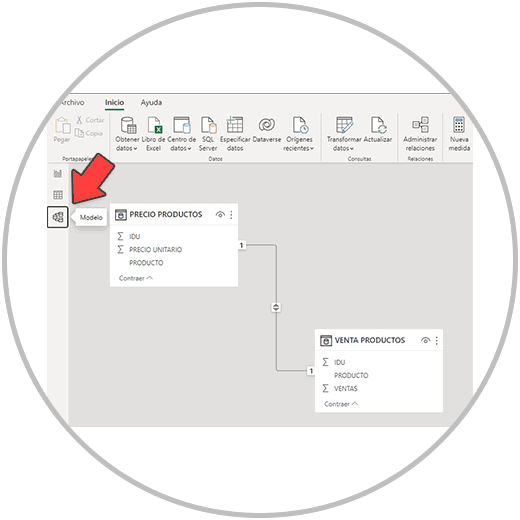
What we are going to see when opening the model view is our data represented in tables. As in the example we have a unique identifier, Power BI has automatically created the relationship between the two tables. This detail happens because in the two data tables, we have a field in common that Power BI has automatically taken as a key column.
In any case, you should review the relationship that has been established automatically and which columns Power BI has chosen to create the relationship between tables. If we move the mouse and simply place it over the line that joins the two tables, we will see how it marks us in a darker color which columns have been chosen to establish the relationship.
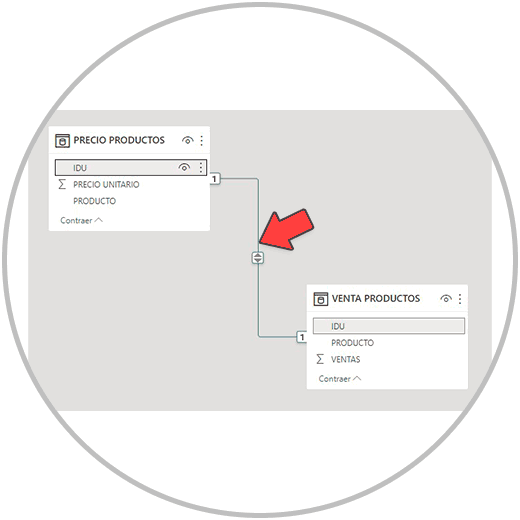
With the mouse over the line, remember that you can delete the relationship by right-clicking on the line and choosing “delete”. To establish the relationship between tables manually, remember that the procedure would be to drag the key column from the dimension table to the fact table. In other words, following the example, you would have to drag the IDU column of the "PRODUCT PRICE" table to the IDU column of the "PRODUCT SALE" table.
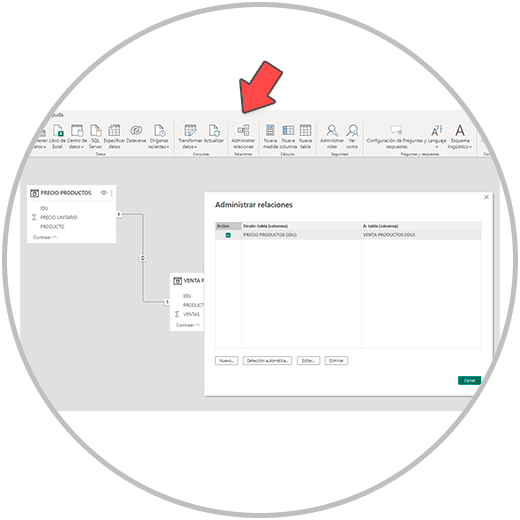
You can also go to the taskbar and click on “Manage relationships”. From here, we will see what relationships between tables have already been created, and we can create other relationships as well if necessary.
We would already have our data model created; We must bear in mind that in this case we are showing a simple example with only two tables so that all the steps are better understood. When we work with Power BI, we must make sure that in this phase, in the data model creation phase, all the data tables of the model must be related.
Next, we are going to go to the data view, as we already know in the left side menu.
Now yes, from the data view, having completed all the previous steps, we will be able to perform the calculated field.
To make the calculated field we must decide in which table we are going to create it. As we already know, the calculated field is going to be created in a new column that we are going to create previously. In the example, we have said that our fact table is the table “VENTA PRODUCTOS”. We are going to create the new column in our fact table, although you could create it in any table in your data model.
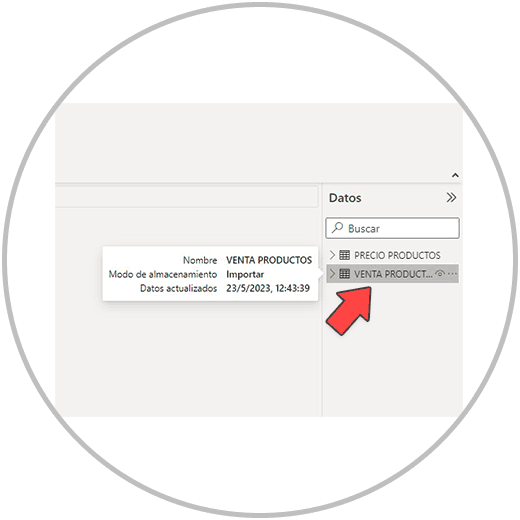
In order to scroll between the different tables, within the “data” view, you can use the menu on the right called “data”. Within this navigation menu to be able to move between the different tables of your model, we are going to click on what is our fact table: the "PRODUCT SALE" table.
Now we are going to create a new column where we are going to first fetch the unit price column from the other table that we are using in the example (PRODUCT PRICE). Subsequently, we will create another column where we will calculate the income per product, multiplying the No. of sales of each product by its price.
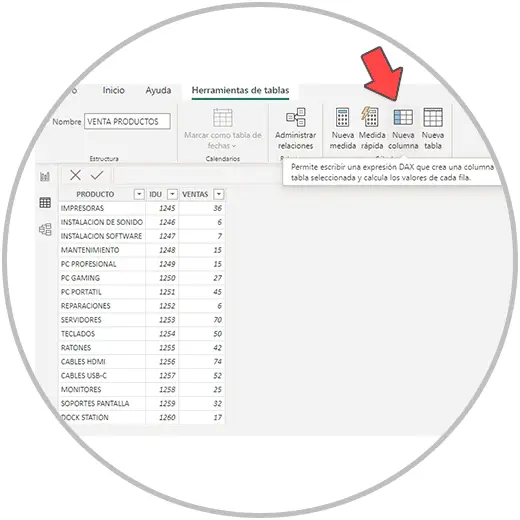
To create a new column in Power BI we go to the taskbar and look for the "New Column" option. And we will see how in the image, that we have marked in blue in the Power BI operations bar the name of the column, which we are going to change.
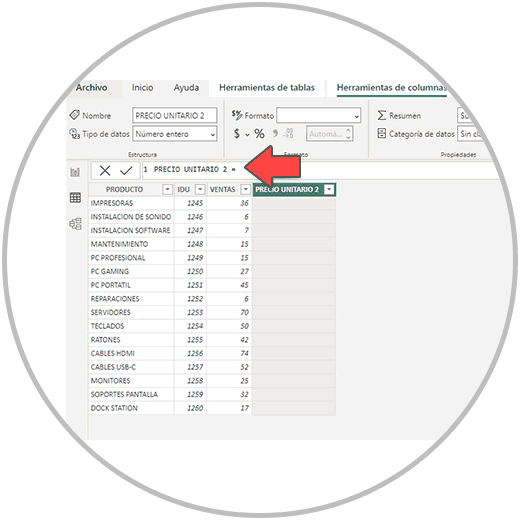
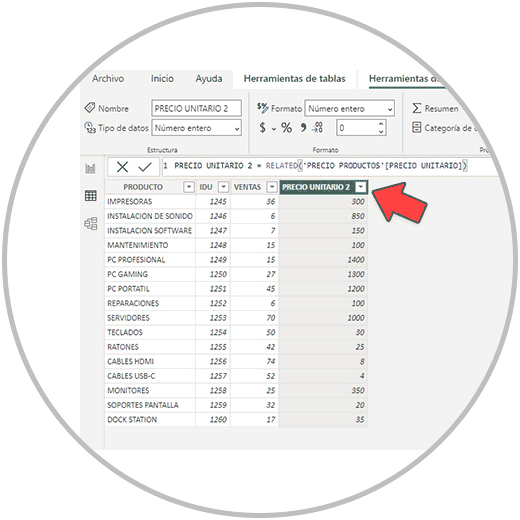
Now to change the name of the column, we must put the name that we want to assign to that column based on the information that it will contain. Since we are going to put in that column the unit price that we are going to bring from the other table, we are going to put the name “UNIT PRICE 2” in that column. To rename it, you can directly type in the operation bar by deleting and typing the new name.
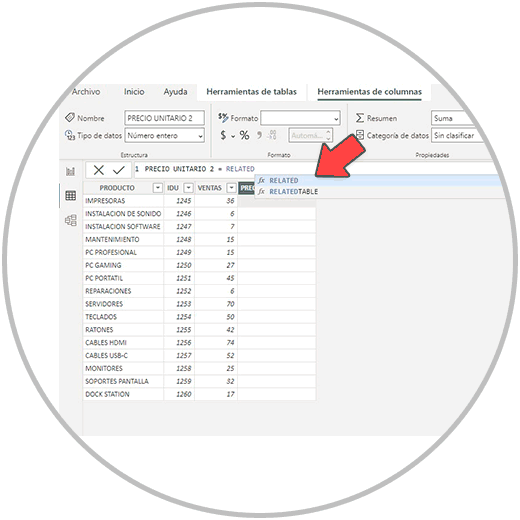
Once the name has been changed, after the equal, in the operations bar, we are going to write RELATED. We choose the suggestion that Power BI gives us when writing related, As in the image below, by clicking on that blue window (that you will see when you are writing the word related).
When you click on the Power BI suggestion to use the related function, you have to choose which field you want to bring up. As in the image below, we are going to see the unit price column that we want to take to the fact table. We therefore select by clicking on the column that we want to take, which in the example is 'PRODUCT PRICE' [UNIT PRICE].
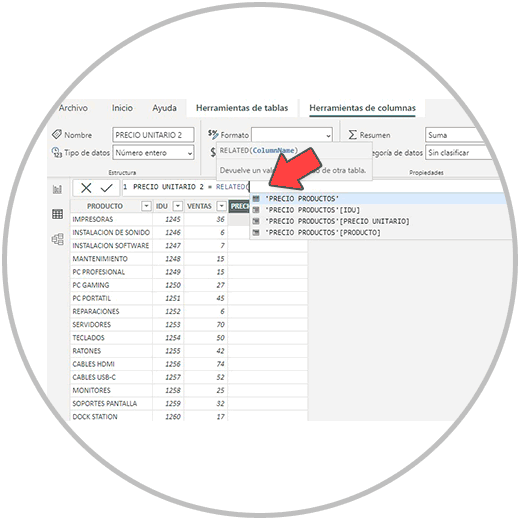
You will see the name of the column that we want represented in this way, as we have seen in the image, with the name of the table first between commas, and with the name of the column between brackets.
Now having clicked on 'PRODUCT PRICE' [UNIT PRICE] we will see it in the operations bar. We press the Enter key on our keyboard, and we would already have, as in the image, the price column added to the "PRODUCT SALES" table.
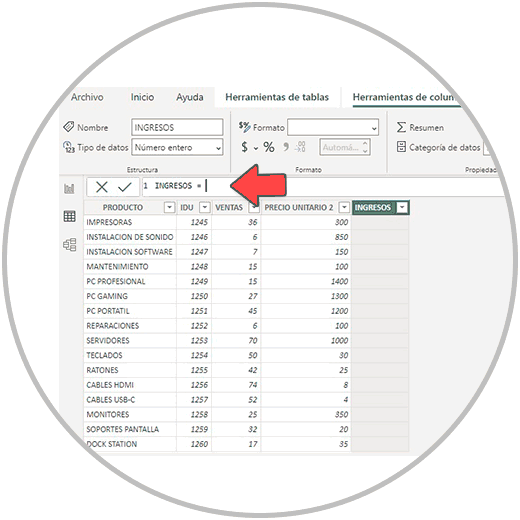
Now, since we already have the two columns we need, sales and price, in the same table, we will be able to calculate the income generated. To carry out this operation, we click again on “New column”, and this time we are going to call it “INCOME”.
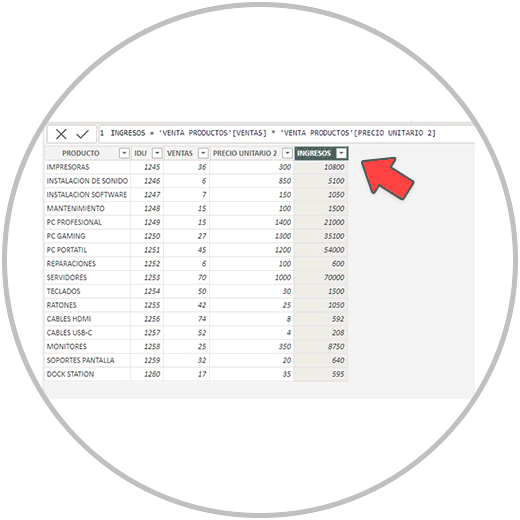
Once the name has been changed, we are writing in the operations bar and using the suggestions that Power BI will give us. In this case, we want to multiply the "SALES" column by the "UNIT PRICE 2" column. We start writing SALES and select the Power BI suggestion, then we add the multiplication sign, which would be a *, and then we would start writing the name of the UNIT PRICE 2 column, being able to use the Power BI suggestion in this case. The result of the formula in the example would look like the image below, and by pressing the enter key on our keyboard, we would already have the calculated field created.
We have explained how to perform a multiplication operation, but you can use the formulas and operations you need, following the steps as we have explained, and taking into account that we must write the names of the columns that we want to include in the formula.
4 How to do an operation in Power BI with columns from different tables
As we have just explained to you, in Power BI the operations are performed in a table and are reflected in a new column. In the example we have explained how we can add a column from another table in Power BI to be able to perform an operation.
However, there is a method in Power BI with which we can do an operation between columns that are in different tables, without having to add the column from the other table.
The way to perform these operations is also using the related function. Let's see it with the same example that we are explaining, in this case creating a new column to make the calculated column.
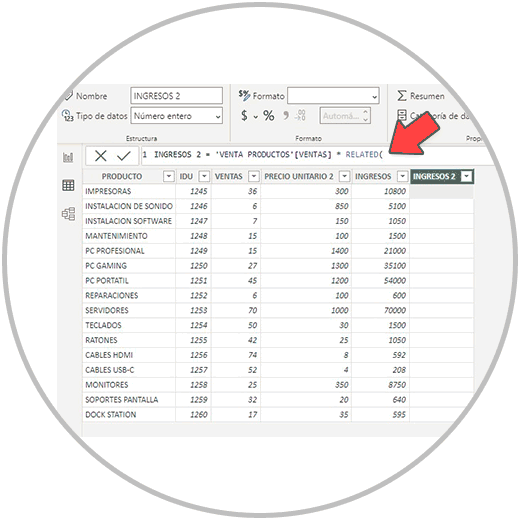
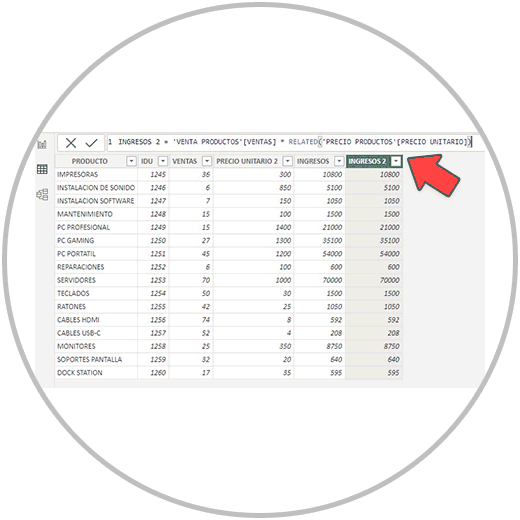
As we already know how to do, we create a new column, we are going to call it INCOME 2, to differentiate it from the other column created.
Now in the operations bar, we are going to start writing "SALES" and select the suggestion that Power BI gives us, in order to add the "SALES" column to the formula. Next we write the multiplication sign with an *, and then we write “RELATED”. Now, as we see in the image below, it already lets us select a column from another table.
In this case we are going to choose the unit price column from the "PRODUCT PRICE" table to verify that the formula works. By pressing enter, we will see that the calculation performed is correct and equal to the calculation we performed previously by adding the column to the table.
In this case, the advantage of using related in the formula allows us to select a column from another table, saving us a step that would be adding the column from another table. The benefit, in addition to being a faster method, is in making a lighter project, which weighs less.
In this sense, we must learn how to make measurements in Power BI, a resource that is also used to perform calculations in Power BI. And unlike the calculated fields, they are not calculated at the column level, resulting in very useful results and that we can use to do an infinite number of operations.
As we have seen, the calculated fields in summary are a Power BI utility to be able to perform operations within our tables, after transforming the data and building the relationship between tables in our model. Calculated fields are made at the table level, and to create them in Power BI we need to add a new column, as we have explained in the example.
Although the calculated fields are performed at the table level, with the "related" function we will be able to perform operations between tables; We can bring the data from the column of another table, or perform an operation directly using "related" in the formula.