How to perform calculations in Power BI? What are calculated fields? What are measures in Power BI? These are some of the questions we often ask ourselves when we start using Power BI. On the one hand, once we learn to make the data model, some needs begin to arise, such as performing an operation or calculation. On the other hand, we began to hear words like measure and DAX, words that were probably not in our dictionary..
As we already know, Power BI is a very powerful and useful tool to be able to work with very large volumes of data, to be able to work with multiple data sources, and to be able to establish a relationship between the tables that allow us to create a model or ecosystem of data where all tables are connected.
If we are used to working with data, we also know that when we integrate the data, we cross databases, in short, when we join in one way another data table that has additional or complementary information, an urgent need to perform calculations arises. and operations. Because? Because by having a broader data ecosystem, we can obtain new calculations, because we can add new columns to our tables by performing new operations, or they simply allow us to compare data to better evaluate results, to see if we have reached our objectives..
The reason is simple, the more data we have, the more ratios, calculations and operations we will be able to perform. We will be able to go deeper and see the data in a more segmented way. It is not in any case about creating ratios or calculations for the sake of it, but about analyzing what calculations are necessary to be able to include them later in our final reports; What ratios and calculations we need to be able to analyze the data with the necessary depth in each case.
Data ecosystem with more information, with connected tables, and the need to perform calculations. Example
For example, in a hypothetical case where we have the information of a company at the sales level, which of the following scenarios that you are going to see below do you think is best to be able to make better accurate decisions, more segmented decisions?
- Scenario 1: In this scenario we only have a table with the sales information for a company by month.
- Scenario 2: In this scenario we have a table with sales information for a company by month, but we also have sales information at the vendor level.
- Scenario 3: A table with sales information, where we can see the sellers and also what products they have sold.
- Scenario 4: In this scenario we have a data model with tables that show the information on the sales made, the sellers, the products, and also information at the store level, and information related to the costs of each one of the stores. .
It is evident that scenario 4 offers us many more analysis options, to be able to analyze more general company data, but also segmenting at lower hierarchical levels. The more information added, the more calculations we can perform, and make much more accurate and segmented decisions in each case, and at all levels (Companies, stores, workers). Following the example, having at our disposal the information at the vendor and product level, we will be able to make much more accurate decisions for our business, such as:
- Being able to reward the best sellers.
- bring more product stock to each store based on which product sells the most in each of the stores.
- We will be able to individually analyze the profitability of each store, and assess the increase in commercials in the stores that are doing better.
- Analyze if it compensates us to have stores that have a negative balance when balancing income and expenses.
They are just examples of what points we could evaluate when we have a more complete data ecosystem. In reality, information is generated very easily today, we live with an excess of information. For a company, the efforts, thinking about the future, must be focused on knowing how to connect the information, channel the relevant information, and follow up on the indicators that are key for a company..
On many occasions the data is not 100% white, but it is not 100% black either. We can have, following the example, a store that is the one that generates the most sales, but that nevertheless has a negative balance due to having too many expenses. In this case, the challenge would be to maintain the level of sales, even increase it by reducing spending. And we can only do this if we have segmented information that helps us see the good and the less good, in this case of a store.
It is about being able to use the data to make holistic decisions (as a whole). In the example, it is about having the necessary information to help us manage resources based on the sales potential of each store, adjusting spending in each case, and optimizing company resources in general, yes, but taking into account to the details.
If we did not have all the information, in this case segmented at the store level, at the seller level, if we did not have the expenses and income based on each store, it would be difficult for us to have this depth of analysis, and therefore we would hardly have this depth in decision making. Which is, after all, what it is about. As we already know, the data itself is worth nothing if we represent it to ourselves, if we don't compare it, if we don't analyze it with an evolution in time, with perspective and evolution; In short, the data is much more useful when we see and analyze it in tables and graphs that help us see the current state, evolution, and projection. And that they help us, especially in subsequent decision-making.
In short, this analysis and decision-making can be carried out successfully as long as we have all the relevant information, at all hierarchical levels of the company.
Continuing with the example, it would be to be able to see the data at the Company, Store and also employee levels. And being able to see several important KPIS such as sales, income, and data at all levels (company, store, employee).
The larger the data ecosystem, and the more complex it is, the more tables and information there are to analyze, relate and connect to the model, the more useful tools such as Power BI will provide to simplify and obtain simple conclusions from situations that may seem very complex at first. (complex we refer to the volume of information).
As we already saw in how to make a data model in Power BI, when making a coherent data model, we have to relate the tables with the information that we want to include in the model. It is necessary to relate the tables if we want to cross information from various sources in the report in the same graph or table. If you have any questions about how to relate the tables, it is important that you resolve it. You can see again “how to make a data model in Power BI”.
Once the tables are connected, once we have all the information available and connected to the model, it is time to ask the most important question once we have reached this point in the process:
Do I have in my model all the information necessary to make the reports, or do I have to make new columns and new custom calculations in my data and tables?
According to the example that we are discussing, we could, for example, carry out some interesting calculations based on the information contained in the different tables, but we insist that as long as we have crossed or related information (for this reason, there is a need to connect the tables in the data model, otherwise we would not be able to do calculations that involve putting data from two different tables in the same formula).
What calculations could we then perform in the example we are discussing?
Calculations we could perform in scenario 4
- Subtract Income minus expenses to find out if the operating result is favorable or not.
- Operating result (Income – expenses) at the store and employee level.
- Calculate the average sales and sales value of all sellers, and analyze who is below and who is above (This way we can establish an award system for meritocracy based on who are the sellers who contribute the most benefit to the company)
- View profitability by product, country, etc.
These are just some of the examples of calculations that can arise when putting together relevant company information that was initially separated into several tables.
And how can we do calculations in our data model, how can we do calculations, operations and ratios with the information in our tables?
Performing all these operations that we are talking about, as well as other operations or calculations using the same Excel logic, are of course functions that you can also use in Power BI. It is in fact one of the most important parts of learning Power BI that can be more complex to start with. However, knowing the methods, procedures, and some key functions, we will be able to solve what at first seems like a puzzle.
We are going to start by first explaining what methods exist in Power BI to be able to perform calculations and operations on our data and in our tables, what characterizes each method, and what each method is good at, but also the limitations they present to know when we can use one and other.
A calculation or an operation on data tables in Power BI can be done through calculated fields, and through Measures. The latter works thanks to DAX, which is the programming language that Power BI uses to perform operations and calculations in a data model.
Difference Between Calculated and Measure Field in Power BI
Let's see next, what is a calculated field, and what are the measures in Power BI. Calculated fields and measures are functions or tools that, as we have said, are already very useful for analysis. Along the lines that we are discussing, there are two tools that allow you to make calculations with the data from your tables, from the information that you have loaded in Power BI.
As we are going to see below, calculated fields and measurements are two tools that can sometimes perform the same operation, but which, however, have a different objective, have a different way of calculating, have a concept of utility and application within from Power BI which, as we will see below, differs in many cases.
Learning to perform calculated fields and measurements in Power BI is a very important step in learning and using Power BI, in order to get the most out of the capabilities of this tool; But, above all, in practice it will help you to deal with the cases and problems that we encounter on a day-to-day basis when we work with a lot of information. Knowing these two methods (Calculated Fields and Measurements) you will be able to perform any operation on your tables and data model.
1 What is a calculated field in Power BI
As we already saw in how to create a data model in Power BI, Calculated fields are operations that are performed on the columns of the data tables. Calculated fields can be created with formulas that we use in the Power BI operations bar, when we are in the module or data view.
The calculated fields, as we will explain, are made in new columns that we are going to create in some of the tables of our data model. Calculated fields are especially useful when, for example, we need to perform a custom and simple calculation using information from a data table in part. (If we want to multiply the values of a column by a number, if we want to multiply the values of a column by the values of another column, if we want to perform operations such as concatenating columns, etc.).
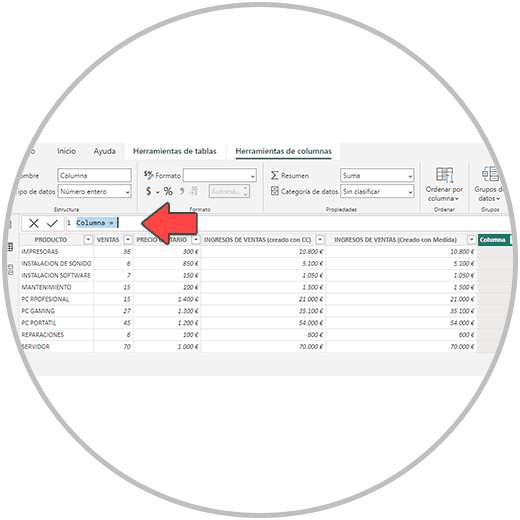
For example, if we have a table with a column with the information on the number of sales that a company has made of each product, and in another column to the right we have the unit value of each product, in order to obtain the income we would multiply the sales of each product for the value of each one.
To carry out this operation, we could use a calculated field where we would multiply the two columns (Price x No. of sales of each product) as in the image below.
One of the main features of calculated fields is that operations are performed at the table level; They are useful and easy to learn to use because they use the same structure as a formula in Excel. (Although as we have seen, they have a particular way of being represented, having to write in the operations bar both the name of the table and the name of the columns that we want to include in the formula).
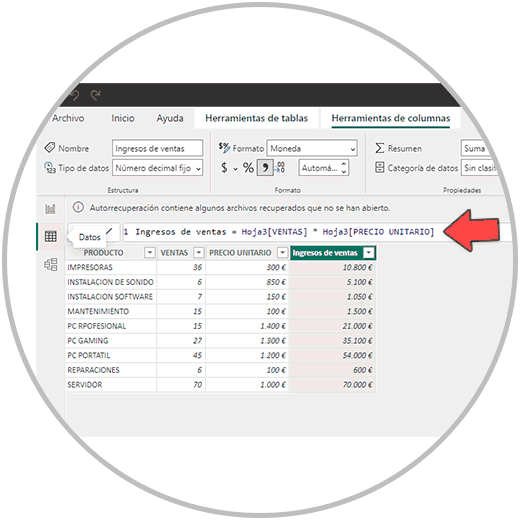
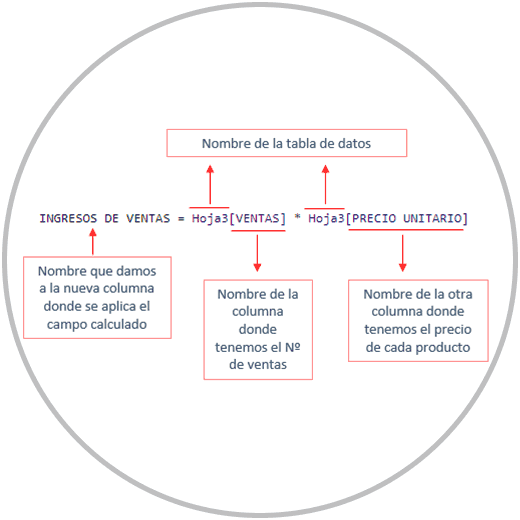
Formula for a calculated field in Power BI
The formula of a calculated field, continuing with the example from before where we are multiplying the number of sales of each product, by the unit price of each one, would take this form that we see in the image below, where several elements are present:
- The name of the new column that we created to make the calculated field before the equals (=).
- After the equal (=) the names of the columns that we want to multiply in this case must be included between brackets [], which are in this example the number of sales and the unit price.
- In front of each column name, as you can see in the image, the name of the table where you are performing the operation is placed.
One of the things that we are going to learn when using Power BI is the usefulness of the suggestions that Power BI offers when we type in the operations bar. When we start writing in the operations bar, we will see how the suggestions for functions and fields are displayed so that we can choose and include them within the formula by clicking, without having to write the entire formula.
If we realize in the structure of the formula that we have seen, we will see reflected some of the characteristics that we have been commenting on are inherent to Power BI; Disappears in concept of cell present in Excel. When doing calculations in Power BI, when we talk about calculated fields, they are done at the column level as a whole. (not cell by cell).
Although the calculation is later reflected in each row, the predominant concept in Power BI in this case is to perform operations that apply to entire columns. This factor has advantages such as the possibility of making a typical Excel error such as not dragging a formula to the end disappears.
Calculated fields have some advantages, as we have said, since they are fast and we can use the same Excel logic to perform operations, that is, as we have seen, taking into account the peculiarities of having to write the names of the columns and tables where the operation is performed, and the use of symbols, as in this case we use the square brackets [] before and after the column name.
Calculated fields also have some limitations, since these calculations are performed at the table level and are not directly useful for use in another table. In practice, this translates into two limitations that we are going to find:
- If we want to perform the same operation on different tables of the model, we would have to perform this operation on each table.
- Calculated fields, when performed at the table level, have the limitation of not being able to perform operations between columns that are in different tables. However, as we will see now, there are some formulas and resources to overcome these drawbacks.
The calculated fields also generate a greater consumption of resources because Power BI, once we make the formula, has to perform the calculation row by row. It is not a very big problem, it is an operation that is carried out in a matter of seconds, but it does increase the weight of our project.
The limitations presented by the calculated fields are, as we will see below, solved with the measures, a Power BI tool that better complies with the philosophy of offering solutions to the data model in its entirety, not just to a specific data table, They are also designed to be able to apply and use them directly in the tables and graphs that we are going to build in the final phase of our project.
2 What is a Measure in Power BI
Measures are calculations or operations performed on one or more columns of a table and are primarily used to summarize or aggregate numeric data. Unlike calculated fields, measures are a solution to a data model, and therefore have a broader range of utility. Therefore, its use is not limited to that of a table, but it is a solution that we will be able to use in our reports, in the complete data model.
Measurements are commonly used to make calculations or summarize data, and are done in real time; This means that when we filter or change the view of the data, the measures are automatically updated to reflect the changes.
In practice, the use of measurements gives us enormous advantages when it comes to carrying out calculations and operations. Because?
- Because we can make a measurement that we can apply to the model. We don't need to create a new column in a table. For example, we can create an operation to calculate a value, and not have to perform this operation in the data table, within a column.
- In addition, we can use the measures, for example to be able to perform operations between columns or values that are in different tables without having to create a new column in one of the tables.
- The Measures do not contribute to a greater consumption of resources, nor do they increase the weight of our data model.
One of the visible differences that we are going to see in Power BI, when we compare the calculated fields with the measures, is that the calculated fields are operations that are added to a table, and that these are reflected in a new column that we have to create to be able to perform the operation. However, the measurements are operations that we carry out and that are at the service of the model. We don't need to create that calculation inside a column. In addition, as we are going to see in the example below, we can also use the measures to be able to apply them to a column if we want to. Although, as we have explained, it is not necessary, and we can use this resource at any time to verify that a calculated field and a measure give us the same value.
In order to better appreciate the differences between calculated fields and measures in Power BI, let's see with the same example as before, how using a measure in Power BI, we can perform the same operation, which was a multiplication, without the need for create a new column in one of our tables.
If you remember, in the example, we wanted to obtain the income of a company, from a table that contains information on the number of sales made for each product, and the unit price of each product.
Structure of a measure formula in Power BI
As you will see in the image below, the structure of the formula, in the case of measurements, is different; It follows a different pattern, in this case to perform the same multiplication operation.
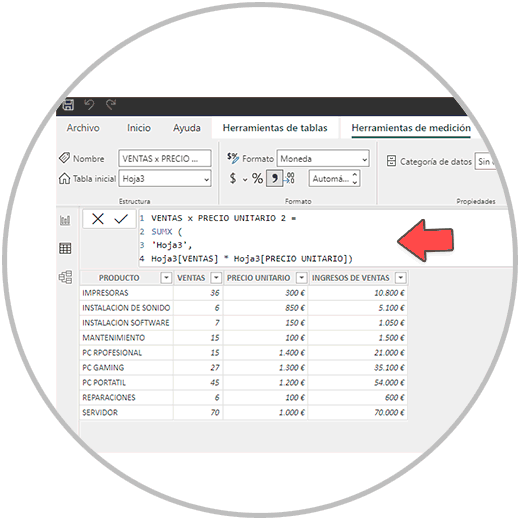
As you will see in the image, we have used the SUMX function of Power BI to be able to create a measure that in this case would be the correct one to be able to calculate the income correctly.
When having several products, with several different prices, we use the SUMX function, which is the correct function because it takes into account in this case that the operation must be calculated taking into account the information in the rows (It must be taken into account because the unit price for each product is different, and to have the correct income data for each product, we must multiply the number of sales of each product by its unit price, which is different in each case).
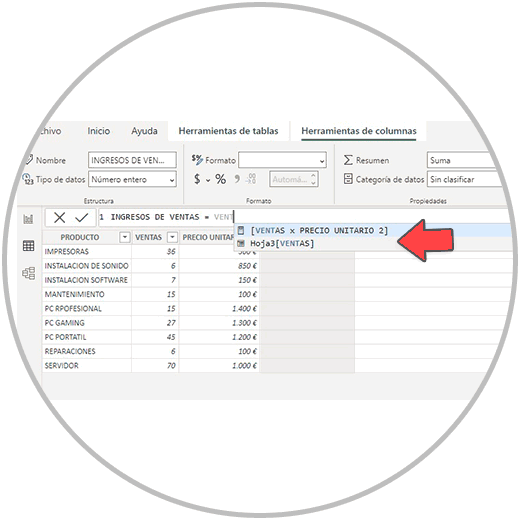
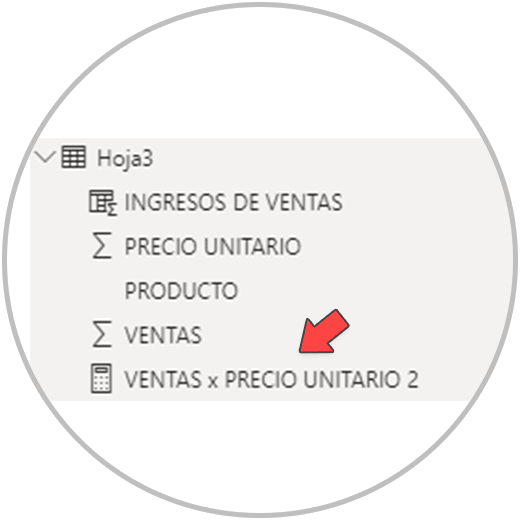
Once we have made our measure (which we have called SALES X UNIT PRICE 2), we will see on the right in the data column in Power BI Desktop, both the calculated field that we made before, and the measure that we just made.
To see that the result using a measure is correct, we can use the measure operation as we have said before to add a new column to the table where we are working and we will see that the result of the operation is exactly the same in each row.
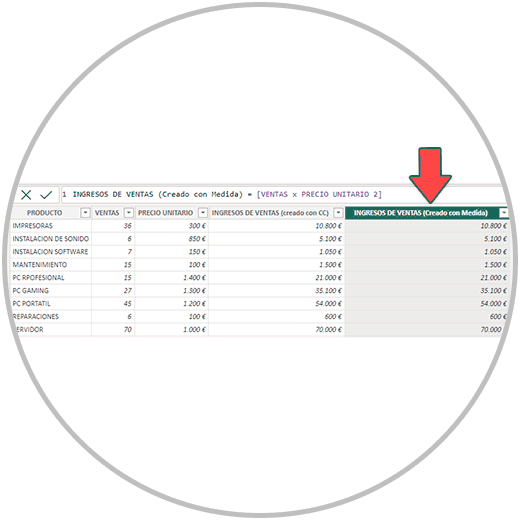
This is something that you can do especially when you initially start using Power BI, to verify that the result that you have obtained through a measure is valid, the one that you expect to obtain. Some measures do not give us the expected result on some occasions because we are not using the correct formula due to ignorance. As you have seen in the example, we have used the SUMX function when calculating the measure. If we use the SUM measure in this case, we will see that the result we obtain is wrong because it is calculated on the totals.
SUMX, a very important Power BI feature
The SUMX function in Power BI is very important when doing calculations using measures in Power BI, because it allows you to perform operations taking into account the values of each row. It is very useful when, for example, we perform operations that affect two columns.
As we have just seen in the example, thanks to SUMX each value in the No. column is multiplied. of sales of the products sold by the company, for its corresponding unit price.
SUMX is a very versatile function that you will use in many situations in order to obtain aggregate results based on specific criteria, as we have just explained.
These kinds of nuances, we're going to learn how to use them in how to calculate a calculated field in Power BI and how to make a Measure in Power BI. We explain step by step how to use each Power BI resource to be able to make calculations, and you will also learn to use formulas and utilities such as "RELATED", a resource that, like SUMX, you will constantly use in your projects.
RELATED function in Power BI?
The RELATED function in Power BI, as we are going to explain, is very important because it is presented as an ideal solution for some of the limitations that we have already mentioned are present in calculated fields and also, in part, in measures.
The RELATED function is very useful mainly in two aspects:
- It works like a look up vlook up in Power BI. When we are working on a data table, the RELATED function allows us to retrieve values from another table. It is useful when, for example, we want to bring another column from another table to a table in order to perform an operation between them. As we told you, calculated fields are calculated at the table level. This function would allow us to add columns from other tables and therefore add new columns and calculations having more information in the same table.
- We can directly use the RELATED function in a formula to be able to do a calculation between columns that are in different tables, for example when we are using a measure.
The most important thing now is to remember that SUMX and RELATED will be two very very useful resources that you are going to use when using Power BI. And that we are going to explain how they work, how to use them in practice.
As we have seen, calculated fields are created in columns within a table using custom formulas that follow a structure similar to what we would use in Excel, but with nuances, while measures are calculations that are performed at the model level, outside of the tables.
Both functions provide solutions when having to perform calculations. You'll find it easier to start using calculated fields at first if you're used to using Excel as a spreadsheet and reporting tool. However, we must be aware that the measures are very useful because they do not add extra weight to our model, and they can solve many of the operations that we are going to need to perform on our data model. In order to perform operations that are often performed with calculated fields, we are going to be able to solve it with a measure using SUMX as we have seen. Likewise, we must internalize the great utility of the RELATED function, to be able to perform operations between columns that are in different tables.