Measures in Power BI are a valuable tool for performing calculations using Power BI's own language called DAX. Calculated columns are another Power BI resource for performing operations and calculations. Unlike a calculated column, measures are a resource intended to be applied in Power BI reports, in the last phase of a project. IF we remember, to perform the calculated fields, the creation of new columns is required where the results of the operation performed are determined..
However, measures do not need a representation in the data table, they were designed so that we can do calculations without having to add columns to the tables, so that our Power BI projects have a lower final weight. Why add more columns to our tables and burden our projects, when what we need is for these calculations to be represented in the final report?
One of the great advantages of using calculated fields in Power BI, if you remember, was the “Related” function, which takes full advantage of the advantages that a calculated column offers. Well, the use of the Related function is not exclusive to a calculated column, because the "Related" function works perfectly when we use measures in Power BI. What are the implications of using the Related function in Power BI? The utility of “Related” in measures is the same or even greater. The calculations that we make in our data models using the measures will be able to make use of the information contained in different tables of the model, and also, as we have seen, without having to add new columns.
For this reason, we always talk about measures as a solution to perform calculations in Power BI that is at the service of the data model, an evolution of calculated fields, a resource already present in pivot tables..
In practice, we are going to see very quickly what advantages the measures have in Power BI, when we work in a data model, and when we have to carry out calculations, or we must carry out a formula or apply a function. In practice, as we have started by saying in this paragraph, we are going to realize that most of the operations to be carried out can be done directly by creating measurements. Especially all mathematical and numerical calculations are approachable, feasible using a measure in Power BI.
Purpose of Measures in Power BI
The objective of measures in Power BI is to be able to carry out calculation operations that provide your data model with more relevant information, and metrics that help you in analysis and reporting. With the measures in Power BI you will be able to perform mathematical and statistical operations using all the tables of your model. (Thanks, as we have told you, to the Related function).
As we will see later, there are two ways to create measures in Power BI, using the DAX language to be able to do the calculation using the operation bar; But there is also a tool for creating quick measures, which includes the most common and useful measures; This way of taking measurements is fast and simple, providing, as we will see below, a help window in which we have to choose the information that we are going to include in the operation from the drop-down menus. and where of course we can choose what operation we want to perform. In this case, the limitation of rapid measures resides in being able to use only the operations contemplated in this section (in the rapid measures section)..
Each data model, data ecosystem hides its own nature and hides its own particularities, complexities. In this sense, we must always keep an open mind to see in each case how the measures can help us in the tasks of reporting and data analysis.
Recommendation
A good practice in Power BI, which you can adopt as a doctrine and always apply in your projects, is to always carry out a measure in Power BI instead of a calculated field. In the end, as we have already mentioned, we will be creating a simpler and more professional ecosystem where we are not fattening our data tables, and therefore our projects. We will be saving steps to carry out calculations that we are going to perform, saving space, and we will be more professional in the use of Power BI tools. Like for example in Excel, a pivot table or a macro, it is a more advanced and professional way of working with data.
Therefore, one of the questions that we should always ask ourselves when we perform a calculated column is whether that calculation can be done through a measure. This is the question we always have to ask ourselves in order to establish a lighter, more professional, and also more agile and dynamic data model.
1 DAX functions in Power BI
DAX functions in Power BI are the formulas we use in the operation bar to perform calculations and add data to our Power BI data model. DAX, as we already know, is the formula language used by Power BI.
The DAX functions will allow you to perform many tasks in Power BI, such as we are explaining to you, create custom measures, calculate totals and subtotals, and perform countless calculations. These functions, as we have told you, are especially useful in tasks of advanced analysis and creation of professional reports. They will help us create as we will see interactive and dynamic reports.
Most used functions in Power BI
Among the most used functions in Power BI, some stand out, many of them present in quick measures:
- SUMX: It is a Power BI measure that is used to perform operations taking into account the row context in order to calculate the values correctly. As we will see in the example, it is one of the most important functions, it is one of the functions that you will use most often in your projects.
- RELATED: The Related function, as we have already explained, is one of the most practical and used functions. Its main virtue is to return values that are in another table, and to be able to directly perform calculations between columns that are in different tables.
- IF: It is a measure that allows you to perform conditional calculations, like in Excel to be able to return different values depending on the conditions that we establish.
- SWITCH: Measure with which you can perform different calculations based on multiple conditions.
Within Power BI there are functions that are very useful to provide your final reports with totalizing calculations; That is, functions that allow you to calculate the totals, something that with the calculated columns, for example, we cannot do.
- SUM: Measure to calculate the total sum of a column
- AVERAGE: Measure to calculate the average value of a column
- COUNT: Measure to be able to count the number of rows that a column has.
- CALCULATE: It is a very useful measure with which you can obtain total summaries of the table by filtering information with various conditions. If, for example, you have product information in a data table, categorized into product types, you could use Calculate to obtain a total revenue for a specific product type.
Using measures in Power BI, we can also use some functions that are very useful for our visualizations, reports or Dashboard. They are functions that can extract value information from a column, such as the minimum or maximum value. Let us think, for example, of these functions when we want to show in our reports which store has generated the highest profit margin for the company, who is the person in the entire company that sells the most products, etc.
- MIN: MIN is a measure that returns the minimum value of a column
- MAX : It is the Measure that returns the maximum value of a column
These are just some of the measures that you can activate from Power BI Quick Measures, which, as we are going to explain, and you can see in the image below, is a tool that is available in the start menu.
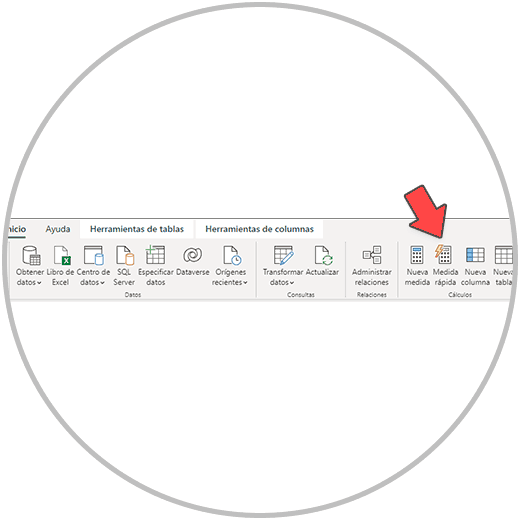
2 How to use quick measures in Power BI
Quick measures in Power BI are a way to perform calculations very quickly and easily. The strong point of making a quick measurement is that we don't have to use the operations bar, as is the case with creating a standard measurement. Against, as we have said before that the operations that are within the quick measures are limited, not all the available functions are found.
In order to make a quick measurement in Power BI, we open the tool from the taskbar, in the start menu, as we see in the image.
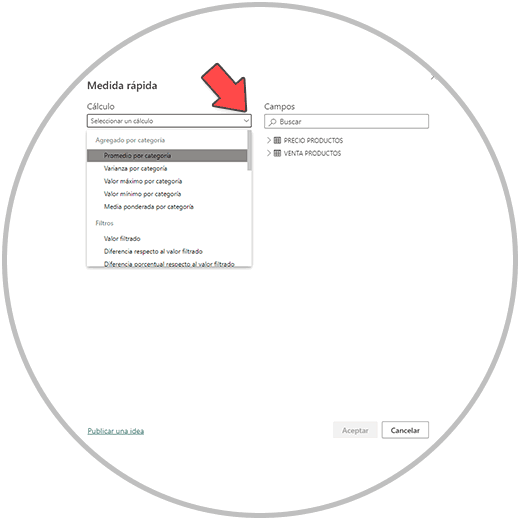
Next, by clicking on "Quick measurement", a window will open from which we will carry out the measurement.
Here we will have to choose, on the one hand, the first operation we want to perform, and for that we would click on the arrow on the right, in calculation, where it asks us to “select a calculation”.
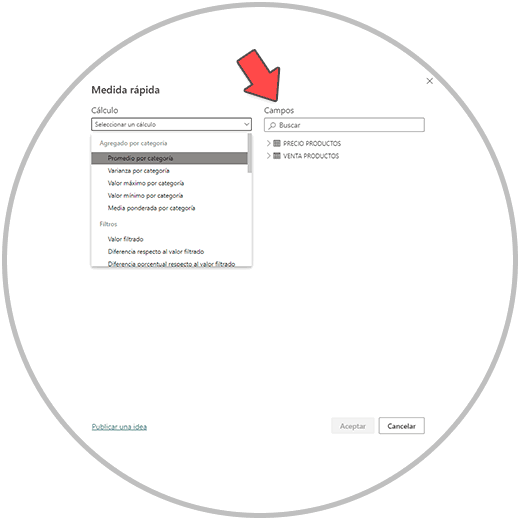
On the right of this window, in the other column on the right, we will find all the available fields of our tables, all the columns that our tables have, including the calculated fields if we have made any, and the measures created so that they too we can use them in operations. In order to calculate a quick measure then, after having selected the operation to perform, we will choose the fields; From the right column, we would select the fields with the mouse dragging them to the windows that say “Add data fields here”
How to use SUMX in Power BI, one of the most useful Power BI features
One of the most useful functions in Power BI is SUMX, which together with the Related function, is perfectly combined to perform the calculations and operations that you are going to perform.
The SUMX function is not within the measures offered in Quick Measures. In quick measures we will find functions of multiplication, division, addition, among others. The problem with using quick measures, in the case of wanting to do this type of operation, is that we are going to find erroneous data in the totals when we make tables in the final reports, for example. But it has an easy solution, and as we have already advanced and explained to you before, we are going to have to use the normal measures, not the fast ones, and make ourselves aware that we have to do the calculation operations with SUMX.
Important
SUMX, in case you want to perform an operation such as multiplication, addition, division, etc. is the correct function that we have to use . The reason is that SUMX takes the row context into account to calculate the total values.
Let's see the difference between SUM and SUMX with an example. We are going to see in the image how SUM works (which would be the multiplication function used in quick measurements) and how SUMX does it.
We are going to calculate the total income of a company that sells several products, with different prices. We have information on the number of sales made for each product, and the unit price of each product. Let's see in the image how each function works in practice, when calculating the totals.
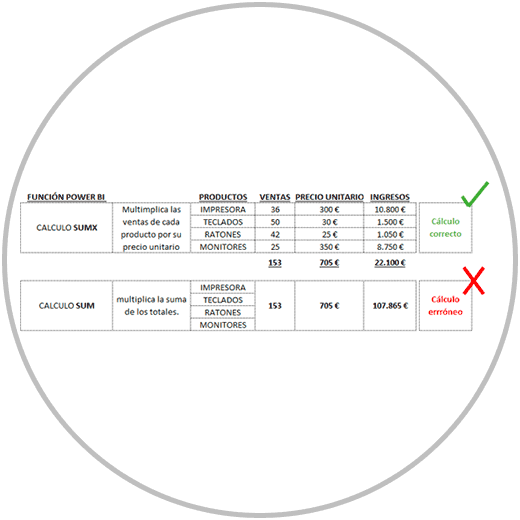
- SUM: The SUM function incorrectly calculates the totals, because it performs the sum of all sales, the sum of all prices and multiplies them. We get an erroneous value.
- SUMX : Performs the correct calculation multiplied in each row by the No. of sales of each product by its unit price , to later make a sum of all the income generated individually at the product level.
In the image below, we have loaded this data into Power BI Desktop, we have made two measures, one with SUM and one with SUMX, and we have represented them in two columns in a table. Thus, we can see in parallel, what is the total result using SUMX and SUM. As we can see in the image, in practice, SUM could not be used to totalize.
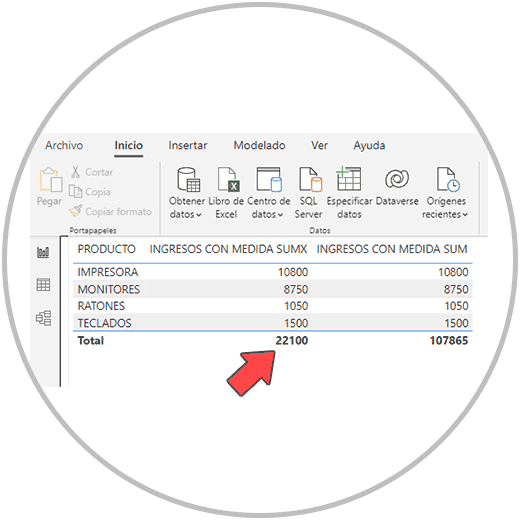
It is very important that you always remember to use SUMX to perform operations with measures . Especially when we have to perform this kind of operations where the row context is important . In this case, in the example, it is important because each product has a different price.
3 How to make a measure in Power BI
Once we have already explained what a measure is in Power BI, and we have talked about the role that measures play when working in Power BI, we are going to see how to create a measure in Power BI using the toolbar. Power BI operations. We must remember that, as we have seen in the example, quick measurements are fine to perform certain operations, but on many occasions to calculate the correct value of an operation we must do it more manually and not with quick measurements.
The skill and use of measurements is a part that you are going to learn to apply little by little with some tricks and recommendations that we are going to give you. The important thing now is that you remember to use SUMX to perform calculation operations, that you remember that the Related function is the "passport" to be able to do calculation operations between different tables of your data model, and that the measures, whenever we can, are a more optimal way to work against calculated fields or columns.
To see how to use measures in Power BI, we are going to explain it to you in a simple way with the same example that we were seeing, of a company that sells various IT products.
Steps to create a Measure in Power BI
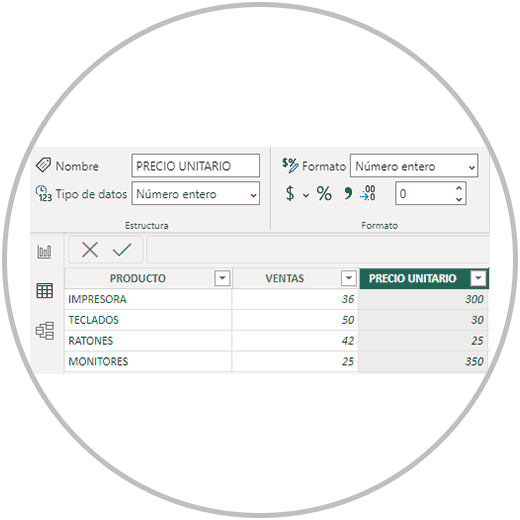
The first thing we would have to do is, as we already know, import the data into Power BI and transform it. In this example, we don't need to have a common field or key column, because we only have one table with the information. In case of importing more tables to Power BI, we already know that we would have to create the data model relating the tables to each other in order to make use of all the information both when making calculations and when “painting” the data.
This would be what our data table would look like.
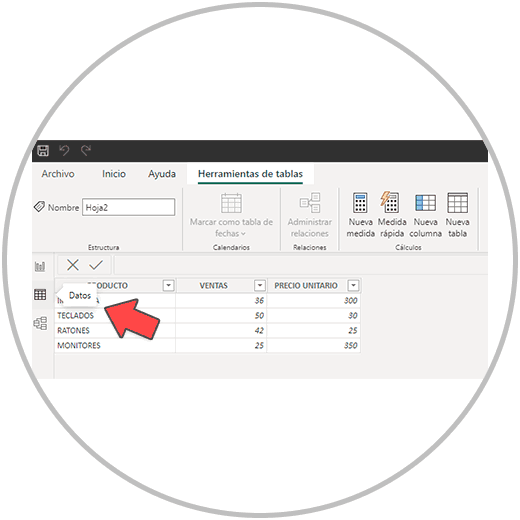
Once we have the data imported into Power BI, which in our example is a very simple table, we are going to go to the Power BI Desktop module or data view as in the image below.
Now in the taskbar, we go to “Start”, and we look for the “New measure” tool.
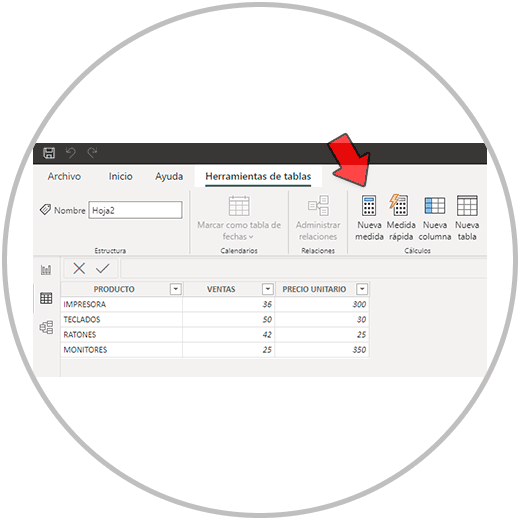
By clicking on "New measurement", we can already use the operations bar to be able to make the personalized calculation.
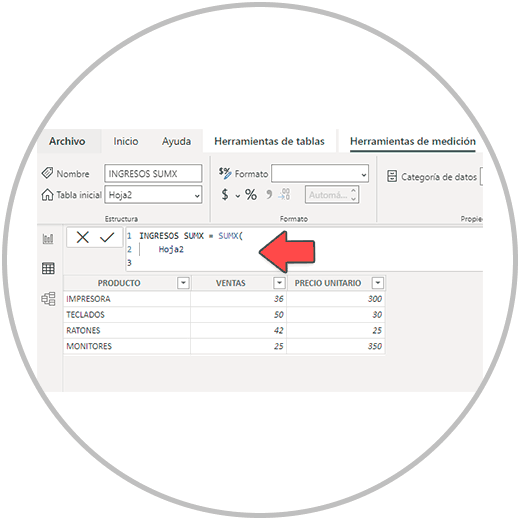
Now to start making the measure formula, we begin by changing the name of the measure, which by default will be called like this: measure. As you will see in the image, we have changed the name to SUMX INCOME.
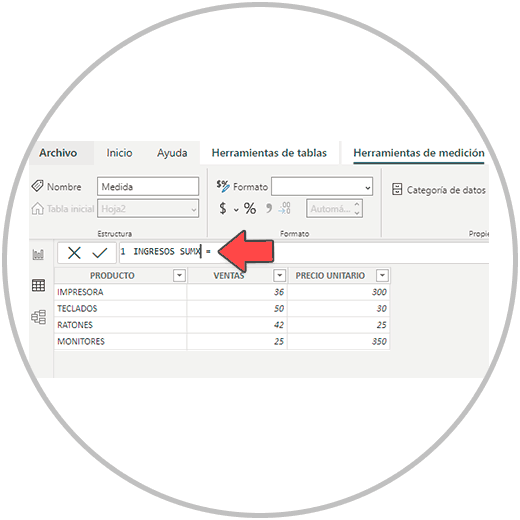
After changing the name, after the equals, we start by first choosing which operation or function we want to perform. Since in this case we are going to do a multiplication, we are going to use the SUMX function as we already know.
We start writing SUMX and we will click when we see the blue suggestion window, as we see in the image below.
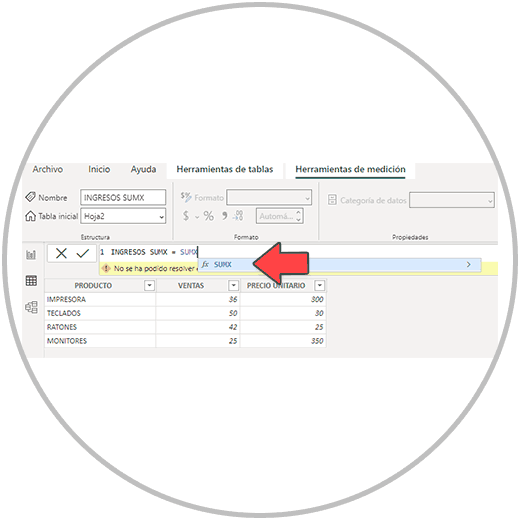
In this step we do not have to choose any function that Power BI proposes to us. What we will do is go down to the next line in the operations bar. In order to go down the line in the operations bar, we have to press the keys on our keyboard: Shift and Enter
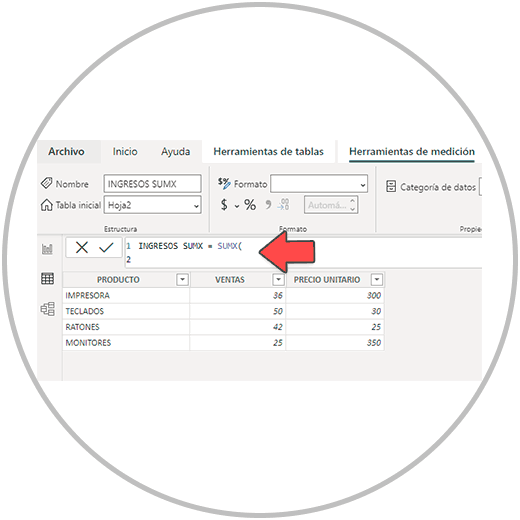
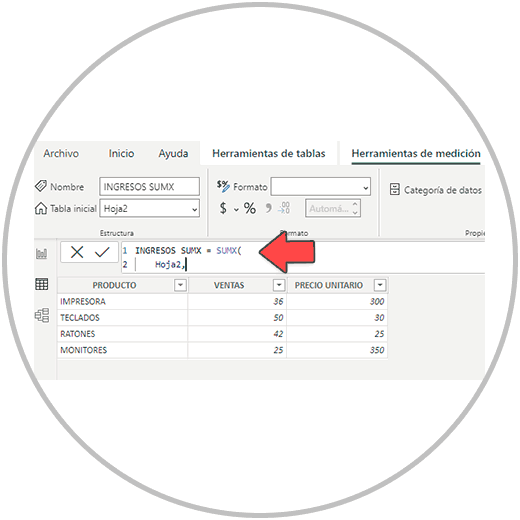
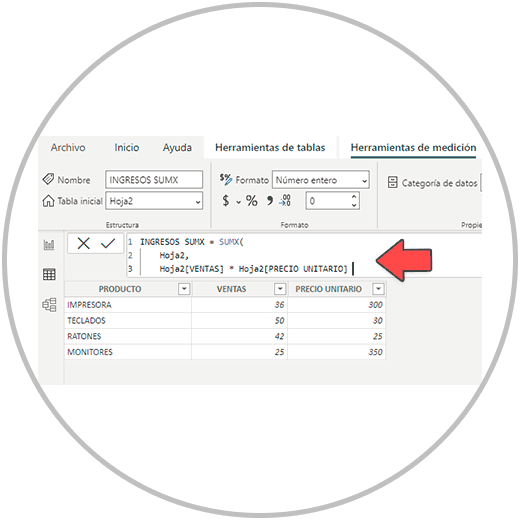
On line two we now write the name of the table where the operation is performed. In the example, the table is called Sheet2, and as we will see when we start writing, it offers us the suggestion with the blue window where we will see the name of our table and where we have to click

Once you have clicked on the suggestion, it is very important that you put a comma (,) after the name of the table and no space (Look at the photo below).
Then I would jump let's go to the third line. Again we do on the keyboard Shift + Ctrl.
Now in this line we are going to choose the columns and the operation to perform. We have to start writing the name of the column "SALES", select the suggestion, add the operation to perform, which in this case is a multiplication we would use the asterisk (*), and then start writing the other name of the column that we want to multiply Look in the image below how it would look.
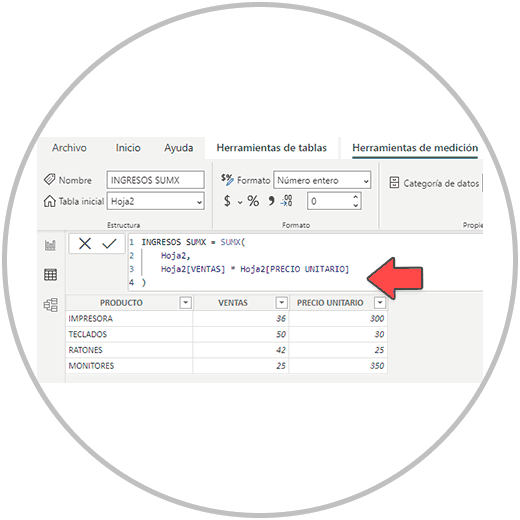
Now we make a line break again, and in the last line we only have to write closing parentheses to be able to close the formula and press enter. And with this last step we would already have our measurement made.
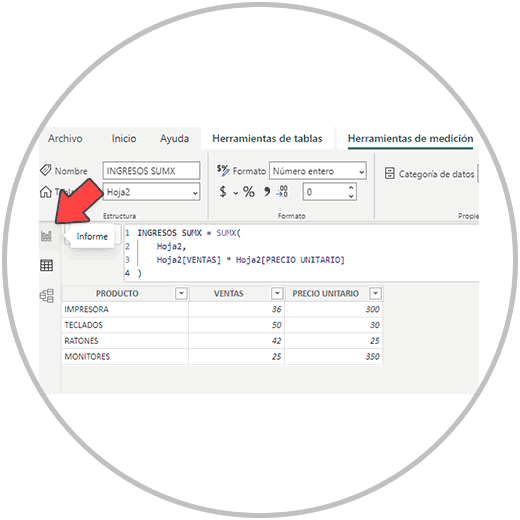
If you have not received an error message, it means that a measurement has been created correctly. What we are going to do now to verify that this measure works, would be to go to the "Report" view for the first time and we are going to create a simple table where we will see the products and income that we have calculated with a measure, reflected in a table .
We therefore go to the "Reports" view, which you will find in the vertical menu on the left in Power BI Desktop.
Once we are in the reports view, we are going to go to the right of our screen, where we will see all the columns of our table in the fields column, and we will also see the measures created.
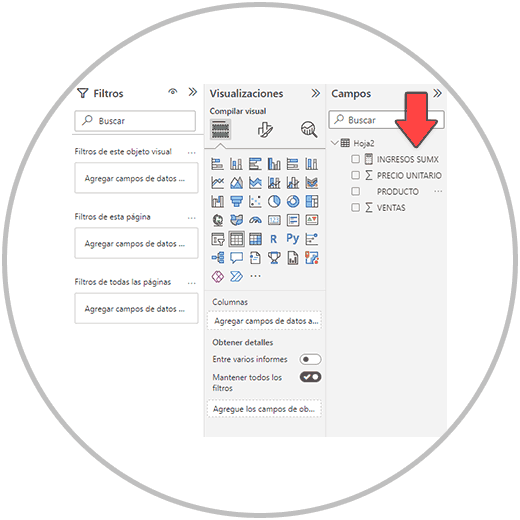
Now creating a table is as simple as selecting the columns that we want to show in our table from the Fields menu. In this case we are going to select the products, and the income (In this order) that we have just calculated with the measure.
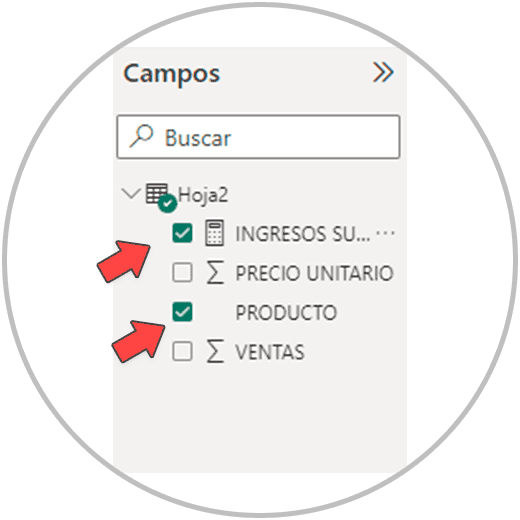
By selecting the fields, we will see how a table with the products and income has been built. This is where we begin to see the usefulness of the measures in Power BI, since, by making a single formula, we have managed to have a new field available in our data table, without the need to create a new column and create the field. calculated.
In addition, as we have been able to see in the image, we have a table where the operation at the row level has been carried out correctly, and since it automatically returns the total of the column that we have created, without the need to manually add it.
4 DAX Power BI Formula
As we have been able to see in the example, the structure of the formula in the measures is used with the DAX language, with a different structure than the ones we use when creating a calculated column. As we can see in the image, these are the parts of a measure formula, as we did in the example, using the SUMX function:
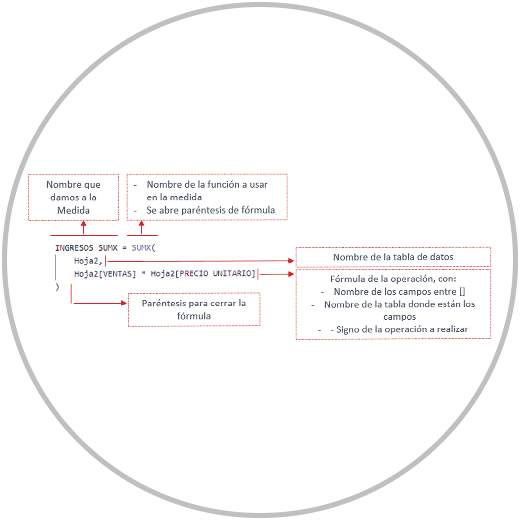
- Measure name: When clicking "New Measure", we always recommend changing the name that we already know will be "Measure" by default. It is recommended to change the name and set a name that tells us what calculation has been performed.
- After equals, we start first by writing the name of the formula to use, with an opening parenthesis.
- We are going to use as we saw SHIFT + ENTER to go down the line. It is advisable to go doing the formula in several lines as in the image so that we can see the structure well, especially at the beginning, and in case of making a mistake, we will identify the error faster.
- On the next line, we start by typing the name of the table where the measure is to be created, followed by a comma. We can use the suggestions that Power BI will give us while we write.
- On line 3, we are going to create the formula in a simple way, writing the names of the fields (columns) that we want to include in the formula and writing the sign of the operation to perform. Here the Power BI recommendations are also very useful to be able to select the fields that we want to include in the formula. We must bear in mind that, as we will see in the image, the field must be enclosed in square brackets [] preceded by the name of the table where the field is located. Note that Power BI suggestions are very helpful. In this case, when writing the name of the field, we will see how when clicking on the suggestion, it correctly places both the name of the table first, and the name of the calculation between square brackets.
- In the last row, we are going to use the space only to close the formula with the parentheses. If we remember in the first row we opened the parenthesis that we are now going to close.
We have explained to you in a simple way and with an example how to make a measurement in Power BI. In the example we have used the SUMX function to be able to carry out an operation taking into account the line context that in this case was necessary to be able to carry out the calculation correctly (having several products, with several different prices). The SUMX function is going to be very useful and we can also use it to perform the simple operations that we often do: addition, subtraction, multiplication, division, etc.
Quick measurements can help us to perform some simple and complex operations easily. But remember that for the good use of Power BI we have to learn yes or yes to carry out a measurement by making the formula ourselves. With this example we have been able to see the structure of the formula and it will help us to start making measurements in Power BI. A resource that is undoubtedly as useful as it is necessary to begin to acquire professional skills in data processing and in the preparation of professional reports.