Power BI, as we already know, is a tool that complements Excel very well. Although there is a common denominator between Excel and Power BI, and we can carry out the same tasks, in some specific cases, the truth is that the potential and focus of each tool is different; Different, but complementary. Although we can use Excel to be able to make sheets with calculations and build tables, make representations, dynamic tables, etc. We can use Power BI with a more oriented approach to building a data ecosystem that is connected, with a view to making visualizations and graphical representations such as Dashboards..
That is, with a view to creating a data processing system, data connection, and everything that is necessary for data analysis and decision making. This pack includes the possibilities of Power BI to be able to create complex calculations in a simple way, as we explained in how to make formulas in Power BI, and of course, the possibility of being able to represent all the control points, KPIS, metrics to follow, or whatever you want to call it, to be able to do a professional reporting, keep track of the data in an orderly manner and with the periodicity that each situation requires.
Although Power BI has this focus of being able to help connect data, analysis, and reporting, it also offers some tasks that we can use sporadically so as not to leave the Power BI environment. One of these tasks, which we can do is the creation of a data table..
Important
Something that is not usually clearly explained are the different types of tables that we can create in Power BI. When talking about data tables in Power BI, we must differentiate the types of tables that exist, which we are going to explain below, and that a lot has to do with the moment of the project or phase in which we find ourselves, within Power BI :
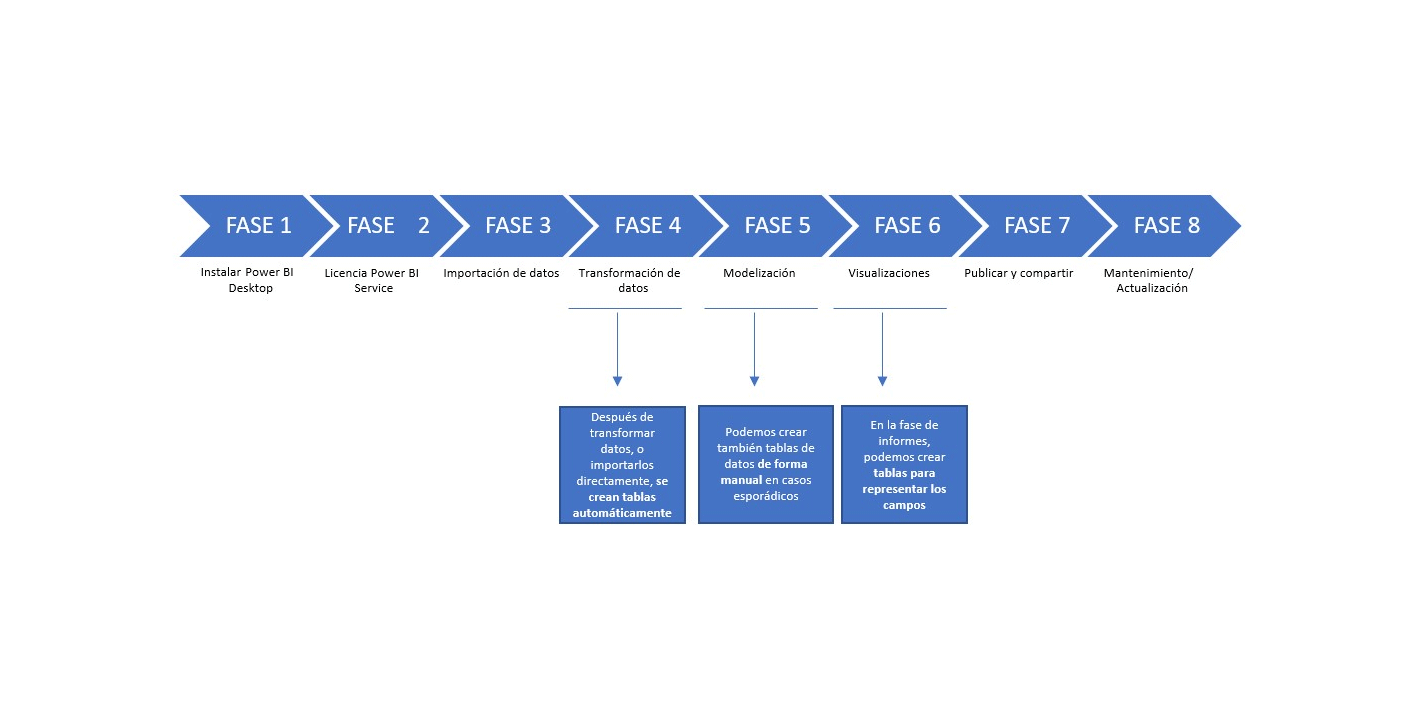
- On the one hand, as we already know, we can import data into Power BI that will be converted into data tables. And these data tables are the ones we have to plug into the model. These tables are not created directly by us, but are created when we import data into Power BI Desktop. If, for example, we import an Excel with two sheets, Power BI will create two data tables with the information from the columns contained in each Excel sheet. These tables are automatically created when we import data directly into Power BI, or when we close the Power Query editor, after transforming our data.
- On the other hand, we can manually create data tables in Power BI. One of those functions that we are probably not going to use very often because it is something that we can already do from Excel, faster, and with better tools. Creating a data table manually can help us at some point if we want to create a small table. In a sense, we must think that it is not usual, and it can complicate our data model. For this reason, it is best to always work from the data import, with data that is reviewed, and meets the nomenclature standards, and has a field or column that we can use later to connect to the data model. Likewise, as we already know, it is advisable to go through the transformation of the data. The creation of manual tables, in any case, It makes sense, as we have explained in very specific cases, when we are in the modeling phase. As we already know, the data ecosystem, that is, our model, must be a model made up of tables that are connected to be able to use all the columns or fields later, in the visualization or reports phase, to build our report.
- On the other hand, when we talk about data tables, we can also refer to other types of tables that are created from the Reports view. These tables are tables that are created when we are already creating our final report, and that we can build with the fields or columns of the tables that make up our data model.
When we talk about tables in reports, we are talking about a very useful resource that we can use when we are in the report view, within Power BI Desktop, to be able to build reports, Dashboards or panels.
These tables will be built based on the fields that we choose in the report view, being able to choose all the columns of the data tables of the model, and also being able to choose the fields that have been created when making calculated fields and the measures.
These tables are of great value to our project, and we are going to use them frequently to be able to capture results in our report. These tables, in addition, depending on the fields we choose, will be tables that synthesize the information, and that can reflect the values of the operations that we have carried out both in calculated columns and in measures.
As we already know, when we create a calculated field or a measure, they are created inside one of the tables of our data model. And the utility is precisely in being able to use the calculated fields and the measures to make tables and graphs in our reports..
Another advantage of being able to create tables in the Power BI Desktop report view is being able to unify the information that is, within our model, in different data tables. By having a data ecosystem with connected tables, one of the advantages that we are going to find in the reporting phase is precisely that of being able to make tables with all the fields we want, with all the fields.
The data tables that we create in the visualizations or reports phase, is one more resource that we can use when we are building what will be the report. As we will see later, it will be one more resource, such as graphics, slicers, data segmentation or cards.
1 Automatically create tables when importing data into Power BI
We already know that when you import data into Power BI, the data is converted and organized into tables based on how it is organized in the source file. If we are importing an Excel file with several sheets, each sheet of this Excel will become a data table in Power BI. If you need to see this process, and how to upload or import the data to Power BI so that they become data tables in our model, it is a simple process that we already explained to you and you can see again if you need it in how to make a model of data in Power BI
2 Create data tables in Power BI
We can create a data table manually in a very simple way, following these steps, and from the Power BI taskbar. These types of tables, as we have explained to you, are not very useful within Power BI, and can become a barrier to achieving our goals.
It is not recommended to do it frequently, only in specific cases, because they precisely work on a concept contrary to Power BI. The concept of Power BI and other data analysis and visualization tools is to work in a more general way, operating with data in another hierarchy, at a table and column level, but not a cell. However, in order to deal with all the cases that may occur in a project, Power BI offers you this possibility. Typically, your data reaches Power BI Desktop from import, or by connecting Power BI to an internal or external database. Power BI is not designed to be able to manually create data tables cell by cell, but rather to work with already created data tables.
If for some reason during the realization of your project, you need to create a table, you have to think first that this table can be created in Excel as well and then you can import it into Power BI Desktop and connect it to our model. If you want to create the table directly in Power BI, we can do it at any time from the start menu, on the taskbar, with the "Specify Data" option, as you can see in the image below.
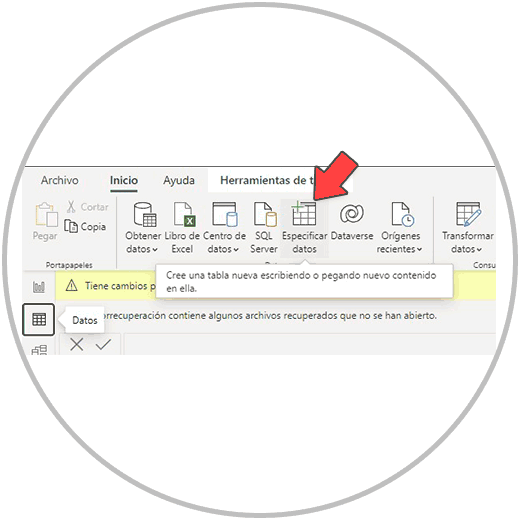
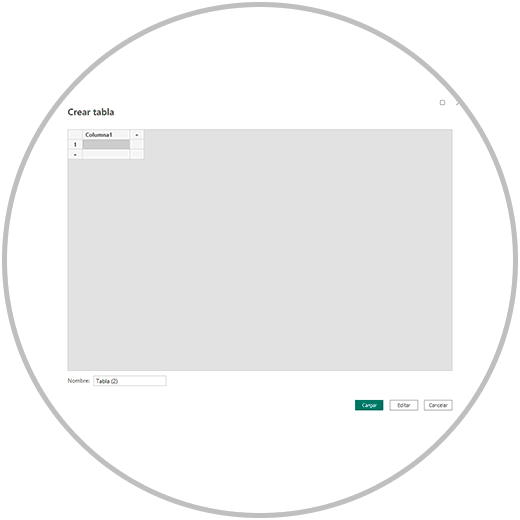
Clicking on "Specify Data" will open a window, to which we can change the name, and from which we can write in the cells, we can add new cells, rows and columns.
Note:
When we want to create a new table in this way in Power BI, we must take into account that we can copy the data from an Excel for example and paste it into this window . A very important aspect to take into account is that if this table adds information, and it is important for the reports, we must connect it to the data model . And we will have to review the nomenclatures in the case, for example, of contributing new data to concepts that we already have reflected in other columns. In these cases, as we already know, we must use the same nomenclature so that when we are in the visualization or reporting phase, the information can be added correctly.
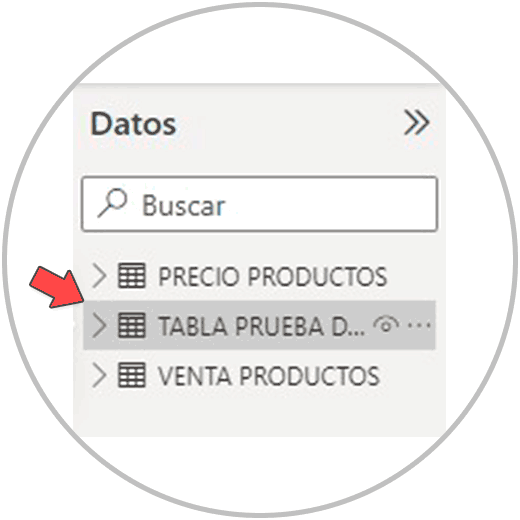
Upon loading the data, we will see that it has been created as a table in our project.
It is also possible to create a data table using other options that we are going to see in the Power BI Desktop taskbar, in Start and in Table Tools, and it is called "New table". If you notice, in the image below, the “New Table” option is among the calculation options in Power BI Desktop.
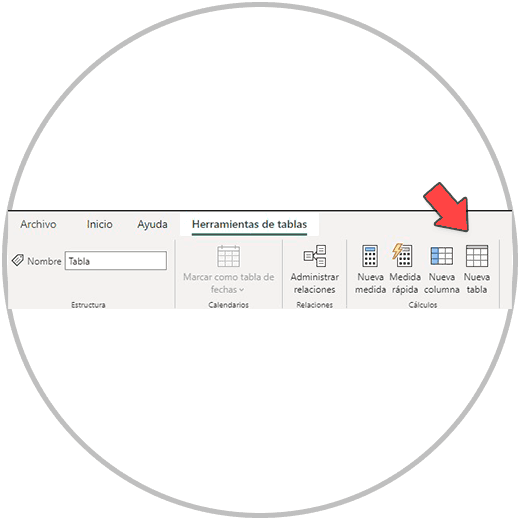
By clicking we will see that this option to create a new table within Power BI works with the DAX language, and therefore it is used to be able to use it with some of the Power BI functions. This way of creating a table is designed more to be able to extract information from another table or column that we have in our data model. Thus, we can, for example, use the RELATEDABLE, DISTINCT function to be able to retrieve information from other tables and columns.
Important:
Important: Being a new table, in which we do not have data, and since it is not connected to the model, the RELATED function does not work, you will see that when writing it we will not be able to use it. However, for example, we can use RELATEDABLE to bring us a whole table , from which we can then play with it, removing columns, adding new columns, measures, etc.
As we have explained to you, it is a resource to be able to add new tables to our data model and fill in columns and rows cell by cell, or use "copy and paste" to add information to the new table that is outside of Power BI. However, we must bear in mind that it is not a practice that we can recommend to use often. Working at the column and table level in Power BI is always recommended in order to avoid common mistakes in Excel.
Next, we are going to see how to create a table in the Power BI report view, a resource that we already mentioned before if it is of great value for your project, it will help you build the report you need to make. Because?
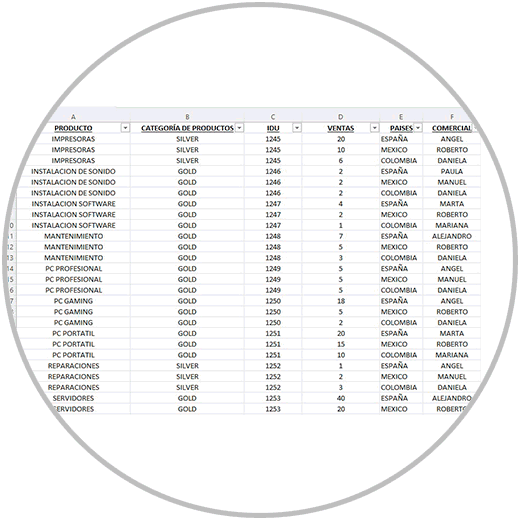
- Because you can build data tables grouping by a concept or information from one of our model columns, as if it were a dynamic table. For example, we have a table with sales information, at the product level that is repeated in a table as they are different sales, which have been produced over time.
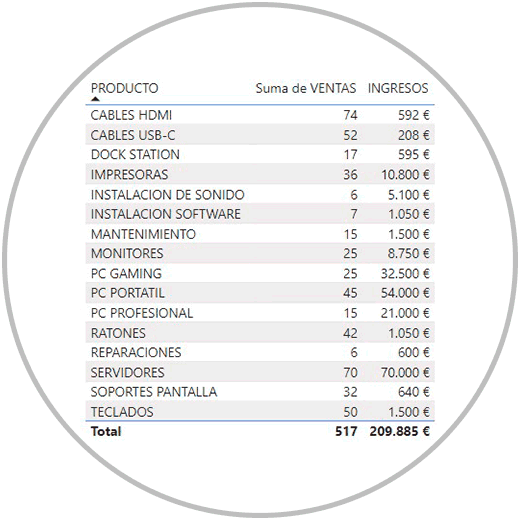
We can create a data table to see at the product level, how many sales have been made in total. As in the image that we show you below.
- Immediacy and ease to build tables. The tables, when we are in the report view, are useful as we have already seen, but they are also extremely easy to do and fast. The Power BI Interface in this sense is very intuitive, and is built with the same Power BI philosophy. Ease of use so that we can work in an organized way, without errors, and quickly. Thus, to build a data table in Power BI in the report view, we will only have to select the table icon, as we explain below, and select the fields or columns that we want to add to the table. In the image below we can see how we can manage very easily with the menu options to be able to choose the fields that we want to represent,
- The tables that we can make in the report view are also very useful to be able to build a single table that contains fields that are in different data tables. This means that we can cross information found in the data model, but in different tables. So easy, as we saw in the image above, selecting the fields that we want to represent.
In addition, within fields, we will see all the operations that we have carried out in new columns, with calculated fields, but also the measures that we have been creating. If you remember, the measures, although they are located inside a table, were not represented as a column in the data. It is now when we will be able to represent the measures that we have calculated, and add them to our reports and Dashboards.
Well, in order to make a data table in the report view, we must follow a few simple steps. We are already entering the final phase of the project where if we have successfully completed the previous steps, if we have built a valid data model to work with, it will be very easy for us to make tables, graphs, and build interactive visual Dashboards that will look out of 10. It will be the icing on the cake for your project.
Remember that data representation is a very intuitive part of Power BI, and that you will enjoy adding graphs, tables, and other ways of representing graphs, as well as other utilities that will make your Dashboard interactive. The success of your project will depend on the organization, usability, and representation of the data; But the success will be above all in the reliability of the data that you are representing. For this reason, remember the key points that your project must meet in order to successfully complete your mission:
- Standardization in the nomenclatures
- Work with correct and updated data
- Complete data, with all the valuable KPIs
- Work with a data model with connected tables
3 How to make a table in Power BI Reports
To make a table, within the data or report visualization phase, we must have gone through the previous phases of Power BI. It is not completely necessary to transform the data, but we have already seen that it is always recommended to be able to review the data with which we are going to work again, and make any changes if necessary.

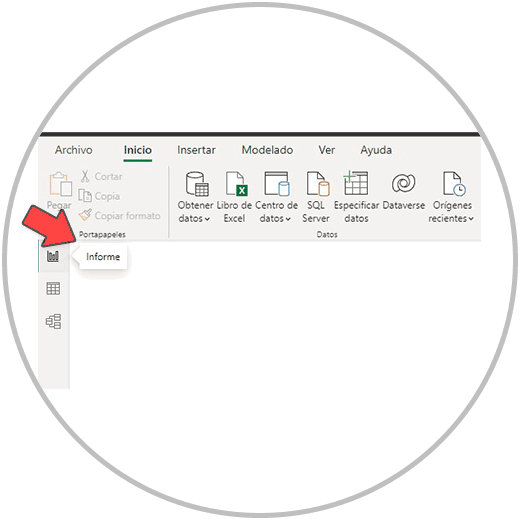
To begin, we are going to go to the report view, which we can see at all times in Power BI Desktop, on the left of our screen.
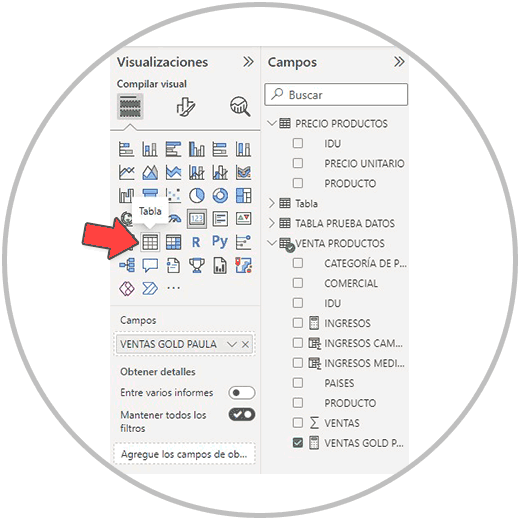
Once inside the report view, we will see a panel in the center where the tables and graphs that we are going to create will be represented. Our eyes must move to the right side of our screen, where the two menus that we are going to use to represent the data are located, which are "Visualizations" and "Fields"
To create a table, we must locate the table icon, as in the image, in the visualization menu, as we see in the image below. And click on it.
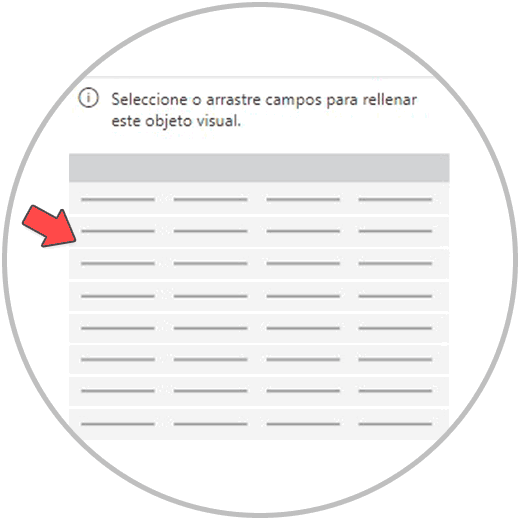
Next, we will see how an empty table has been created on our board (as in the image below) that will be completed as we select the fields or columns.
Now we are going to select the fields that we want to represent in the table. Think that you can create more than one table, but later we will learn to be able to filter the information within the tables. It is therefore not necessary that you make many tables in the report. He also thinks that the best way to represent the data when we want to give perspectives, evolution or trends, will be a graph.
In the image below, we have selected the product, sales, and revenue fields for example so that you can see important topics that we have already mentioned: we can group data, we can select fields from different tables, and we can select created measures that will also be present here. like another field.
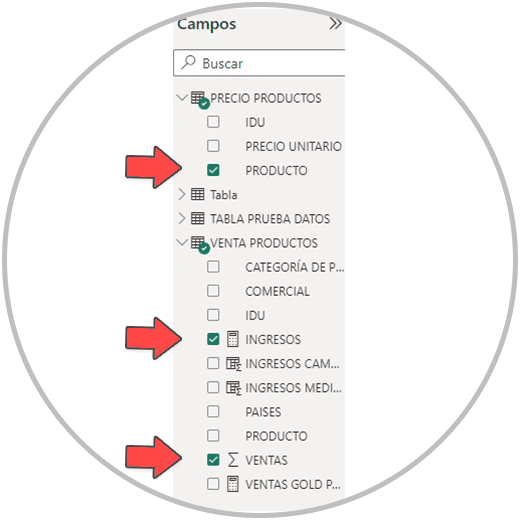
By selecting the fields, we will see how our summary data table by product is automatically created, which contains the sales information, as well as the income generated.
In this simple way we can create tables in our final reports. Think that these tables have the same utility as a dynamic table in Excel, because as we have seen in the example, it has the ability to create tables that synthesize and summarize the data. Thus we can also see in the example that, automatically, a summation has been created in each column.
This ability to synthesize and group information is very interesting and is the perfect complement to graphics and other elements that we are going to be able to create in Power BI to be able to "paint" the data.
Now our goal should be to represent the value data, the most important metrics, and give perspective to all the data that is key to analyzing the results we are dealing with.
The graphs, as well as other Power BI utilities that we are going to find in the reporting phase, are key and necessary for the objective, which, as we have said, must be to be able to analyze the important metrics at a general level and in perspective.
As we have already been able to see in the images, and as we have commented on several occasions, we have many options in the visualization menu to be able to represent the graphs with the type of graph or utility that best suits each case.