As we explained to you what a data model is, when we carry out a project in Power BI, when we use Power BI as a tool to transform data, integrate different sources, to create a professional visual report, we must keep in mind and apply a valid data model to work with. To carry out our data model, we must have successfully completed the previous phases of the project where we already know that there is a common denominator, which is none other than ensuring, confirming, verifying that the data with which we are going to work is valid. , they are good, they are complete and they have a valid format adapted to the information they reflect..
As we already explained, when we import data into Power BI, a data model will be created, which, let's say, is created automatically; Our responsibility is to review the model and edit it in order to create a valid, coherent and complete data model to be able to make reports with all the data and information in the tables.
When is the data model created in Power BI?
The data model in Power BI will be created once we import the data into Power BI, that is, after loading the data in Power BI Desktop, or after transforming the data with the Power Query editor.
Remember that once Power BI is open, when we want to import data from an Excel file, for example, we will have the option of loading the data directly or transforming the data. If we click on transform the data, the Power Query editor will open with the tools available to make changes to the structure and organization of the data we are importing. We also remind you that it is advisable to always go through the data transformation phase , which we insist can be done in this import process, or can be opened at any time from the Power BI Desktop taskbar, within the Start options .
1 How to create a data model in Power BI
In order to make a valid data model, we have to create an ecosystem of tables that must be related to each other. By relating the tables we are creating an information model with which we will be able to create tables, graphs and Dashboards with all the information available in each of the tables. In order to carry out these visual representations, which can be, for example, a Dashboard that contains tables and graphs, maps, all the tables of the model must be connected. If one of the model tables is not connected, the information collected in this table cannot be represented jointly with the rest of the fields in other tables. In other words, the information in this non-connected table could be represented individually, in a graph, for example, or in a table,
Steps to create a data model in Power BI (Example)
In order to create a data model in Power BI, we are going to see with an example how to carry out all the steps to create a model that is valid, where we have different tables with relevant information that we are going to import and relate.
In this example we have an Excel file that has several sheets with information related to an international company that sells computer products and offers maintenance services to companies..
- This company has several underlying companies in several countries, and has several physical stores, with sales staff working in each store.
- In addition, this company has an online store where you can buy all the products that are offered in physical stores.
- In some Excel sheets we have tables with information related to the sales made. These tables have a unique common denominator (which is collected in the IDU column). We will use this common denominator to relate the tables.
- Other tables contain information that is not directly related to sales, but that we still want to use to see if there is a relationship in this case between online visits and visits to the physical store with sales made.
This file, as we can see in the image below, has several tabs, with all the information that we want to use to make the reports. The first Excel sheet in the file is the sheet that we are going to use as a fact table, as a matrix of the model. It's the blue tab; The rest of the Excel sheets, in red, are attributes of the sale and complementary information related to some attribute.

These are the sheets that our example Excel has:
- SALES: This Excel sheet will be the table that we are going to use as the matrix table. In this table we have the information of the sales made with the value of the sales and the companies and stores where the sale has been made, and the commercial to which the sale made is attributed.
- PRODUCT SALE: In this Excel sheet we have the information related to the product that has been sold. An attribute of the sale that is not included in the SALES sheet.
- MONTH OF SALE: This Excel tab collects the information for the year and month in which the sale was made. In this case, we are interested in the information for the month to later see the evolution of the company by month. In the Matrix table we have the information for the year, but nevertheless it does not have the information for months.
- SALES CHANNEL: In this sheet we will find useful information from where the sale comes from, if from the digital channel or if, on the contrary, the sale was made in one of the physical stores. This information is not collected in the matrix table, and we want to have it in the model to be able to report later if the tables.
- WEB VISITS: This Excel sheet shows the visits made to the WEB on a monthly and yearly basis. This sheet does not collect any information related to the sale directly, but, nevertheless, through the dates we will be able to relate it to our model.
- PHYSICAL STORE: Information on visits received in physical stores. We want to add this information and relate it (just like WEB visits) and we will do it using the date information.
- COUNTRIES: Finally, we have an Excel sheet with the information of which country and city each store belongs to. We also want to add this information to the model so that when we speak at a regional level, we can know to which specific city and country the information belongs. In the parent sheet, we do not have this information directly since the information is collected under the nomenclature of Company 1, Company 2,... Thanks to the Countries tab, we will be able to later "paint" the information geographically.
STEP 1: Review the information that we are going to import into Power BI
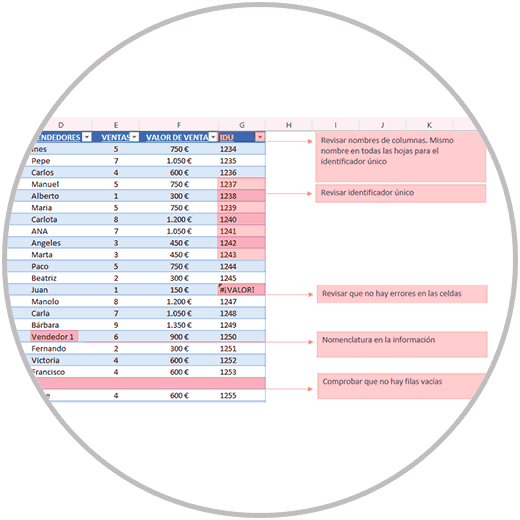
We are going to review Excel first and verify that the structure of the tables (the information that we find in the different Excel sheets) follows the same logic. Check that all the information is collected at the column level in the different Excel sheets, that there are no errors or empty rows..
We must also check that the unique identifier present in the different Excel sheets must be unique, that there are no duplicates. In the same way that we must ensure that this information must be collected in all rows.
Remember that the standardization of the nomenclatures is a key factor to be able to carry out a successful model that is valid. We must review this factor and apply changes if necessary, so that later the information can be collected and grouped correctly.
Even though it is not a "sine qua non" requirement , it is highly recommended that the column that we are going to use as a common field to establish the relationship between the tables, has the same column name. This way it will be easier to identify the common field later in case we have to establish the relationship manually. Think that a good organization in the files, having a mentality to simplify and standardize the concepts, are good practices that will help us to achieve the objective successfully, reducing margins of errors; Mistakes that are avoidable if we have a culture and philosophy of simplifying and standardizing.
STEP 2: Import Excel file with all sheets
Once we have the information reviewed, and we are sure that the information is correct, we open Power BI Desktop and import the information source. In this example we import the Excel file where all the information is located.
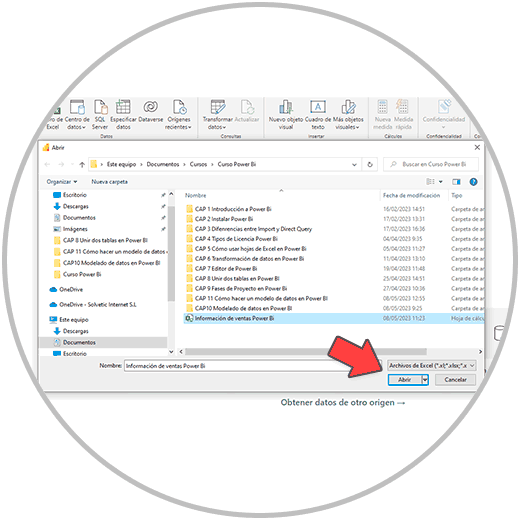
To carry out the import of the Excel file in Power BI we go to the Power BI Desktop taskbar, and click on "Excel Workbook", as in the image below. In this case, we select the source of the data, which is the Excel file where we have the information collected, and click on open.
STEP 3: Select in order the Excel sheets to import
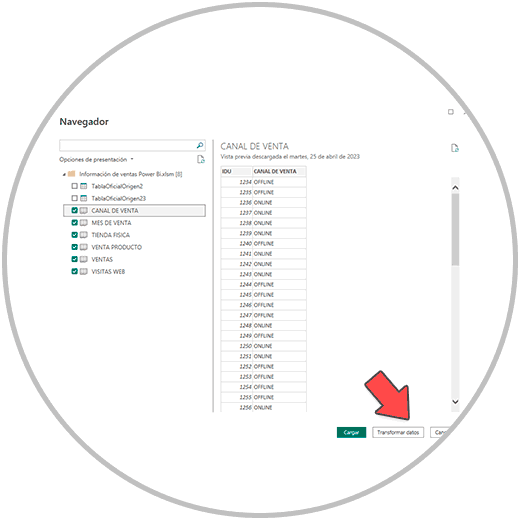
Now we are going to select the Excel sheets that we want to import. We remind you at this point that as a recommendation you can first select the fact sheet (Facts) that will serve as the matrix table in the report, and then we would select the rest of the sheets.
In the example our parent table will be "SALES". We select "SALES FIRST" and then we would select the rest of the sheets of the document that we want to import.
Once the sheets to import have been selected, we are going to click on “Transform data”.
STEP 4: Transform data in Power BI
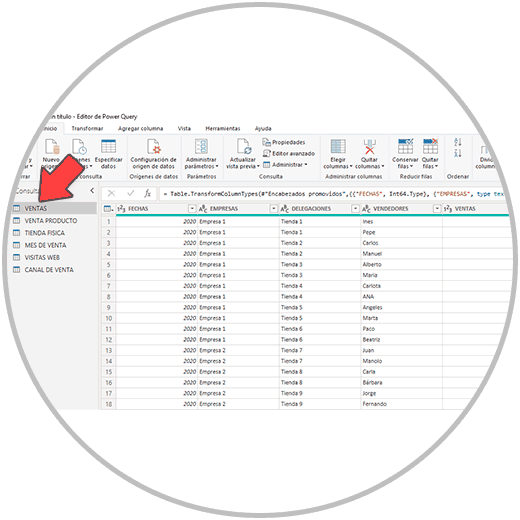
Clicking on transform, as we have already explained, will open the Power Query editor from where we can make some changes to the data. As we will see in the image below, each Excel sheet has been converted into a query. Now we will have to go query by query, reviewing and making the appropriate changes and if they are necessary in each case. We will start with what will be our parent table, the query “SALES”.
In the example we are following, we review all the column names to apply the correct format in each case. Check these points:
- That the columns with text have a text format.
- That the columns where the unique identifier is, is an integer: without decimals, without currency format, etc.
- Also check that the columns with the value of the sale, in this case, have a numerical value with decimals and with the corresponding currency.
- Check that the columns with dates have date format
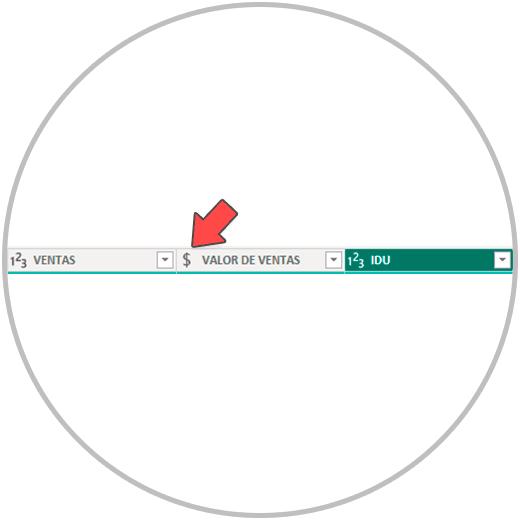
If you want to make any changes to the column format, you just have to click on the symbol that you will see in front of the column name, as in the image, and select in each case the format that best represents the information contained in each column. .
REMEMBER
Many changes can be made in the Power Query editor with the tools available to transform the data. There are many changes that can be made in this step, if you want to see more details you can see how the Power BI editor works.
STEP 5: Close and apply queries in Power Query Editor
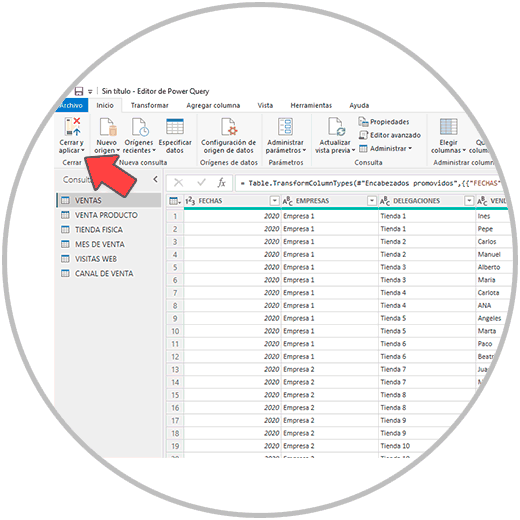
Once we have reviewed all the queries in the Power Query editor, we are going to finish the data transformation phase by applying changes and closing the Power Query editor, an option that, as we see in the image below, is found in the toolbar. tasks at the beginning.
STEP 6: View the model created in Power BI
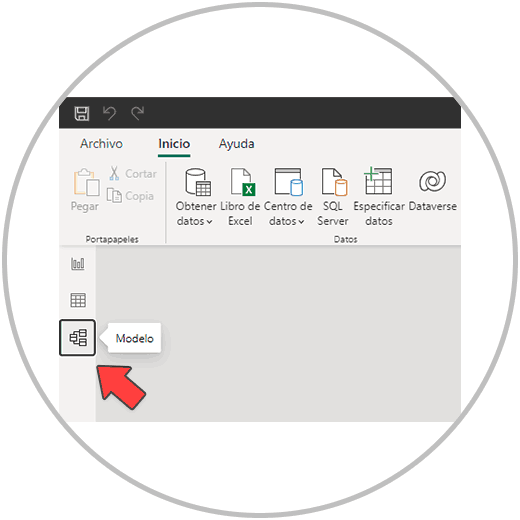
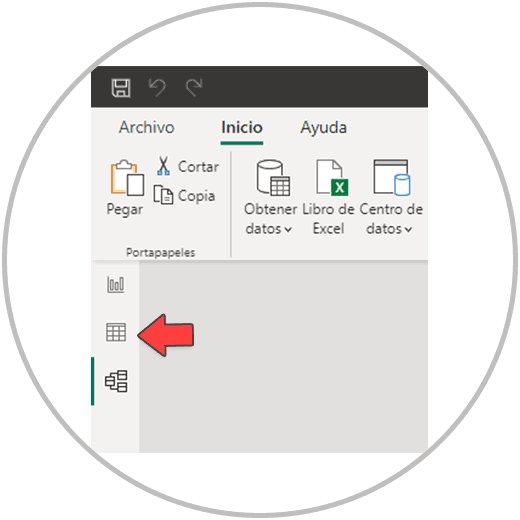
Once the Power Query editor is closed, we go to the model module, one of the icons that we have on the left, in the vertical menu.
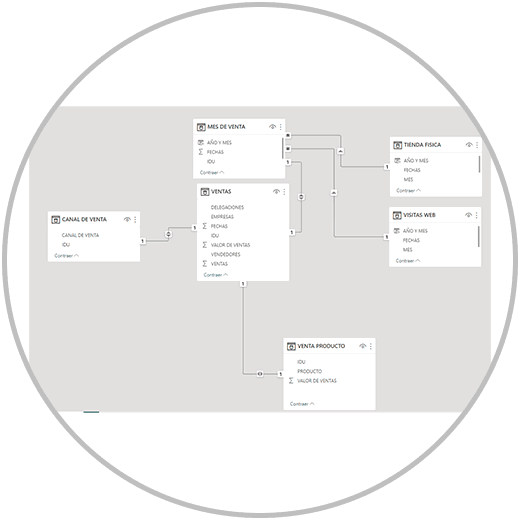
When we access the model module, we will see what were our Excel sheets, which became queries in the Power Query editor, as data tables in the center of the screen. As we will see in the image, some of the tables have already been automatically related by having a common denominator, which is what we call unique identifier, which in this case in the example is the "IDU" column. (This unique identifier is also called a key column.)
We will also see how our fact table, which if we remember was the "SALES" tab, is located in the axis of the table schema as a matrix table to which some tables containing sales attributes have been connected, and as we said thanks to the IDU column that acts as a table connector.
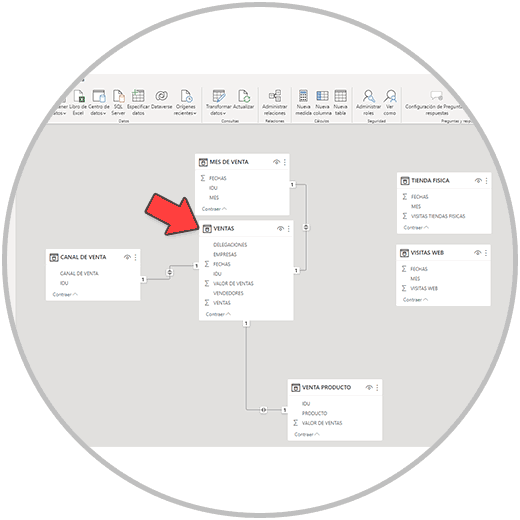
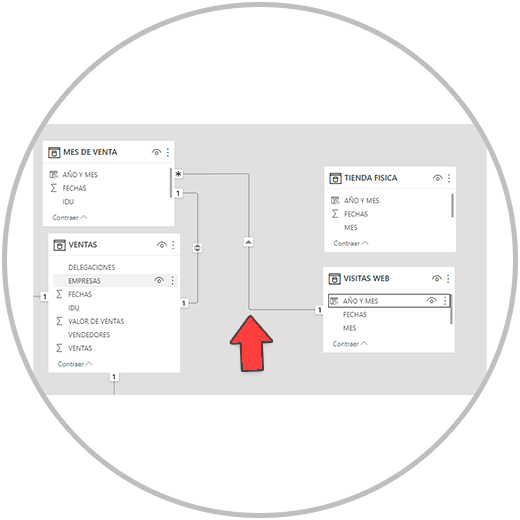
In the image above we can see how there are two tables that are not related to the model, which are the tables: "WEB VISITS" and "PHYSICAL STORE". These tables are not related to the rest of the tables because they simply do not have a key column, that is, they do not have a column with a unique identifier.
What could we do to connect them? As we said at the beginning of the exercise, the information in these two tables "WEB VISITS" and "PHYSICAL STORE" are not related to the sale, and for this reason they do not have a unique identifier. However, they provide information that we then want to compare to sales to see, in this case, what relationship web visits and visits to physical stores have with sales, if any.
In this case, the information that we can see in these two tables, apart from the visits, are the dates. In this case, the dates cannot be used directly as a unique identifier, since on one side we have a column with the information of the year, and in another column the information with the month.
What we are going to do from this information is create a new column, concatenating the information for the year with the information for the month. In this way, we will be creating a column with unique information, using one of the outstanding functions of Power BI: measures, which work with the DAX language, a specific Power BI language created to be able to perform calculations and operations within tables.
STEP 7: How to create a measure in Power BI
A measure in Power BI can be created from multiple zones, at different times in the project. Although the need, as it is in this case in the example that we are explaining, arises above all at this point where we have already transformed the data and are creating our data model.
Although we are going to explain measures and Dax in depth in the next chapter, we are going to see in this example how to use measures in Power BI, creating new columns in the data tables in order to perform an operation. In this case, it will be a concatenation of columns to build, as we have already explained, a new column that contains a unique identifier. We are going to use this technique in the "WEB VISITS" and "PHYSICAL STORE" tables, but also in the "MONTH OF SALE" table. This way we will be able to connect the tables "WEB VISITS" and "PHYSICAL STORE" with the data model that we are creating.
To calculate a measurement, we are going to go to the data module, located on the left of the screen, in the vertical menu of the 3 icons. We click on the data module.
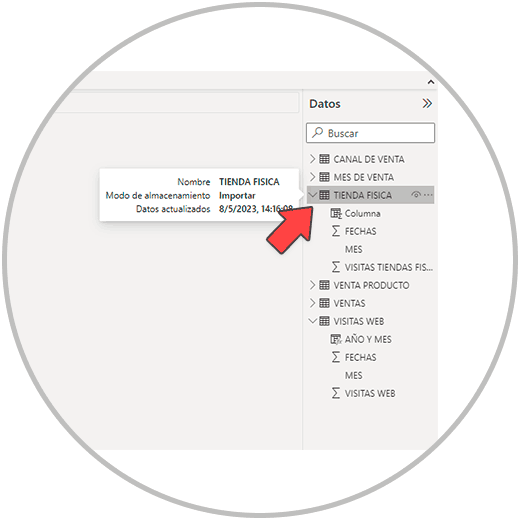
Once inside the data module, we go to the right and in the data column we select the table where we want to make the measurement. In this case we will go to "PHYSICAL STORE". (We explain how to carry out this process for a table, then remember that we will have to do the same for the "WEB VISITS" table and for the "SALE MONTH" table ).
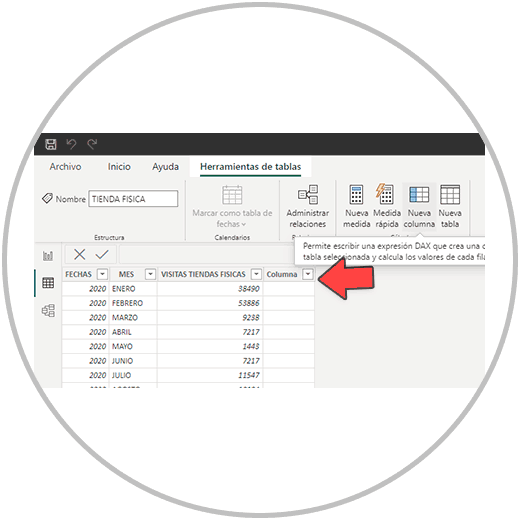
Once we click on the table where we want to carry out the measurement, the information of the table with the columns will open on the screen. We are going to create a new column by clicking on "New Column" on the taskbar, within the start options, and as we will see in the image below, a new column will be created that will be added to our table.
Now we click on the column header, and the entire column will be selected. We will go back to Start on the taskbar, and this time we click on “New measure”.
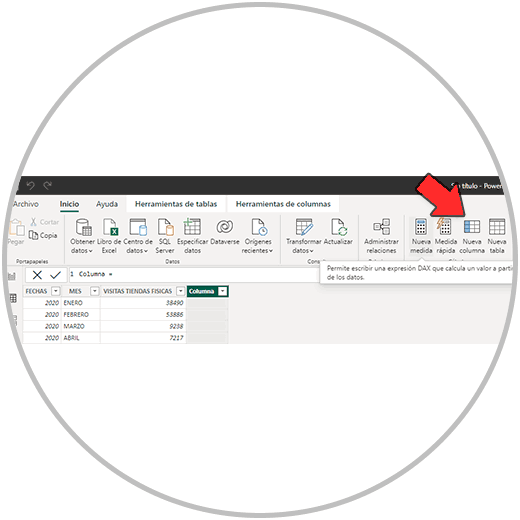
Clicking on new measurement opens a bar above where the operation will be carried out. We have to click right after the space after the equals (=)
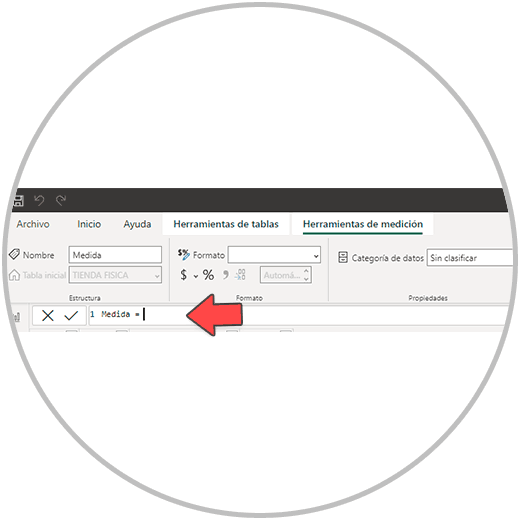
Now to carry out the calculation, we begin to write in the bar (We must take into account that in Power BI, when making the calculations, selecting the names of the columns with the mouse does not work in this case. We must write in the bar the names of the columns and the signs of the operation that we want to carry out. You will see this detail better below, continuing with the example that we are carrying out).
The operation we want to perform in this case is to concatenate two columns, leaving a space, so that we can see in the new column created, the year and the month with a space in between. We begin to write in this case first the name of the year column, which is called "DATES". We will write until we see that it appears in a blue window, as a suggestion, the name of the table in which we are working between commas, with the name of the column that we are writing in square brackets.
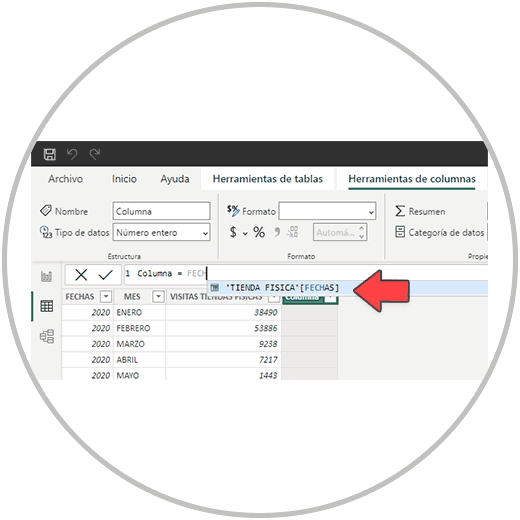
We click on the blue window then, and we will see that the “DATES” column has already been placed in the formula. Now in this case, since we want to concatenate, in the bar where we do the operation, we add a space and write the following: & " " &.
With this we are telling you that we want to concatenate the "DATES" column with another column, leaving a space in between. So that we don't join the two columns together with no space.
After & we leave a space and we write again, now the name of the other column that we want to concatenate, which following the example is called "MONTH".
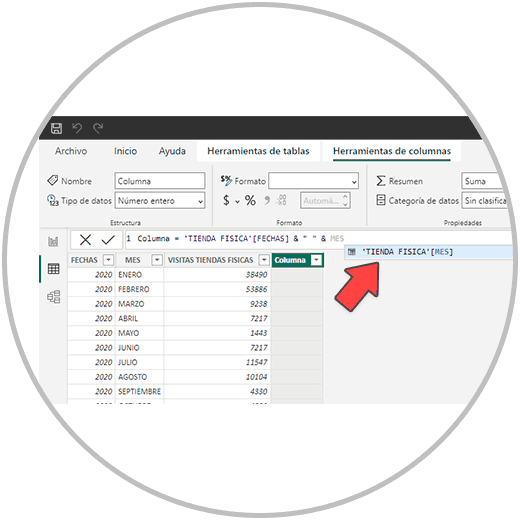
Now as we did before, we click on the blue window thus selecting the other column that we wanted to concatenate (“MONTH”) and press the Enter key.
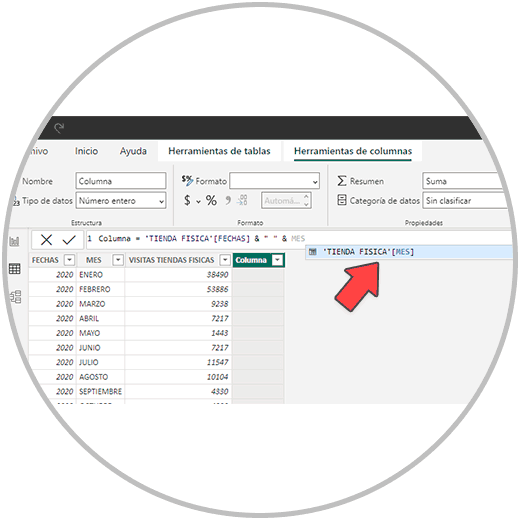
If we have done everything correctly, we will have successfully created the concatenation and in the column that we created new we will now have the information of the month and the year where each sale took place.

Now we will have to carry out this operation, as we have said before, in the tables "WEB VISITS" and in "SALE MONTH". In the model that we are creating, if we remember, we already have the table "SALE MONTH" connected to the model. By creating a common field in these three tables we will be able to connect all the tables to the model.
RECOMMENDATION
We recommend you rename the new columns created in each table, and in this case call them the same to know later that these are the key columns with which we are going to make the relationship between tables. Thus, in the case of having to create more columns for other reasons, such as performing an operation with the data in the table, it will no longer be a problem and we will be able to identify each column according to the information it contains. To change the name of a column in the data of a table, you just have to double click on the column header, and give it the name you consider appropriate. Continuing with our example, we have named the column “YEAR AND MONTH”.
STEP 8: Relate tables in Power BI manually
Once we have already carried out this concatenation operation in the "WEB VISITS" and in "SALE MONTH" tables, and once we have already changed the name to the header of the new column created, where we have carried out the concatenation, we are going to create a relationship between tables manually.
To carry out this process again we are going to go to the Power BI model module, which if you remember we will find it in the vertical menu on the left of our screen.
Now, as we will see in the tables, we can already see the new columns created in the 3 tables. In this case, what we are going to do is relate the two tables that we had unrelated in the model (“WEB VISITS” and “PHYSICAL STORE”).
We start, for example, with the "WEB VISITS" tables. We locate in the table the new column created that we have called "YEAR AND MONTH", we click and without releasing we drag to the column "YEAR AND MONTH" of the table "MONTH OF SALE", as in the image below, we will see that already A relationship has been established between these two tables.
We do the same with the table "PHYSICAL STORE". We only have to drag the new column "YEAR AND MONTH" from the table to the column that has the same name in the table "SALE MONTH". Now, as we see in the image below, we already have all the tables connected in our model.
Types of relationships between tables in Power BI
When establishing relationships between tables, we can find 4 types of relationships:
- From one to many: When we establish the relationship of a table with unitary values to another table where the values are not unitary and are repeated
- From many to one: The opposite case will be to establish a relationship from a table that has repeated values to another table with unitary values.
- One to One: When establishing a relationship between two tables with unique values
- From many to many; when the relationship established is between two tables where neither has unique values.
The type of relationship that is established is reflected if we look at the model, in the line that joins the two tables when we relate the two tables, just where the intersection joins where the line joins the table. A one (1) means that that table has a unique identifier, and an asterisk (*) that that table has identifiers that are repeated in the key column.
2 What is the data model used for in Power BI?
Now that the data model is created, if we look at the fields column on the right, we have all the fields, which are the columns of all the tables in the model, available to use when creating a table or a visualization or graphic.
By having all the tables in the model related, one of the great advantages and utilities of Power BI is being able to precisely make a complete report using various data sources. In order to carry out this report with several tables, we only have to connect the tables, which also, as we have seen, is in many cases a relationship that is created automatically. We say that it is one of the strengths of Power BI because with simpler tools, in order to make a report we would have to cross-reference information and build a single table with all the data sources. A process that is not practical, neither because of the dedication of time necessary to carry out operations like this, nor because of the margin of error that, being a manual process, is higher.
Relate tables in Power BI, an important step to connect the information
As we have seen, the table relationship is established automatically when we import or load the data directly into Power BI, or when we apply the changes and close the Power Query editor after transforming the data.
In this way, as long as there is a common column in all the tables with a unique identifier, Power BI will automatically relate these tables to us.
As we have seen, if we want the fact table to remain in the center of the model, we recommend that, when loading the data, or applying and closing the changes in the Power BI editor, first select the matrix table or table of facts, and then select the rest of the tables.
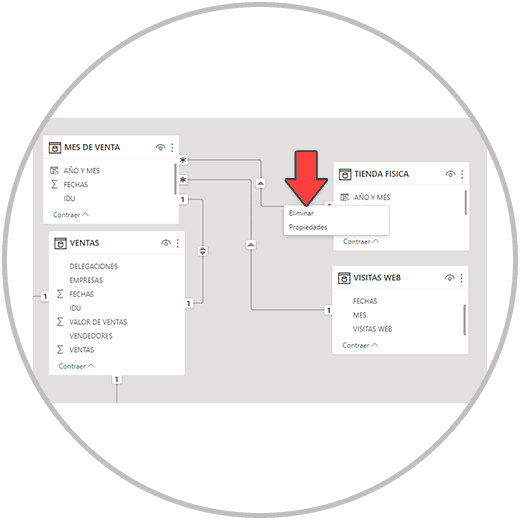
To see the data model, we have to go as we already know to the Power BI data model module, which is in the vertical menu on the left. There we will see all the tables that have been created when importing the data. As we have also seen in the example, to create a relationship between two tables we just have to drag the name of the field or column from the table to the other column or field of the other table with which we want to establish a relationship. On the contrary, to delete a relationship between tables, we just have to right-click on the line that joins the two tables and click on “Delete”.
From the taskbar, when we have the data model on the screen, we will be able to manage the relationships between tables also from the Power BI "Manage relationships" tool. From here, when we click, we will see a window from which we can manage the table relationships of the model, and connect tables or remove the relationship between tables.
How to make a star model in Power BI?
The star data model, as we saw in what a data model is in Power BI, is a type of model in which we have a table of facts or facts that would be connected to several tables (dimensions) that have complementary information. (attributes) of the facts.
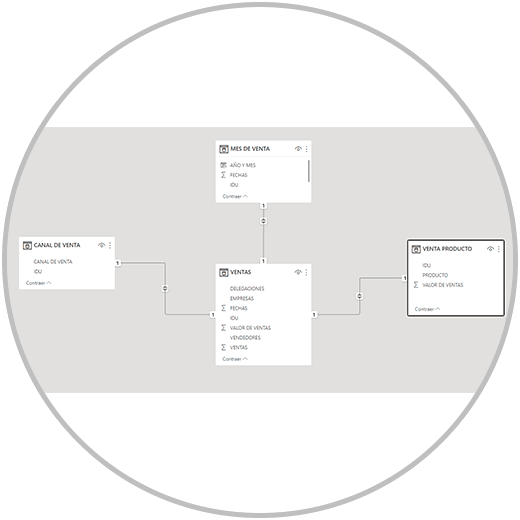
Continuing with our example, the first model that was created is a star model in which we have a matrix table with facts, which would be sales in the example, and another series of tables with attributes of the sale, such as the date. in which the sale took place, the location of the sales, if it was an offline or digital sale, …
A star model in Power BI presents a parent table that is the only one connected to the other tables in the model; And the rest of the model tables are only connected to the matrix or fact table.
This process that we just saw is done to calculate a measure in Measure in Power BI. As we have mentioned, Power BI uses its own language to be able to perform simple and complex operations, and it is called DAX. In this case we have used the measures, and the DAX programming language to be able to do a concatenation. But we can create a new column, and the Power BI measures to carry out as many operations as necessary to be able to subsequently carry out the report with all the KPIS or values that must be included in the report. Once we have made our model, it is precisely the time to review the information we have, make sure that all the tables are connected, and it is also time to see if we want to perform any new operations on the tables: addition, subtraction, calculation of ratios , etc.
Using the logic of Excel, we can create new measures with DAX that allow us to expand the information we have in the tables. It is common to have to do this type of operation since when gathering data in Power BI, the possibility arises of making calculations that we could not do before. Precisely for this reason, just before starting to build our reports, we have to review the available information and assess whether we want to perform any operation or calculation.