We are going to explain what data modeling in Power BI consists of, the concept of tables, the need to connect the tables with each other, why the relationships between tables in Power BI are necessary in the process of making visualizations in Power BI. We'll learn when we should use a data model in our Power BI project, why it's so important, and what types of models exist. We will learn concepts such as "facts" and "dimensions", and we will learn what philosophy we should apply in the treatment of data in order to carry out a professional and unique data model that can be used as a source of information for a reporting system..
Beyond seeing Power BI as a reporting analysis tool to be able to analyze data, verify that this data reflects reality and create more complex tables or Dashboards with which to make decisions based on a set of data, we must see Power BI as what it is: a very powerful tool used in Business Intelligence to create a coherent data ecosystem; A data ecosystem that has the capacity to absorb many data sources, that can transform, connect, and give meaning so that it can be used as the "single source" of reporting to be able to analyze all those KPIs or relevant values to measure and parse successfully.
This idea of unifying the information, and being able to create a master database, is followed by another idea that long ago sounded somewhat utopian due to the complexity of carrying out this task in a simple, efficient way, with automation that made this process a simple and viable task for any analyst.
In a perfect world, companies would have a single database where all commercial data, of interest, related to commercial activities (such as sales) as well as any other data of interest, would be reflected in a single file with which be able to work directly to make reports with graphs, tables, maps, etc..
The reality is usually very different; Although it is true that the trend in data is to unify with the same program or software all the data generated by a company, especially the commercial ones, in practice it is impossible to extract a single file that contains all the necessary data that we need. to report. Even in situations where all the information or activity of a company is collected in the same program, when it comes to extracting that data, either due to the volume, or due to program impediments, on many occasions it is impossible to carry out that single extraction that allows us to work in an agile way.
On many other occasions, what happens is simply that you want to build a single database in which we are extracting information or data from programs that are different, and where it is impossible to unify this data in order to work with a database. teacher..
Let's see this situation better with an example. Let's imagine a company with a physical and online store where physical commercial activity is generated in traditional stores, but where there is a digital channel where it is also possible to purchase all the products offered in a traditional store. In this case, apart from sales, it is possible that, even having the same system where sales (online and offline) are collected in the same program, there is another type of information that cannot be collected directly in this system. For example, online visits would be collected in an analytical application such as Google Analytics. Let's also imagine that this company carries out advertising campaigns in media such as TV and digital,
If we then want to have a file with all the sales information, offline and online information, and also collect other attributes such as visits to online stores, and, in addition, advertising pressure and daily investments in each channel, it is not we will be able to export all this information in a unified way by making a single query. Each metric in this case must be collected from different sources where this information is recorded.
But what we can do is extract all the information from all the relevant data sources for the future of the company, and unify the information using a tool that allows us to absorb all that information that we have had to download from different sources, transform it, and relate it, and finally report it to make decisions for the benefit of the company.
This is where business intelligence and data science tools, such as Power BI, come into play, and it is in these circumstances that we will better understand what a data model is, what it is for, and why it is a very important step in data processing and management. of the data when the objective is to analyze and make decisions. It is in these professional data management environments, where the excess of information predominates and there is a lack of criteria to unify it, where tools such as Power BI can come up with a solution, applying criteria, order and coherence, to unify databases and connect them with That goal we talk about so much: creating a single master database that serves as the pillar and backbone of our analysis and reports, called the data model.
1 What is a data model
A data model is a representation of a set of data organized and structured in different tables that are organized and related to each other, in such a way that complete reports can be created, with the different fields, attributes or dimensions that are collected in the different tables. of data. Establishing this relationship is possible thanks to a common field that works as a connector between the different tables where there is a matrix table, commonly called facts, and some tables with dimensions that act as information amplifiers.
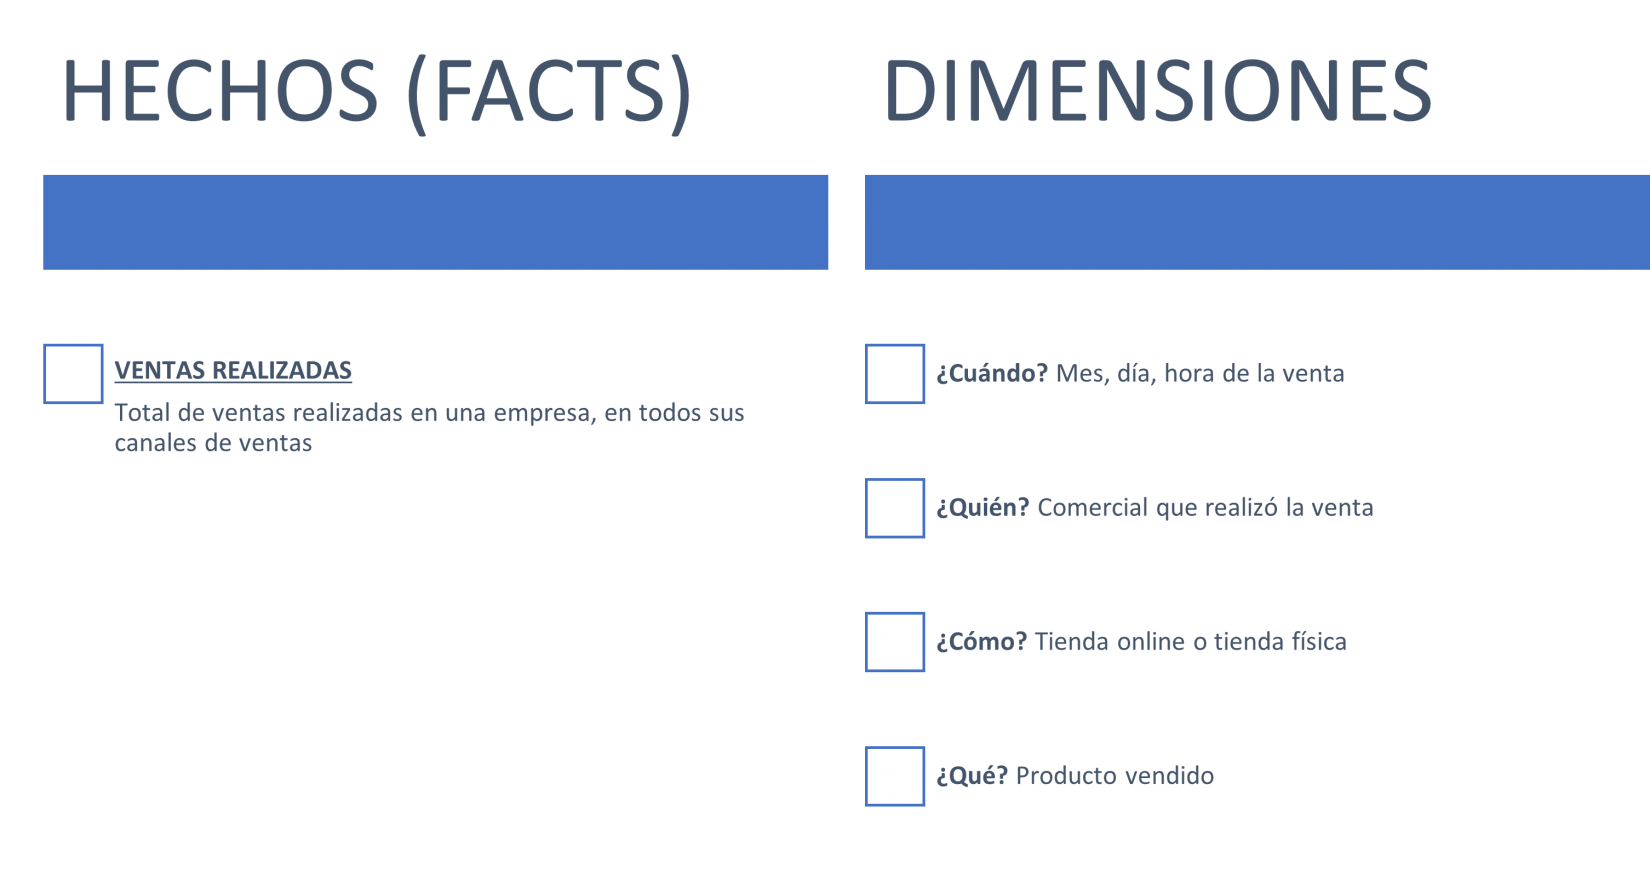
For example, in a table information about the sales of a company is collected, and in other secondary tables, more information is collected about those sales, attributes such as:
- When have they been made?
- Where have these sales occurred?
- How did you get those sales?
- What products exactly have been sold.
The data model is the bone structure of the reports, like a backbone, in which we have well-organized and related information , in order to overcome the handicap of having information from different sources that must be unified in order to make sense of it and report it. accordingly with the totality of the data.
In the transformation of the data, we have already seen how Power BI has in Power Editor the functions of combining and appending precisely to be able to carry out a single query with all the information, crossing the information with a common field.
The data model goes one step further for more complex cases where the combination of different sources and data sets requires the creation of a structure of tables that are related to each other.
Is it necessary to always make a data model in Power BI?
The creation of a data model is a very important step in any project; A data model will be created automatically when:
- Data is directly loaded into Power BI
- Or when we finish the transformation phase, when we close and apply the changes in Editor Power Query
In the same terms that we have been commenting on the usability of Power BI in cases of having to unify separate or disaggregated information, the situation of already having a single database that is the pillar and the complete column of a report can occur, when having all the information collected and unified in the same database, and since there is no secondary information in this case that leads us to have to dedicate time to working on the already created model.
Even in a hypothetical situation where we have separate information in several tables, we can manage, as we have already seen in data transformation in Power BI, with the options of combining queries and appending queries: two functions that exist in the data transformation, within the tools of the Power Query Editor, to be able to cross-reference information and unify data.
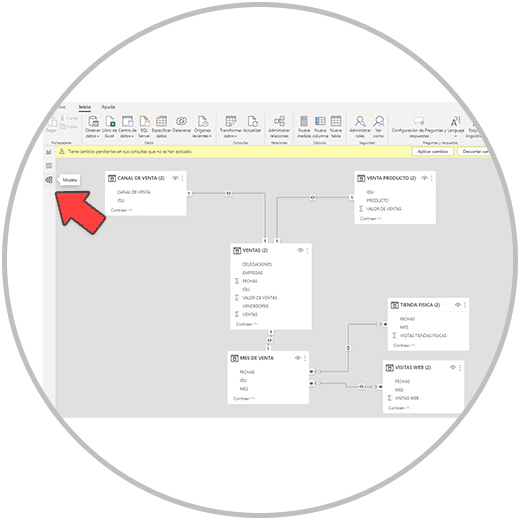
In any case, as we have commented, the data model is going to be created, and we can see it in the "data model" module, represented in a button on the left, in the small vertical menu, where we can move at any time. between the data, the models and the visualizations created.
In addition, we must take into account that, from the data model, even having all the information previously collected in the same table, it is possible that we want to create a new column in the table using, as we will see later, the measurements (Dax) of Power BI.
Power BI works differently than Excel when it comes to doing calculations in new columns. The measures are in Power BI what in Excel are the functions or formulas with which we calculate ratios.
RECOMMENDATION
When loading data directly into Power BI, when importing data from an Excel file with several sheets, it is recommended to first select the one that will be your fact table (or facts), and then the rest of the sheets. Excel that you want to import.
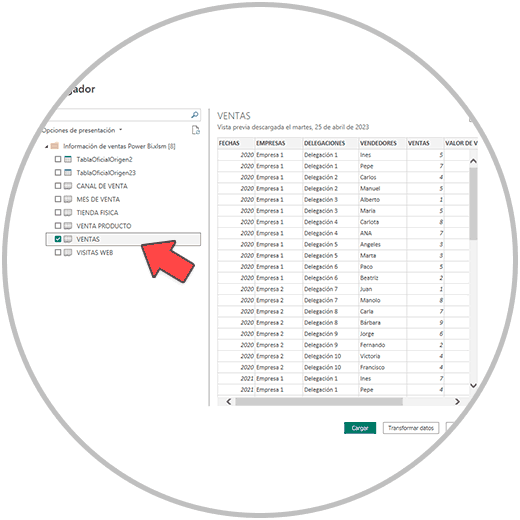
This detail is important because when creating the model, as we have already seen, this is created automatically by default, Power BI will place the Excel sheet on the axis of the model as a matrix table or fact table (or facts). Let's select first.
The same thing happens when we transform the data. If we are going to transform several Excel sheets, we recommend that you first transform what will be your fact table.
If we do not follow this order, there is no problem because the relationships of the tables, as we will see, is something that you can change at any time, and you can edit and create your relationships between tables manually. But if we have this way of proceeding, the truth is that we later save a part of the process that would be more manual.
As we will see later, and we have already commented on previous occasions, the "standardization of concepts" is essential. More than a Power BI requirement, it is a philosophy that we must learn and preach in our work in order to obtain a professional result.
When we talk about standardization of concepts, we are talking about always using the same criteria in the nomenclatures (naming), in how we call the events, people, or concepts in the information that is collected both in the names of the columns, and in the information in each column of a table.
For example, let's imagine a company that sells computers, peripherals and computer products, and that has a presence in several countries. In the databases where the sales information is collected, we find different ways of calling the same product: laptop or laptop. When crossing the information, creating a model, or directly representing it in a table or graph, we have to unify the criteria of this product. At the risk of falling into the obvious, the truth is that in practice we find erroneous reports for this reason, with a lack of standardization of criteria.
It is very common to come across reports where a lot of effort has been put into creating a very visual report, attractive to look at, but that presents errors of this type because not enough time and effort has been spent reviewing the data. For this reason, we say that we must instill in ourselves this philosophy of reviewing, checking and ensuring that the data with which we are going to prepare the reports faithfully reflect reality, that they are valid data, that there is unification of criteria, etc.
Let's imagine another case where precisely the field or column where the information that we are going to use as a common field to create our model is collected, contains errors, duplicate values, etc. The report derived from this poorly done model will give us information that is not real, is not correct, and will obviously lead us to make decisions on the wrong basis. As we will see later, once we have carried out the transformation of the data, and have created a valid model, preparing a report is an intuitive and simple task thanks to the Power BI interface and the functions that exist within the "visualizations" module. .
2 Types of data models
Depending on the simplicity or complexity of the model, we can mainly talk about two types of models: one where there is a common field that works as a common denominator and connector, joining the main table (Facts or facts) with other secondary tables ( dimensions) that extend the information.
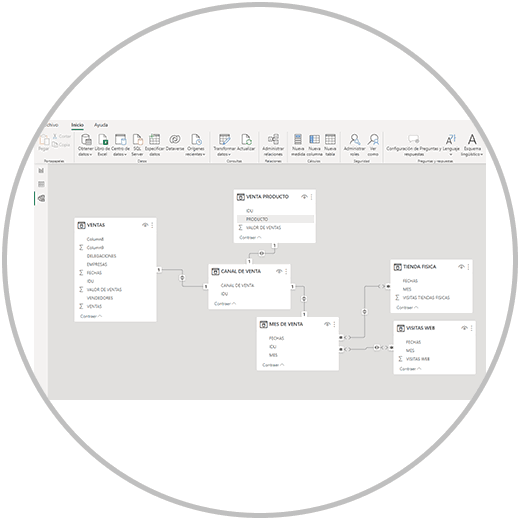
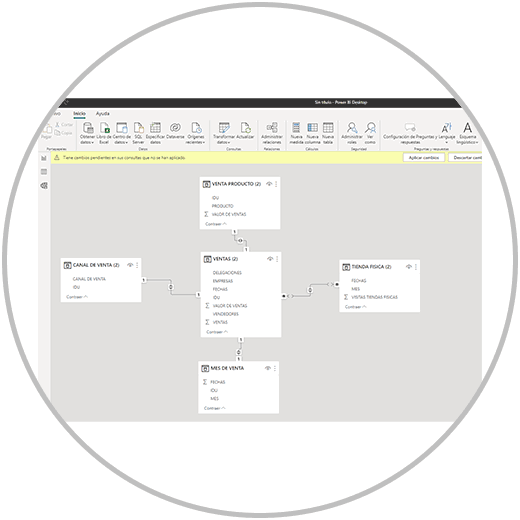
"Matrix" data model or commonly called star data model: In this data model we have a fact table, which for example are the sales of a company with a unique identifier, and around it we have other secondary tables that in this case would contribute More information on the sale: Sales channel where it occurred (if it was in an online store or a physical store), the month in which the sale occurred, and what product was sold in each case.
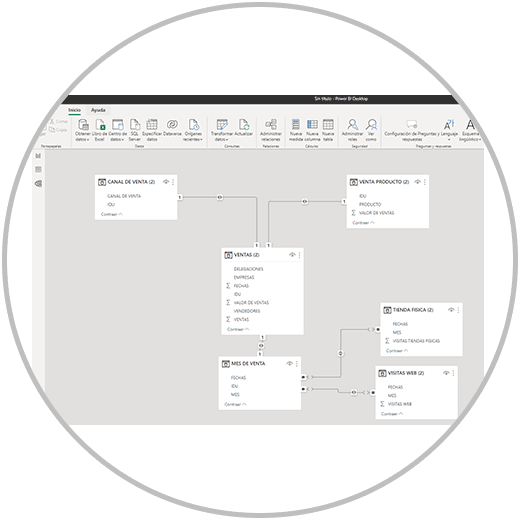
Tree data model: This data model goes a step further, in that we have, as in the star data model, a fact table connected to other dimensional tables by a common field, and we also have other data tables that they are connected to the secondary dimension tables. Thus we can connect the secondary tables or dimensions with other tables that provide other information, which is not connected to the matrix but to the dimensions based on another concept, such as a date. In this way, all the tables will be directly or indirectly connected to the matrix, to the fact table in order to build a single data structure.
Why is data modeling in Power BI important?
A data model will provide our project with a structural, dynamic logic and connection to the data, providing precision and coherence in the visualizations, reports and Dashboards that we are going to create with the model ; A data model is important because we can create a structure and organization of the relevant information. A data model connects all the relevant information, relating different data sets, and creating a single source of information that we will use as a pillar and base to create reports. In this way, we are simplifying a data ecosystem that can be complex, giving meaning, structure, and simplicity to the data so that it can be the only source of information for all reports.
3 When to create a data model?
A data model is created automatically as we have seen when we load data directly into Power BI, or after saving the changes and closing the Power Query editor, that is, after data transformation. In both cases, that is, once the data has been imported into Power BI, a model will automatically be created that you can see, edit and configure the relationships between tables from the model button that exists in the vertical menu on the left , as we could see in the image.
We must expend effort to configure our data model, especially when we have to consolidate information found in different sources, when we have disaggregated information, which must be consolidated and structured in order to carry out a complete analysis with the necessary information.
As a general rule, and as we have already mentioned, we must apply the philosophy of reviewing the work we are doing. In this case, it is important that in this phase we review what relationships have been created in the model, and if we should delete any relationship or establish new relationships between the imported data tables.
In addition, we must take into account as we have also commented that, once the relationships between the tables have been created, it is time to see if it is necessary to carry out measurements (Dax) to add new information or calculations to our data tables and models. As always, thinking about the final report that we are going to do, thinking about what metrics we want and need to report in the report. If all this information is already in the tables, or when merging different tables and relating them, we must, for example, calculate ratios or perform some operation such as additions, multiplications, divisions or more complex calculations.
When we work in Power BI, as we already know and have explained in the Project phases in Power BI, it is always recommended to start by transforming the data and turning it into queries. When we carry out this step, with all the data that we want to use in the model, Power BI will automatically create a connected data model for us as long as we have a common field in all the tables, a unique identifier that Power BI will detect and use as a connector. . For this to happen, we must have a common field in all the tables, a column with values that are unique identifiers, and that the name of this column is the same. This makes it easier for Power BI, but also for you, since you won't have to manually establish the connection between the tables. The relationships that are created between tables automatically,