The network is one of the fundamental elements in any organization since some failure in it will have a negative impact on the entire functioning of the roles and services of both the servers and the other elements of the network infrastructure ..
Nowadays it is normal for the network, both local and external, to suffer damage from attackers, excessive use of data, failures in its hardware devices or in the system itself. Hence the need that as administrators or network or IT personnel, we are clear about how we can obtain real-time statistics on the behavior and use of the network . For this reason TechnoWikis will explain two great utilities that have been developed to allow us to have total control of the network and its respective parameters.
For this study we will use Ubuntu 18.04..
What is vnStat
The vnStat utility has been developed as a network traffic monitor which is console based and available for Linux and BSD systems. Its mission is to keep a record of the network traffic for the selected interface where these statistics and metrics of the network interface are provided by the kernel as a source of information.
By using vnStat, we are not making use of any traffic which ensures that we will not unnecessarily use system resources affecting its operability and performance. vnStat is an open source / GPL utility and can be installed as root or as a single user with the respective permissions.
features
Among its characteristics we find:
- Quick and simple utility to install and run.
- It offers statistics that persist through system reboots.
- It is capable of monitoring multiple interfaces simultaneously.
- It has several options for outputting the results.
- Offers traffic summary by hour, daily, monthly, weekly, 10 days and more.
- It is possible to obtain the optional png image output (using libgd).
- We can configure the months for accounting issues.
- Light and minimal use of resources which optimizes system performance.
- Low CPU consumption regardless of real-time traffic.
- It is possible to use without root permissions.
- It has an online color settings editor.
What is vnStati?
The purpose for which vnStati has been developed is to offer support for the image output of the statistics collected through the vnStat utility. The image file format can only be set as png. All basic vnStat outputs are compatible, except for live traffic functions and the result image can be sent to a file or to a standard output.
features
The parameters to use with vnStati are:
- --altdate: Allows us to use an alternative text location of date and time. The text of the date and time will move from the upper right section of the header to the lower left corner.
- -c, - cache time: It allows us to update the output file if at least 5 minutes have elapsed since the previous file was updated.
- --config file: this file can be used for normal search functionality of configuration files.
- -d, --days: displays outbound traffic statistics daily for the past 30 days.
- --dbdir directory: we can use the database directory instead of using the directory specified in the configuration file or the default encoded in case no configuration file is available.
- --headertext text: allows us to display the text in the header section of the image instead of the automatically generated interface identification, this text is limited to 64 characters.
- -h, --hours: Displays outbound traffic statistics every hour for the past 24 hours.
- -hs, --hsummary: generates a summary of outbound traffic where hourly data is included using a horizontal design.
- -i, --iface interface: allows us to define the interface instead of the default or configured interface.
- m, --months: displays outbound traffic statistics monthly for the past 12 months.
- -nh, --noheader: this option removes the header containing the title and the update time.
- or, --output file: allows you to generate the png image in the file and we leave it, the output can be redirected to stdout by giving "-" as the file name.
- -style number: modify the content and style of the results.
- -s, --summary: generates a summary of outbound traffic statistics.
- -t, --top10: shows the results of the last 10 days of traffic
- -v, --version: display the vnStati version
- -vs, --vsummary: create a summary of outbound traffic where hourly data is included using a vertical layout.
- - ?, --help: display the help of the utility
1. Install vnStat and vnStati on Ubuntu 18.04
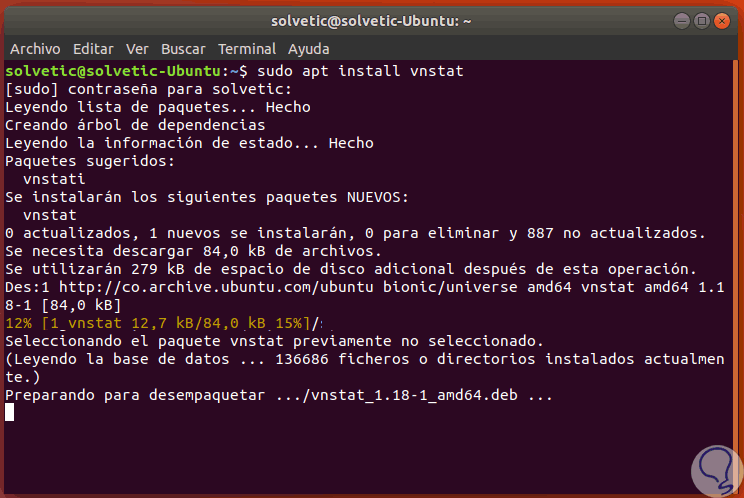
To carry out the process of installing these utilities we will execute the following commands. Once installed, we will validate if it has been installed correctly by entering "vnstat" and "vnstati" in the terminal. If everything is correct, no error should appear such as "vnstat not found" or "vnstati not found".
sudo apt-get install vnstat sudo apt-get install vnstati
2. Configure and run vnStat on Ubuntu 18.04
Once the installation is complete, vnStat must be configured because it does not start on its own automatically. vnStat must focus explicitly on which interfaces are to be monitored, for this we must start the vnStat "vnstatd" daemon, which starts vnStat and supervises all the time that the utility is not explicitly stopped.
Step 1
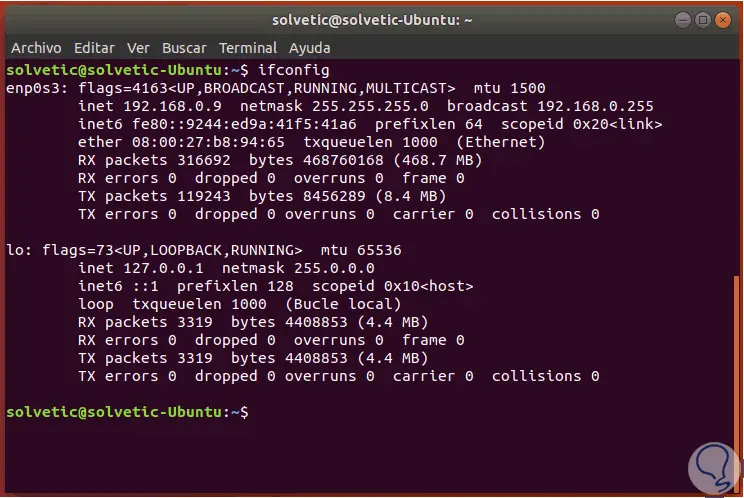
Before configuring vnstat, we must use “ifconfig†in order to verify the name of the network interface to be monitored, in case we do not have ifconfig it can be installed by running:
sudo apt install net-tools
Step 2
When executing "ifconfig" we will see the following:
Step 3
In this case the network interface is called "enp0s3". We will tell vnStat to monitor this interface by executing the following command:
sudo vnstat -u -i enp0s3

Step 4
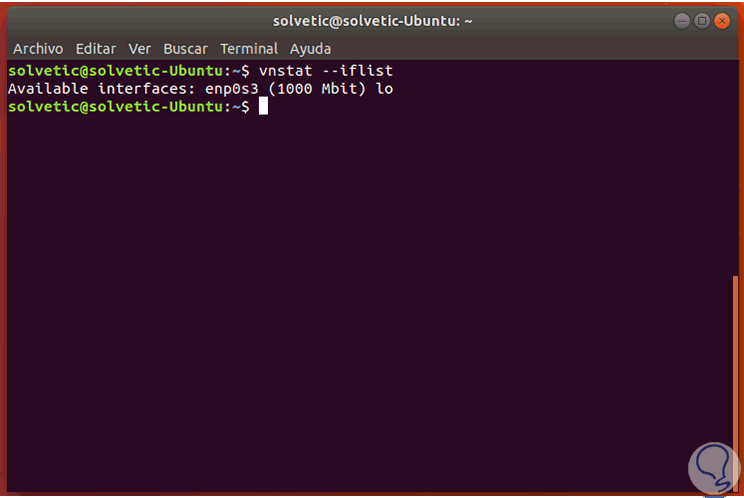
If we have more interfaces for monitoring, we must enter them one by one with the same syntax. If we want to see all the network interfaces available in the system, we can use the following command:
vnstat –iflist
Step 5
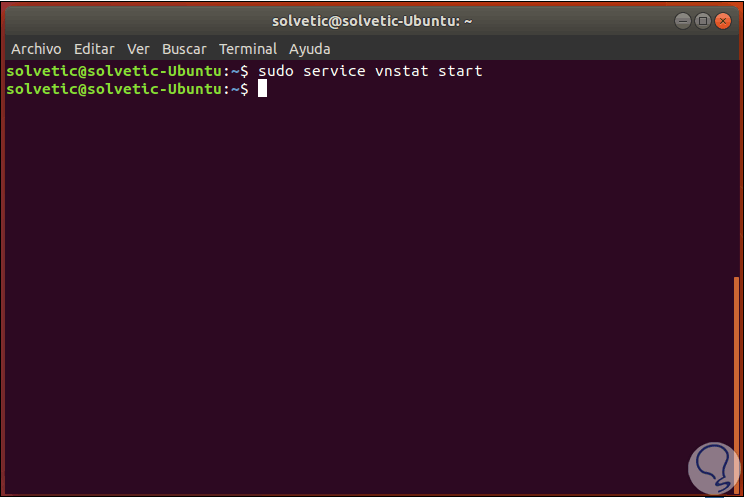
Once we have defined the interface, or interfaces to be monitored, we can start the vnStat daemon with the following command.
sudo service vnstat start
Step 6
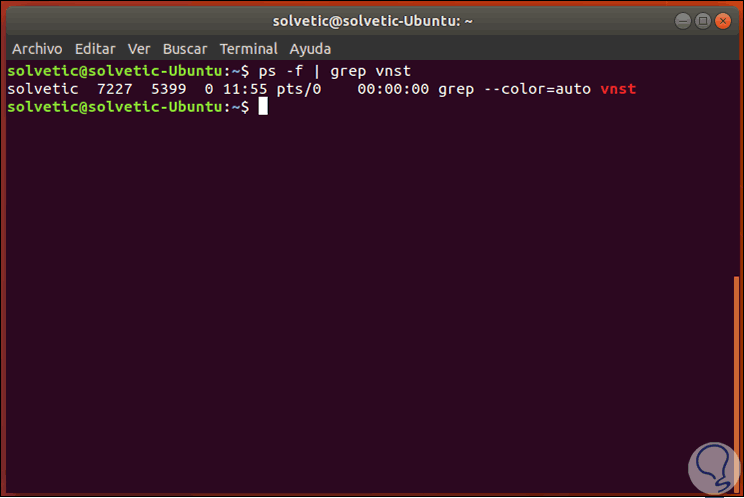
To verify if the daemon process is running, we will use the following command.
ps -f | grep vnst
3. Use vnStat in Ubuntu 18.04
Step 1
The most basic way to use vnStat is to open a terminal and execute the following command.
vnstat
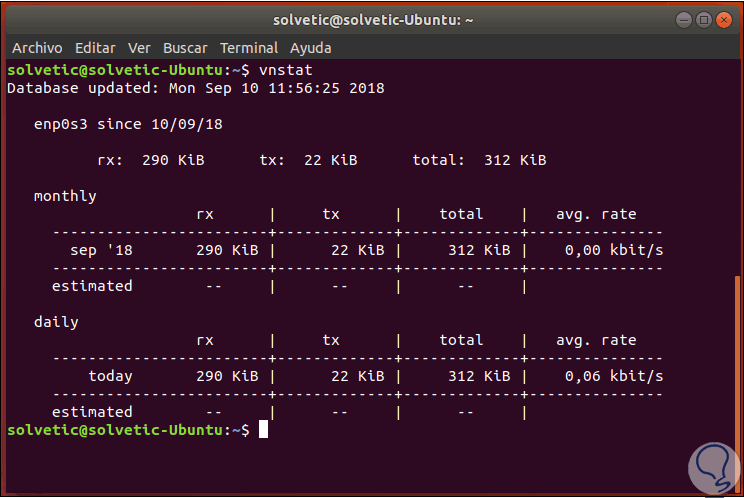
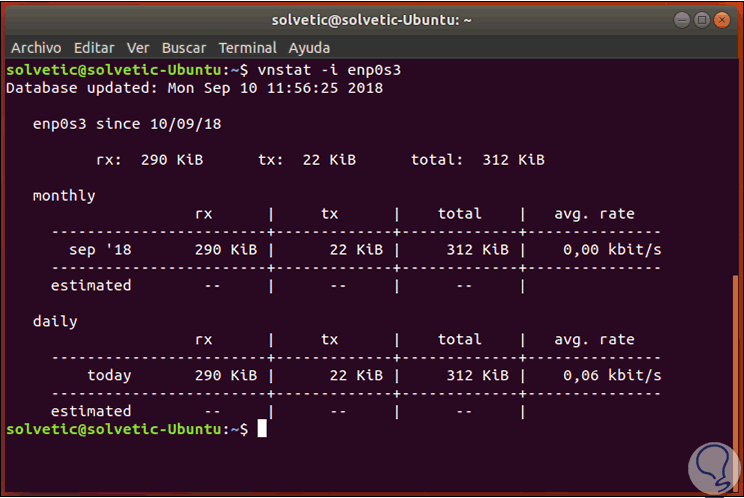
Step 2
There we can see a monthly and daily summary according to the usage time of vnStat. For a specific interface use, but with the basic information, it is possible to monitor specific network interfaces using the option "-i, in this case we execute the following:
vnstat -i enp0s3
4. vnStat options in Ubuntu 18.04
vnStat gives us the opportunity to carry out traffic monitoring in specific periods of time and for a particular interface if necessary.
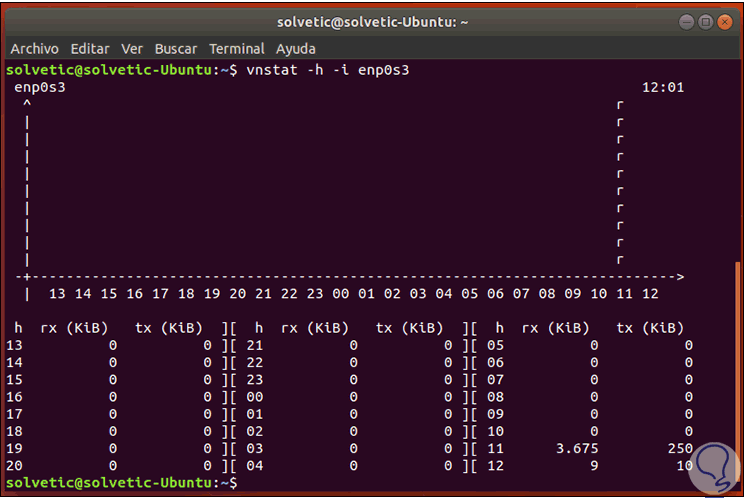
Hourly Statistics
vnStat allows us to see statistics per hour based on the form of a console graph which is composed of a table where the use of the last 24 hours is represented, for this we will use the "-h" option as follows:
vnstat -h -i enps03
Monthly statistics
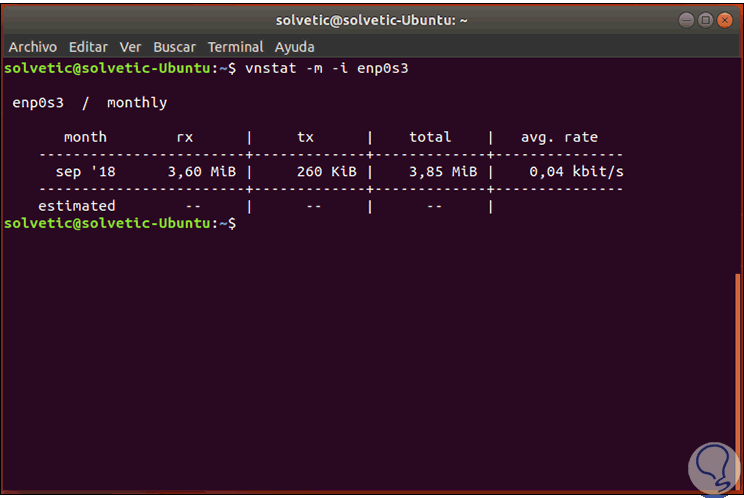
It will also be possible to have access to the information in monthly periods, in this case we will use the "-m" option to view the monthly statistics:
vnstat -m -i enp0s3
Monthly statistics
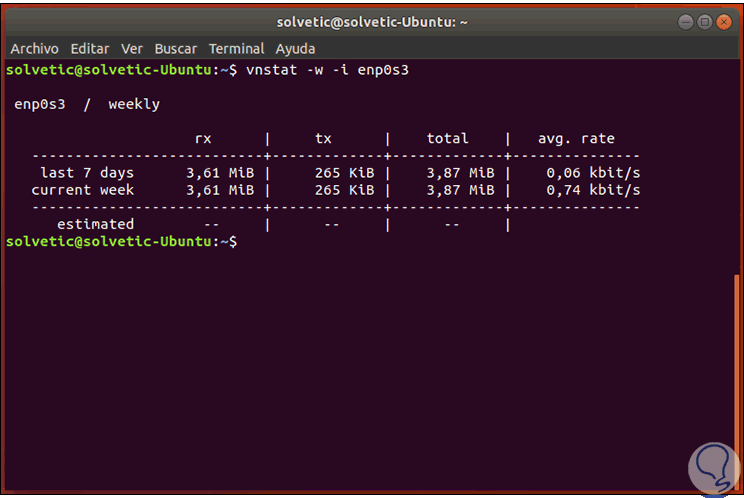
Now, if the objective is to visualize the statistics on a weekly basis, we will use the "-w" option for this purpose:
vnstat -w -i enp0s3
Last 10 most important statistics
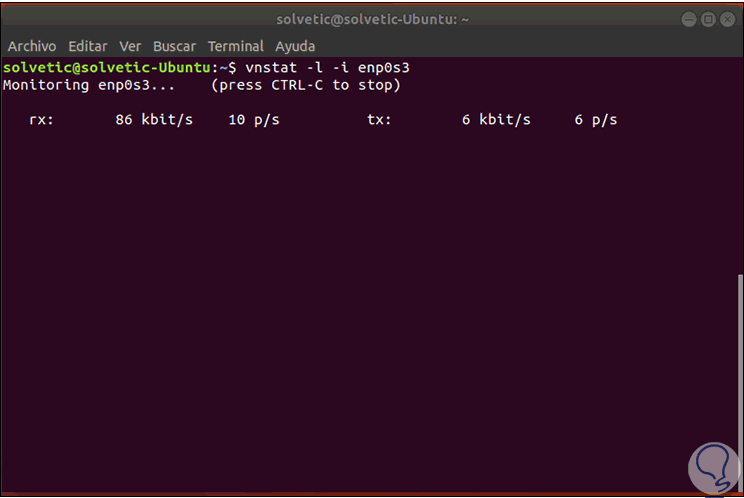
The use of real-time bandwidth can be monitored with the "-l" command and the 10 days of increased traffic can be monitored with the "-t" option, the commands to be used are:
vnstat -l -i enp0s3 vnstat -t -i enp0s3
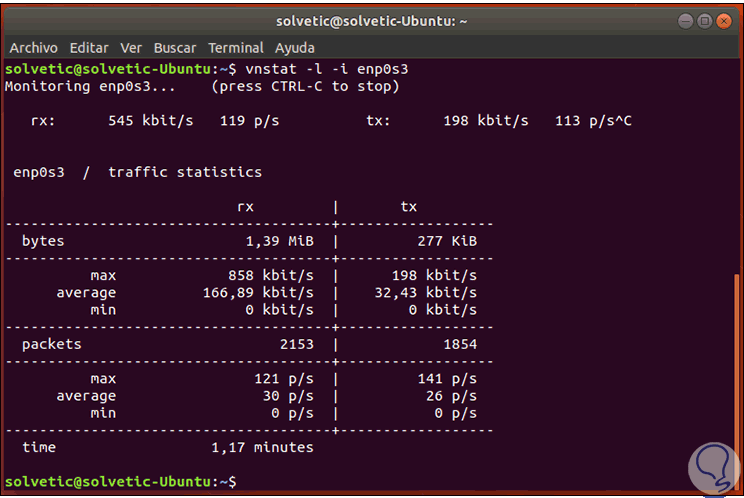
We stop the monitoring with the following keys and when doing this a summary will be displayed with everything that happened at the network level in the selected interface:
+ C Ctrl + C
5. Use vnStatati in Ubuntu 18.04
Step 1
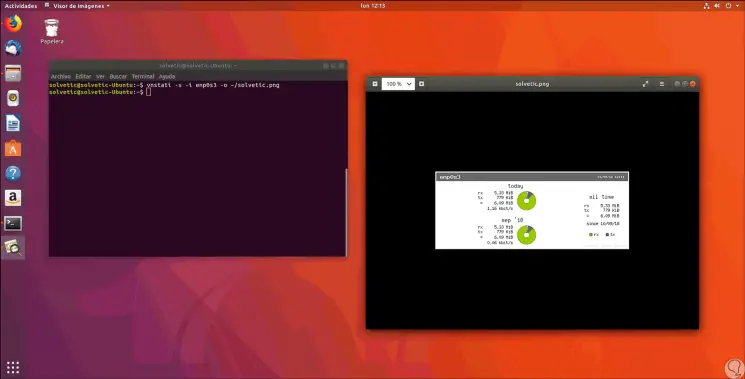
Recall that vnStati allows us to obtain the results graphically, to access the result of a single interface, we can use the "-s" option, in the same way we will use the "-o" option to specify where the output file will be stored, In this case we will save the result as an image called solvetic.png in the home folder, the command to use will be:
vnstati -s -i enp0s3 -o ~ / solvetic.png
Step 2
We can see the execution of the command and the image that saves the command with the respective results:
Step 3
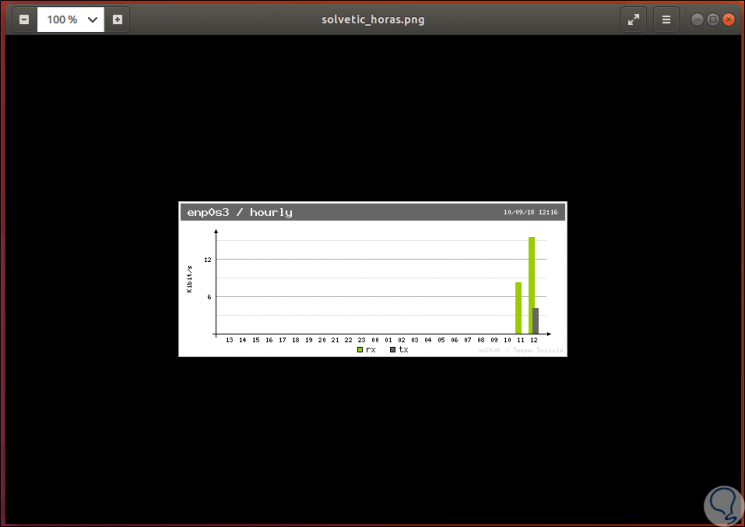
If you want these results for hours, we will use the -h parameter like this:
vnstati -h -i enp0s3 -o ~ / solvetic_horas.png
We can see how these utilities give us complete and real-time results that will be useful to carry out the specific administration tasks on the network interfaces used in Ubuntu, or in any Linux distro, to have a centralized management on these..