To stay up to date, remember to subscribe to our YouTube channel!
SUBSCRIBE ON YOUTUBE
When we connect to a website or make use of a network service, numerous processes and services come into play that will make the communication successful and to ensure that everything is viable, the Firewall is available. This firewall is made up of a group of input and output rules where incoming and outgoing packets are analyzed to validate their integrity and thus determine whether or not it is trustworthy. In addition to this, TechnoWikis will teach you some extra methods to make everything work in the best way and for this reason we will talk about two essential utilities such as nmap and tcpdump..
Nmap (network mapper) is developed as a utility for network scanning and security probing directly on ports, it is ideal for network scanning and security auditing tasks. To understand its use a bit, Nmap is responsible for using raw IP packets (without content) in order to determine which computers are available on the network, additionally it can validate which services (application name and version) are hosted on them and view your operating system, have access to packet filters or firewalls, and a few more features.
functions
Some of the most outstanding features of Nmap are:
- It can be used on Linux, Windows, FreeBSD, OpenBSD, Solaris, macOS and many more.
- Specification of ports and scan order.
- Operating system detection.
- Time and performance of each host.
- Destination specification.
- Full or partial network scan if necessary.
- Generate reports in formats such as plain text, XML or HTML.
- Stealth scanning function, that is, scanning is carried out in stealth mode (stealth) or serial port scanning is used, this to avoid being detected by security devices and firewalls that are active at the destination.
- Parallel scanning which allows multiple packets to be sent simultaneously helping to optimize scanning.
- It allows the user to make use of scripts in order to automate tasks and perform advanced scans on the destination.
parameters
Some general Nmap parameters are:
- -iL <input_file> : will read a list of systems from the file
- -iR <number of systems>: select targets randomly
- -sL: List probe: makes use of the list of targets to scan
- -sP: Ping Probe: allows to determine if the target is alive
- -P0: Assume all targets are alive
- -PS/PA/PU [portlist]: Run a TCP SYN, ACK, or UDP scan of the ports specified by the user
- -PE/PP/PM: does an ICMP analysis of the type echo, date stamp and netmask
- -n/-R: Do not perform DNS resolution
- -sS/sT/sA/sW/sM: perform a TCP SYN/Connect()/ACK scan
- -sN/sF/sX: perform a TCP Null, FIN, and Xmas scan
- --scanflags <flag>: allows us to specify the TCP flags that we are going to use
- -p <port range>: allows a scan of the indicated ports
- -F: perform a scan of the ports listed in the nmap-services file
- -r : scan ports sequentially
- --osscan-limit: limit the detection of the operating system
- -A: enable OS and version detection
Now, tcpdump is a command line packet analyzer which uses libpcap which is a portable C/C++ library, which allows capturing network traffic, this tool can capture and display packets traveling on a specific network interface , all this analysis is done in real time..
Characteristics
Some of its most outstanding features are:
- Allows real-time network traffic analysis.
- It supports complex capture expression filters by making use of libpcap's built-in filter expression syntax.
- Allows you to save the packet capture to a file for support and management purposes.
- It offers detailed information about each captured packet, this covers its source and destination IP address, ports, protocol, packet size, and more details.
- It allows filtering and displaying only the packages that meet the criteria defined by us as users.
- It is in the ability to capture packets based on its own filters such as the use of source and destination IP addresses, ports and more.
tcpdump Parameters
Some of the parameters that we can use with tcpdump are:
- -A: prints each captured packet.
- -B : Displays the size of the buffer.
- -c (count): is responsible for counting the number of packets detected.
- --count: only print the packet count when reading the capture files instead of parsing these packets.
- -d – Generates the compiled package matching code in a human-readable format.
- -e: prints the link layer header of each packet.
- -f Prints IPv4 addresses numerically but not symbolically.
- -i interface: allows defining the interface to analyze.
- -I (--monitor-mode): Sets the interface to "monitor mode" and applies to IEEE 802.11 Wi-Fi interfaces.
- -K – Do not verify IP, TCP, or UDP checksums.
- -m module – Loads the SMI MIB module definitions using the module file.
- -n: do not convert addresses.
Without further ado, TechnoWikis will explain how to use these two tools to analyze the state of the firewall in Linux and we will use Ubuntu.
How to check firewall with Nmap and Tcpdump
Step 1
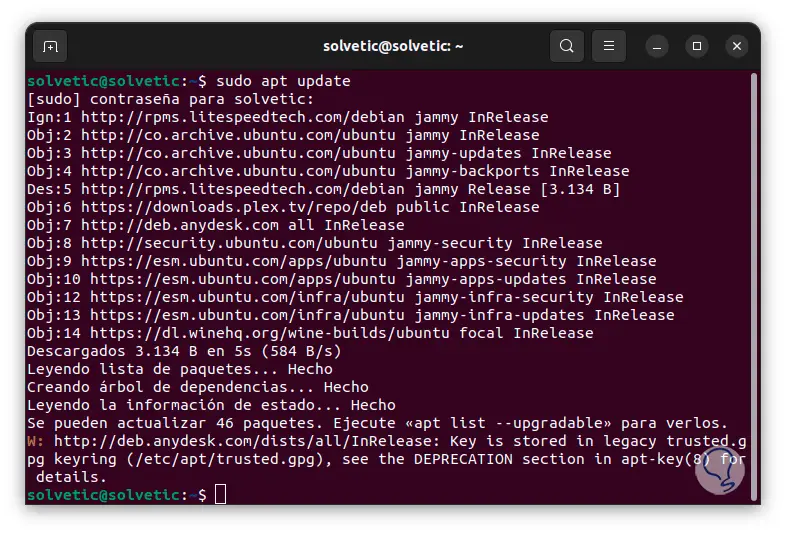
We are going to open the terminal and update the system with the following command:
sudo apt update
Step 2
After this we are going to install the necessary utilities with the following command:
sudo apt install tcpdump nmap
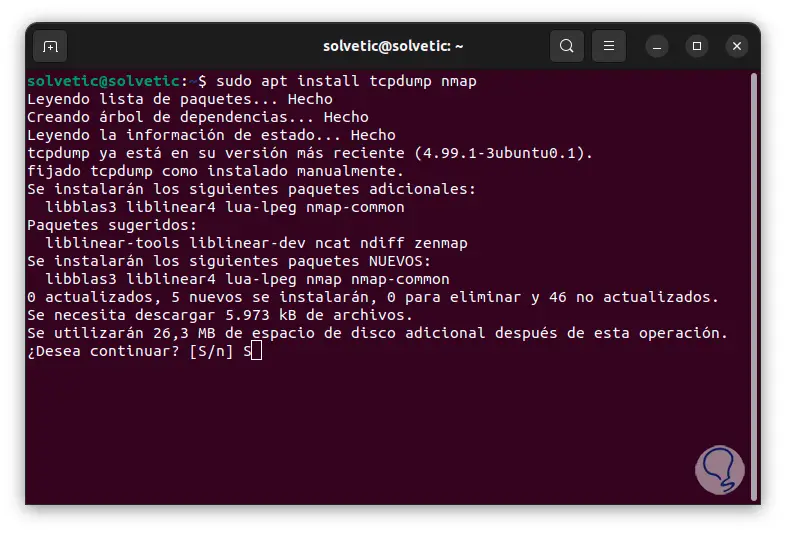
Step 3
We enter the letter S to confirm this process:
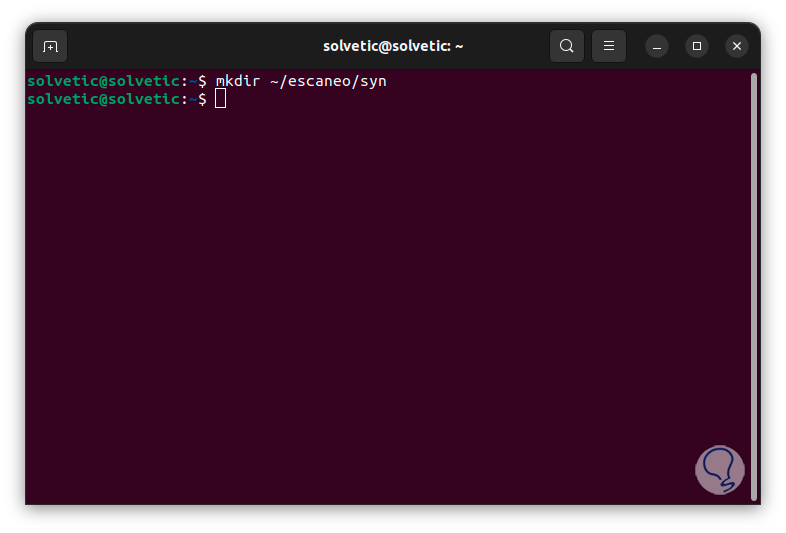
Step 4
Now we are going to create the directory where the results of the analysis will be saved, we will use the following command:
mkdir ~/name

Note
If it is being used to analyze various computers, TechnoWikis recommends that you close open SSH sessions or HTTPS activities.
step 5
Now we are going to scan the computer to search for open TCP ports, first we are going to create another directory inside the previous one for the first analysis:
mkdir ~/(name)/name
step 6
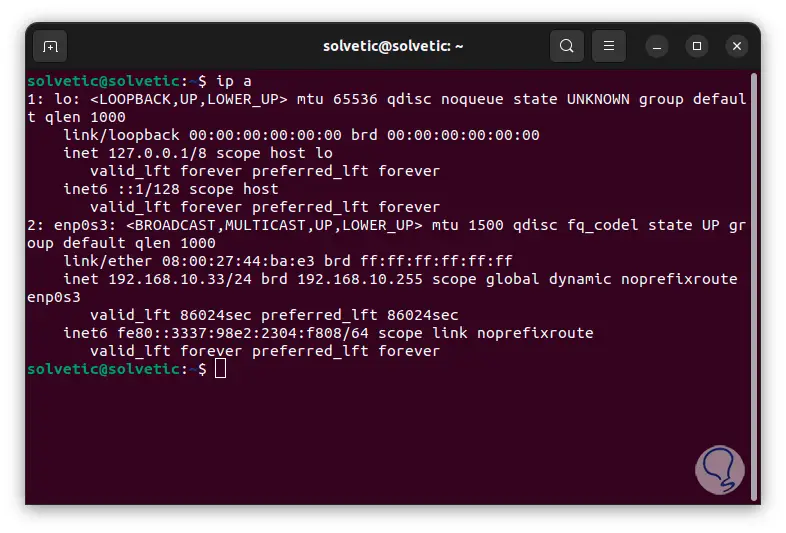
Now we are going to execute the “ip a” command to know the IP of our computer or the destination computer:
step 7
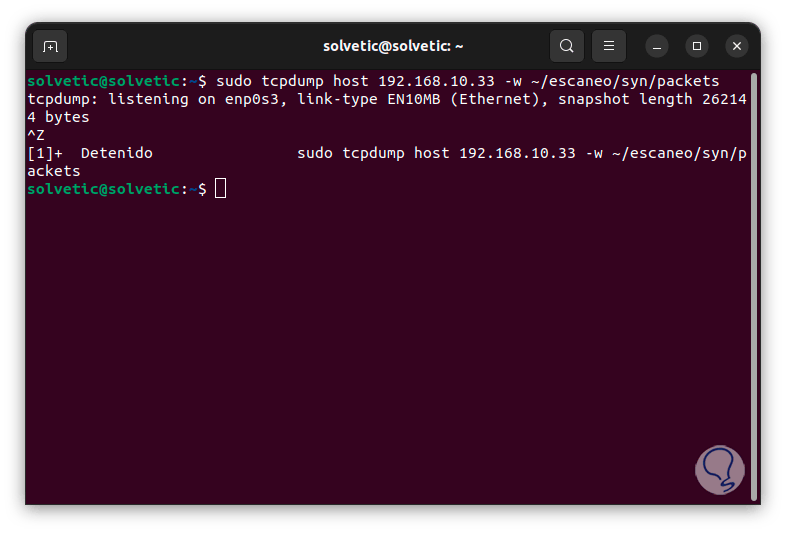
Now we are going to use the SYN scan which is a scan that does not do a complete negotiation with the destination, for this we execute the following:
sudo tcpdump host host_ip -w ~/name/name/packets

step 8
By default tcpdump will be executed in the foreground, if this is not required we can pause this process with the following keys:
Ctrl + Z
step 9
Then, if necessary, we execute "bg" so that it runs in the background.
step 10
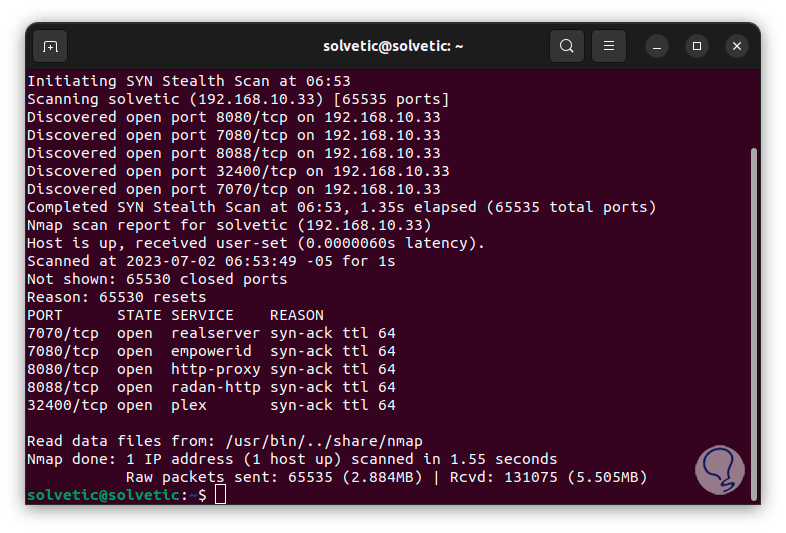
Now we are going to carry out the SYN scan, for this we are going to execute the following:
sudo nmap -sS -Pn -p- -T4 -vv --reason -oN ~/name/name/nmap.results host_ip
9
step 11
We have used the following parameters:
- -Pn – Allows bypassing host discovery
- -p-: by default a SYN scan validates the 1000 most used ports, with this command nmap will check all available ports
- -T4: sets a time profile for nmap, value 0 is slowest and 5 is fastest
- -vv: improves the verbosity of the output
- --reason: allows nmap to tell us the cause of a port state
- -oN: write the results to a file
step 12
We can see the total result of the command. We see the port, status, detected service and reason.
step 13
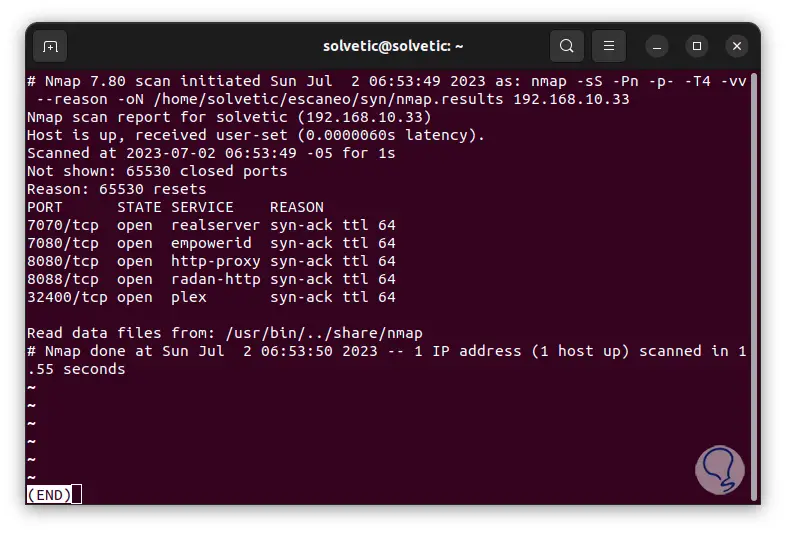
We analyze the results of this test with the command:
less ~/name/name/nmap.results
step 14
We can see that 65530 ports were closed, we found the destination IP, the time used and more.
step 14
Some commands that we can use are the following.
- To view real-time traffic (if applicable):
sudo tcpdump -nn -r ~/name/name/packets | them
sudo tcpdump -nn -r ~/name/name/packets 'dst host_ip' | them
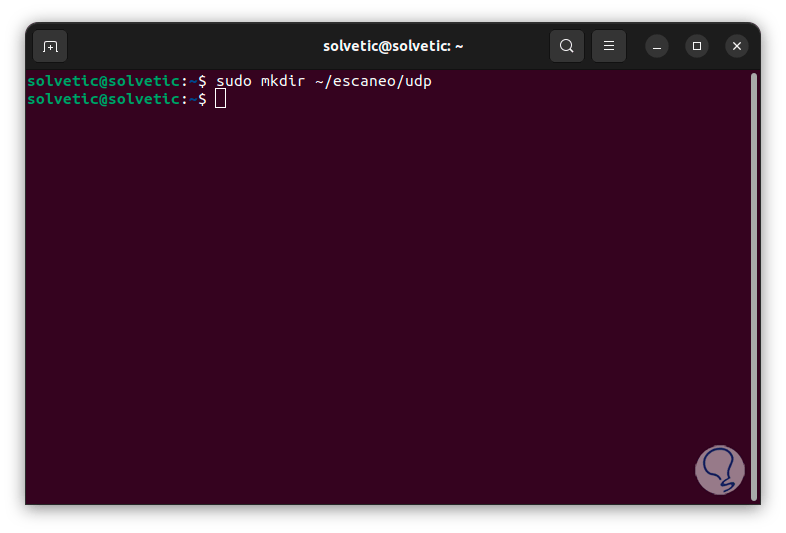
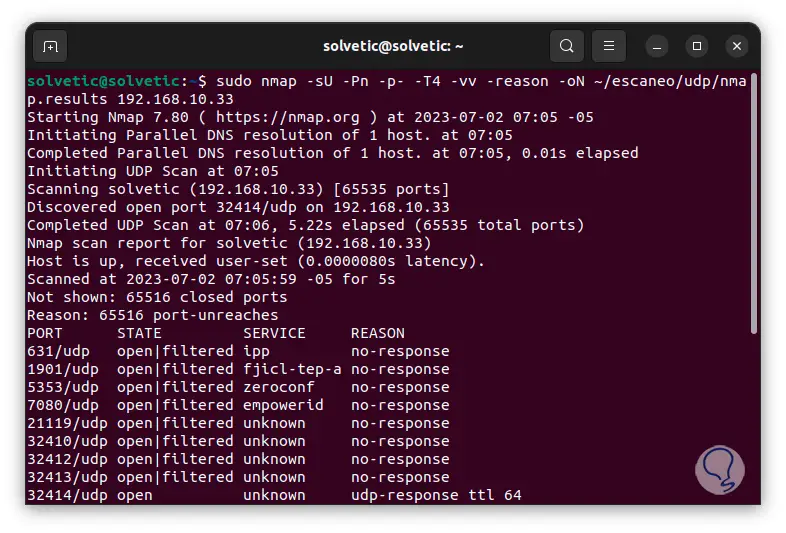
- Now we are going to review the UDP ports, first we are going to create the directory using the following syntax:
mkdir ~/name/udp
step 15
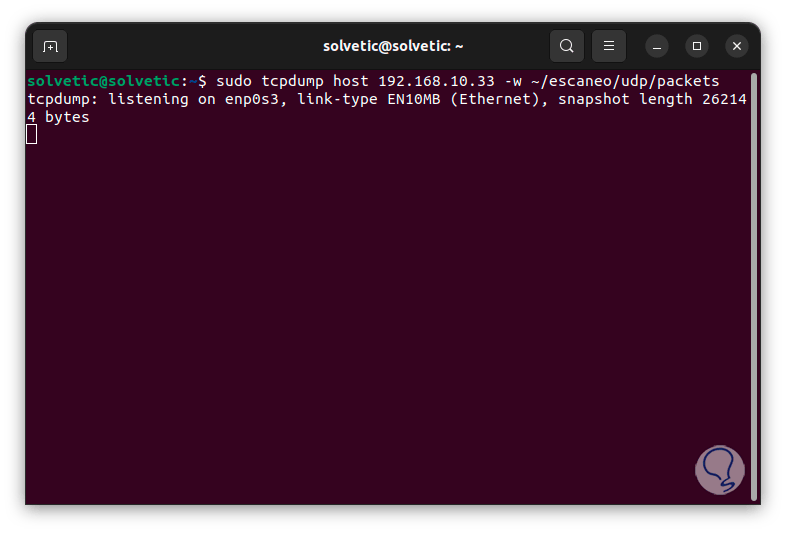
Now we are going to execute the following command to analyze everything related to UDP taking into account the destination IP:
sudo tcpdump host computer_ip -w ~/name/udp /packets
step 16
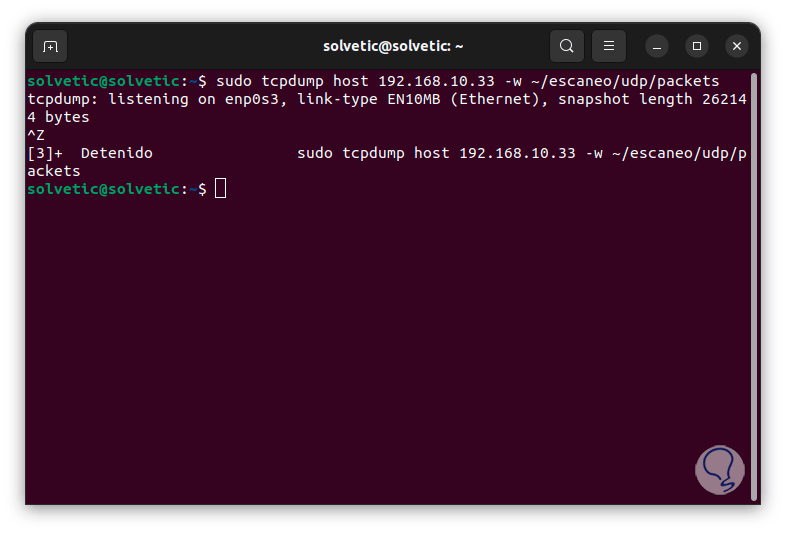
We stop this process with the keys:
Ctrl + Z
step 17
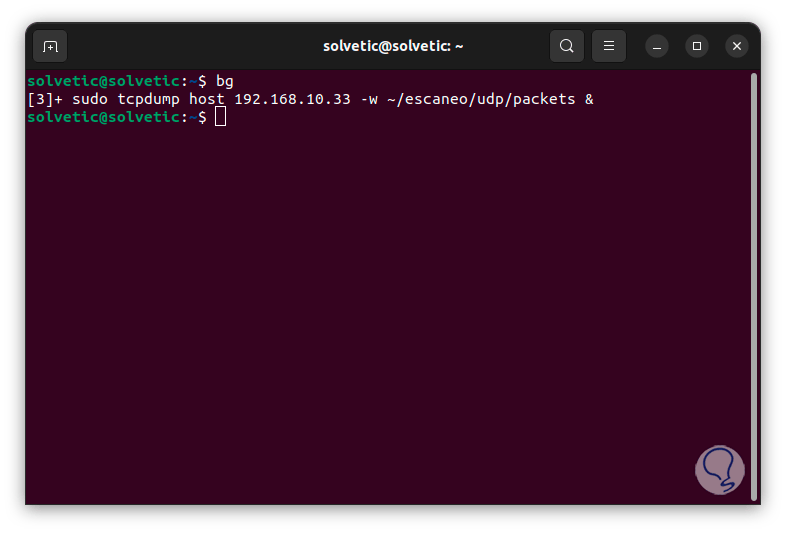
We allow it to run in the background with “bg”:
step 18
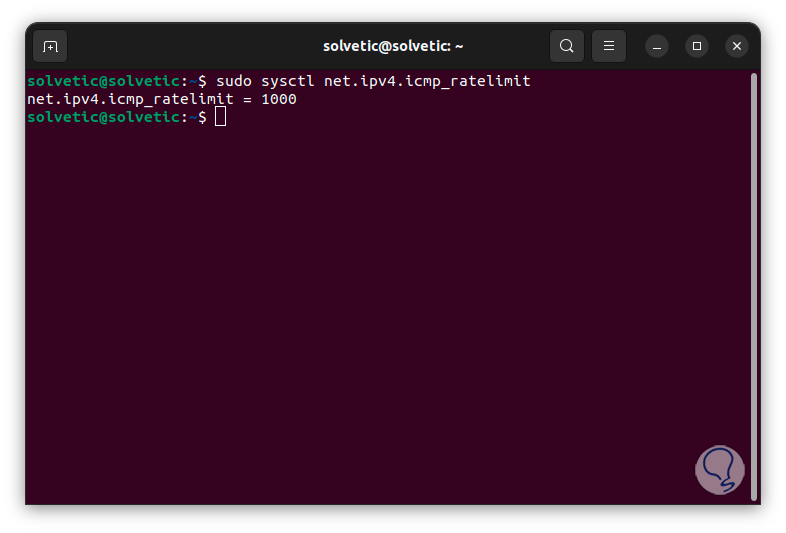
Keep in mind that the UDP analysis can take too long due to the number of existing ports, this is because UDP is a connectionless protocol, to reduce the speed and the scanning time we will check the time range of the parameter with the following command:
sudo sysctl net.ipv4.icmp_ratelimit
step 19
We are going to disable this value by setting its value to 0 with the following command:
sudo sysctl -w net.ipv4.icmp_ratelimit=0

step 20
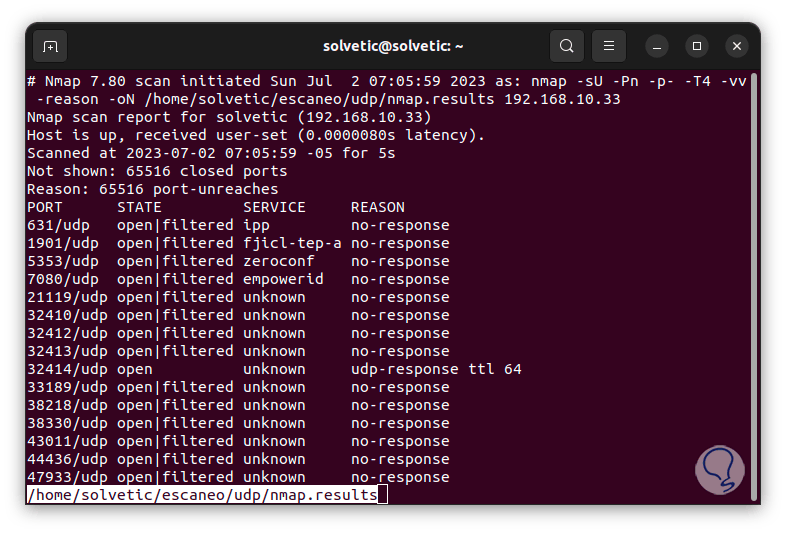
Now it will be possible to run the test with the following command:
sudo nmap -sU -Pn -p- -T4 -vv --reason -oN ~/name/udp /nmap.results host_ip
step 21
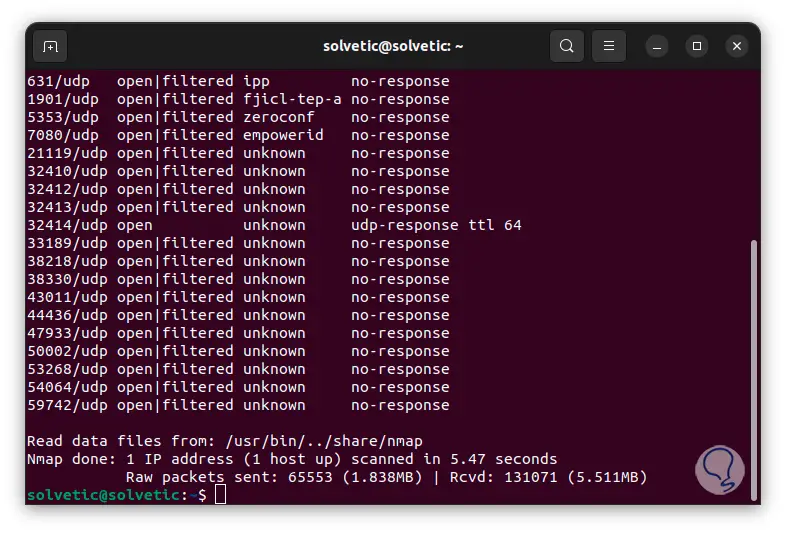
We go to the bottom to see all the results. We see the number of ports detected, number of devices detected, time used and more.
step 22
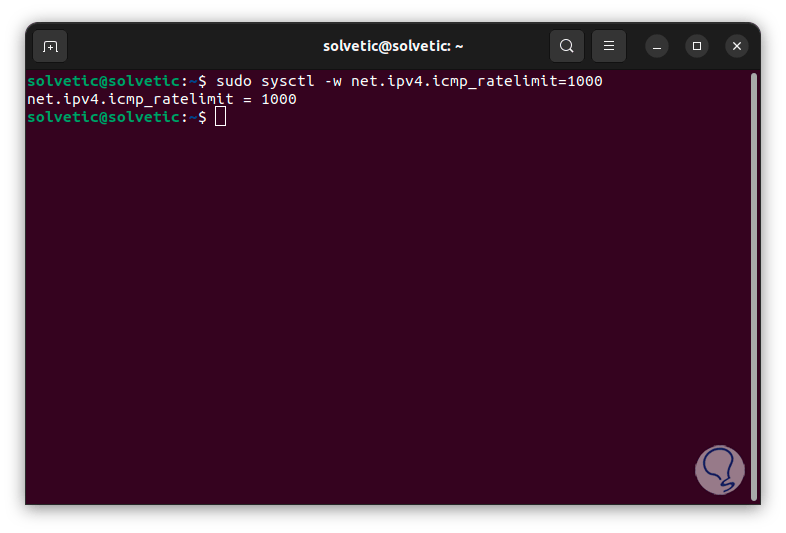
After this we are going to reset the parameter values again using the following command:
sudo sysctl -w net.ipv4.icmp_ratelimit=1000
Step 23
We set UDP to the foreground with the “fg” command and end the process with:
Ctrl + C
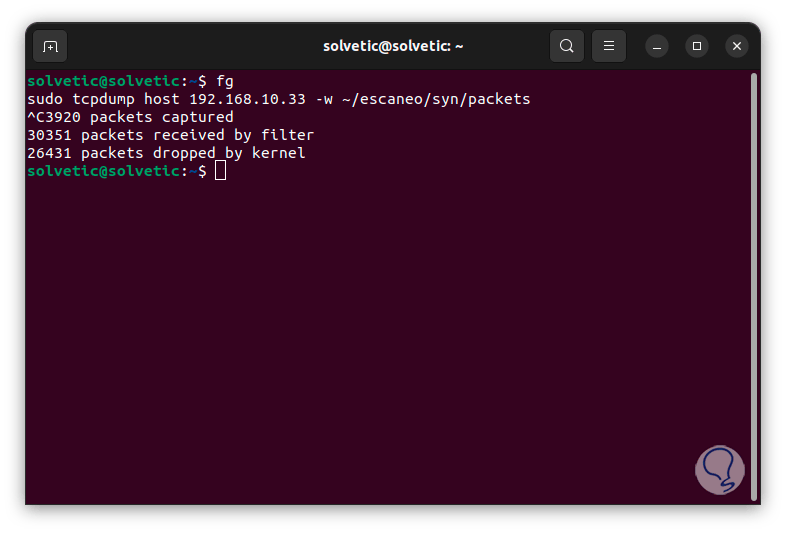
step 24
We will access the results with the command:
less ~/name/udp/nmap.results
step 25
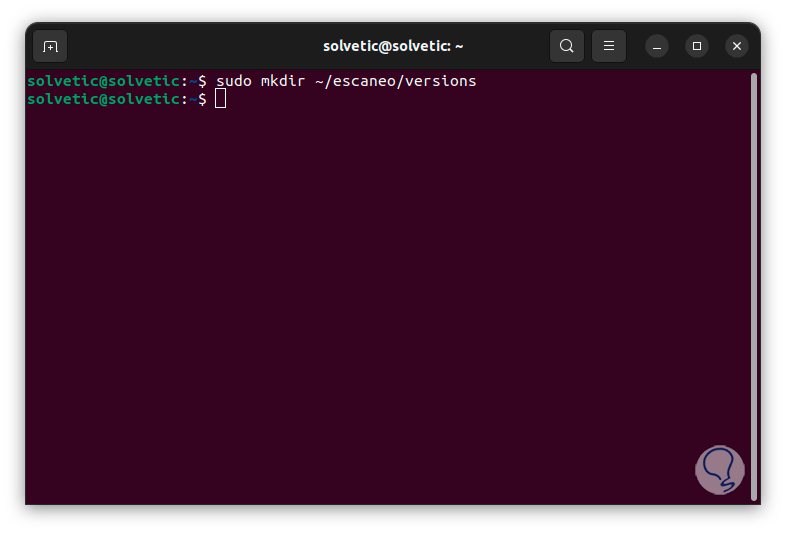
It is time to create a directory to store the services and hosts:
Step 26
Now we are going to execute the following command indicating the ports to use for the analysis:
sudo nmap -sV -Pn -p 22.80 -vv --reason -oN ~/name/versions/service_versions.nmap host_ip
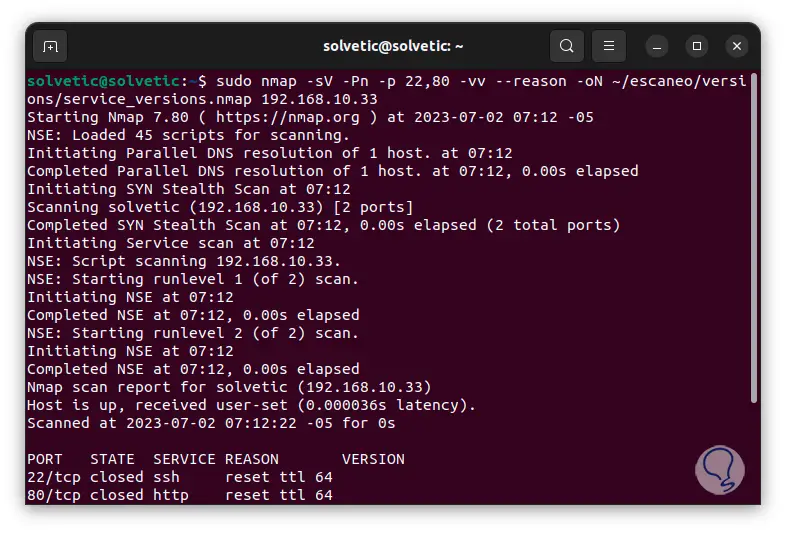
Step 27
We see the complete results of the analysis:
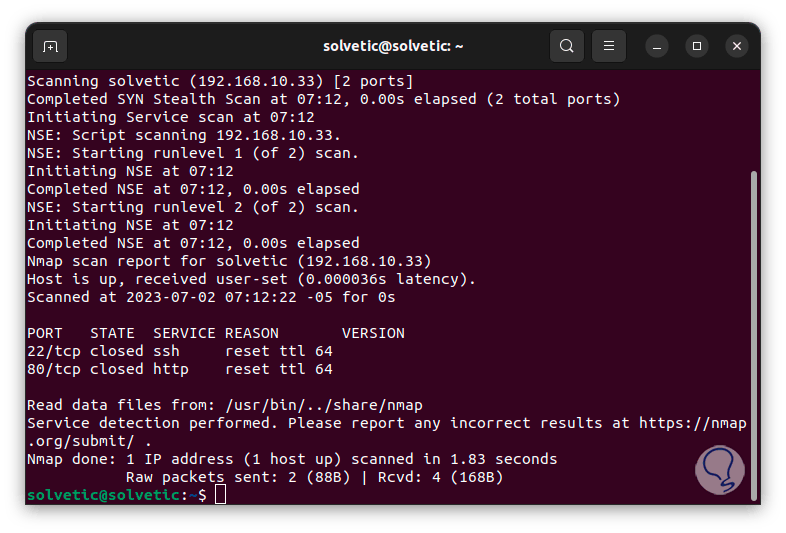
Step 28
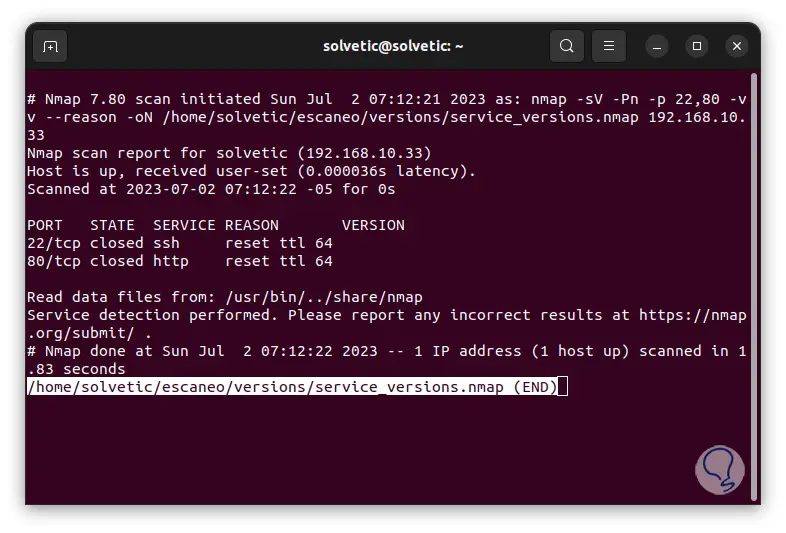
We see there the type of service detected and its status, we will access the results with the command:
less ~/name /versions/service_versions.nmap
Step 29
We are going to execute the following command to access the operating system versions on the target computer:
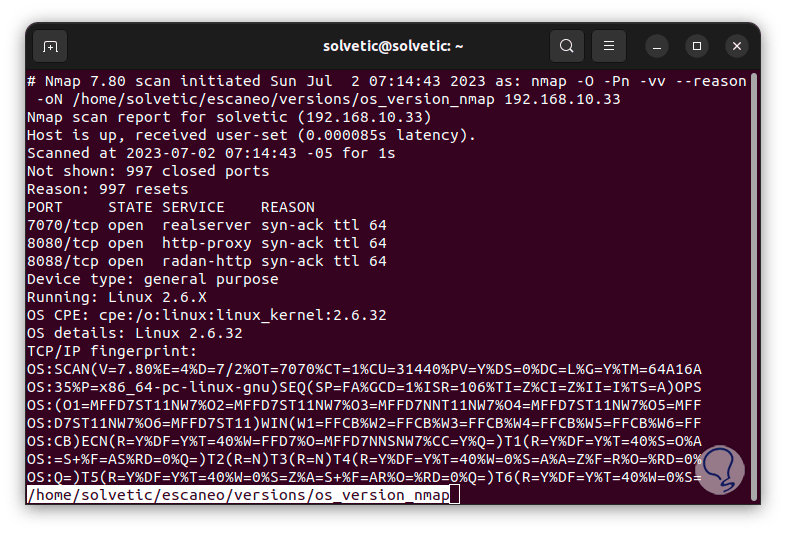
sudo nmap -O -Pn -vv --reason -oN ~/name/versions/os_version.nmap host_ip
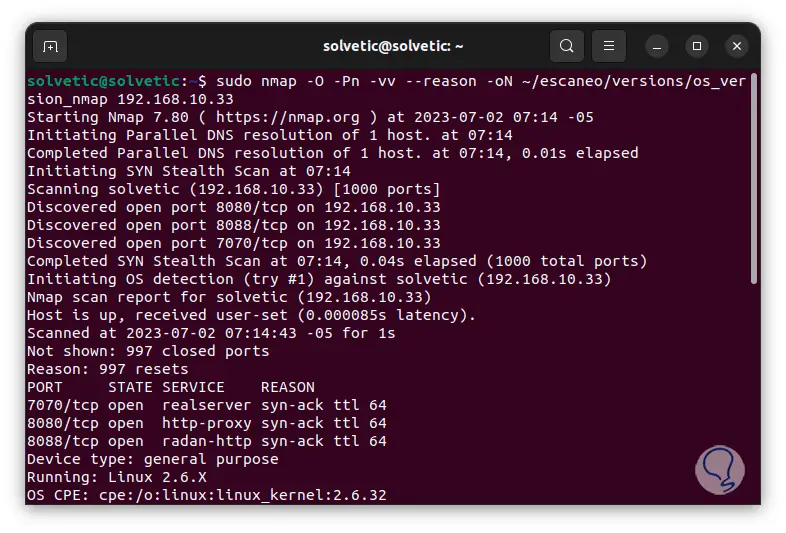
step 30
We go down a bit to see the totality of the results:
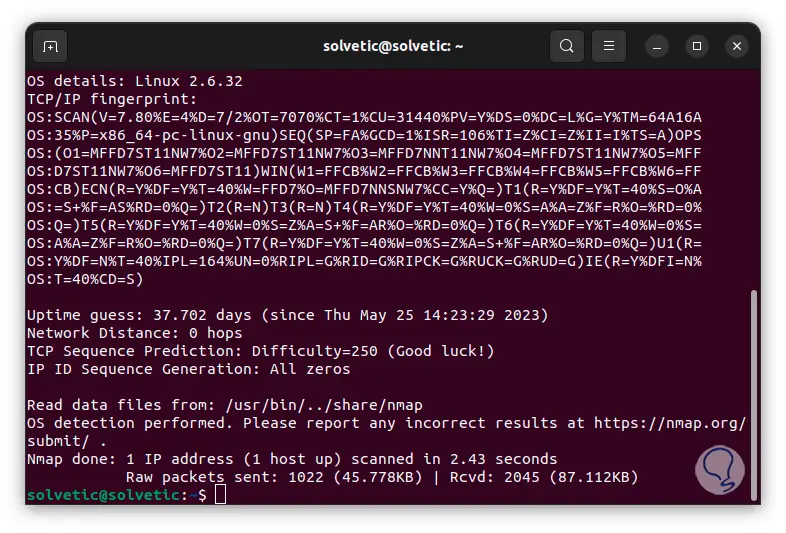
step 31
We access the results with the command: There we find the detected operating systems.
less ~/name/versions/os_version.nmap
step 32
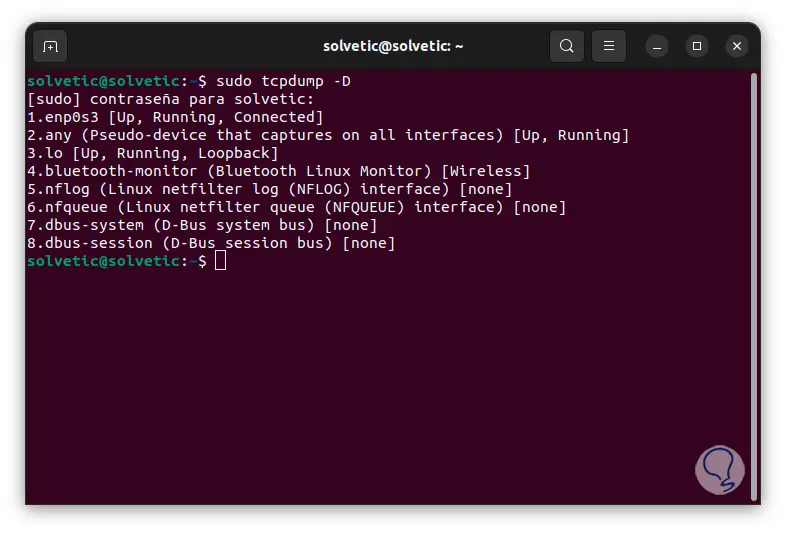
Some other options for using tcpdump are as follows. To see a list of devices where we can capture data we use the command:
sudo tcpdump -D
Step 33
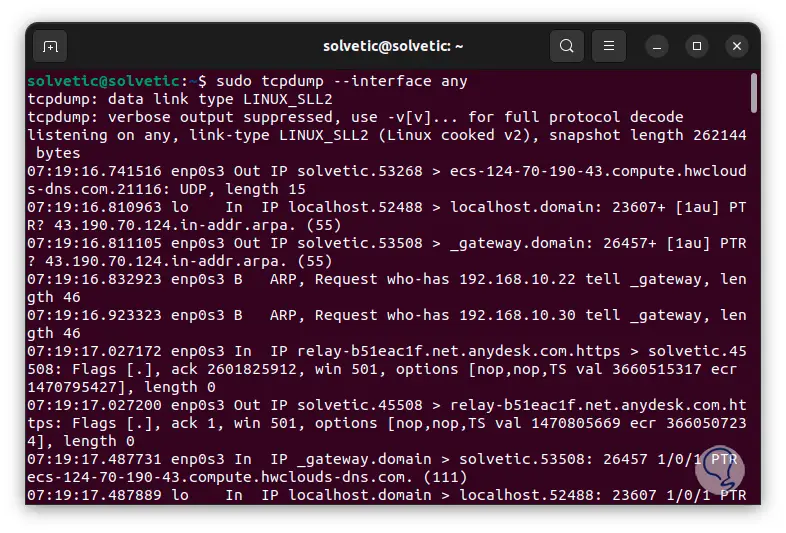
To list all the available interfaces we execute:
sudo tcpdump --interface any
Step 34
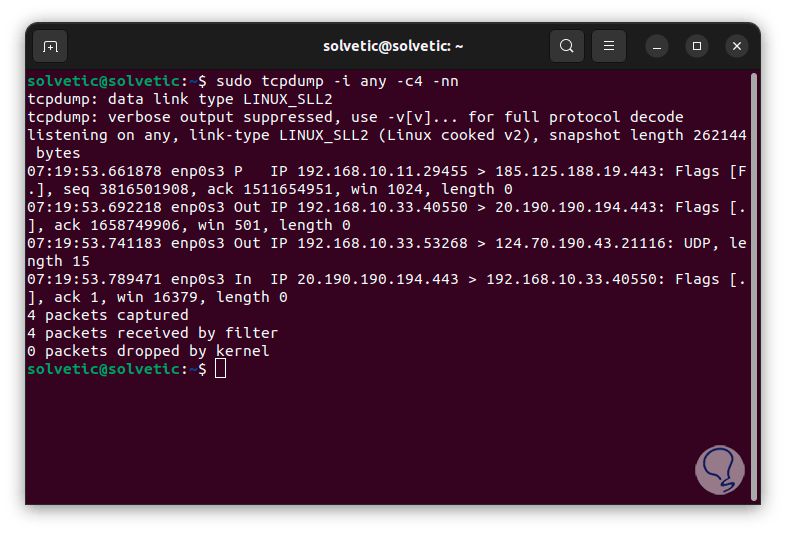
we can capture X number of packets before stopping analysis on any interface:
sudo tcpdump -i any -c# -nn
This is how these two utilities will be reliable and practical to see the status of the firewall in Linux..