The hard drive in Windows 10/11, and in any operating system and PC, is an essential part of it since the operating system itself, programs and applications are installed on it and it serves as a backup medium for multiple tasks and it is essential that The hard disk has optimal performance since data reading and writing tasks are carried out through it..
If the disk is not optimal we can notice slowness in the performance of Windows, TechnoWikis will explain in this tutorial how to use Diskspd to perform a performance test on the computer and thus determine its status in real time and take the necessary administrative measures. That is why it is always quite interesting to have options and tools that allow us to repair Windows 11 disk errors and prevent us from not being able to use the hard disk.
To stay up to date, remember to subscribe to our YouTube channel!
SUBSCRIBE ON YOUTUBE
How to check hard drive performance with Diskspd
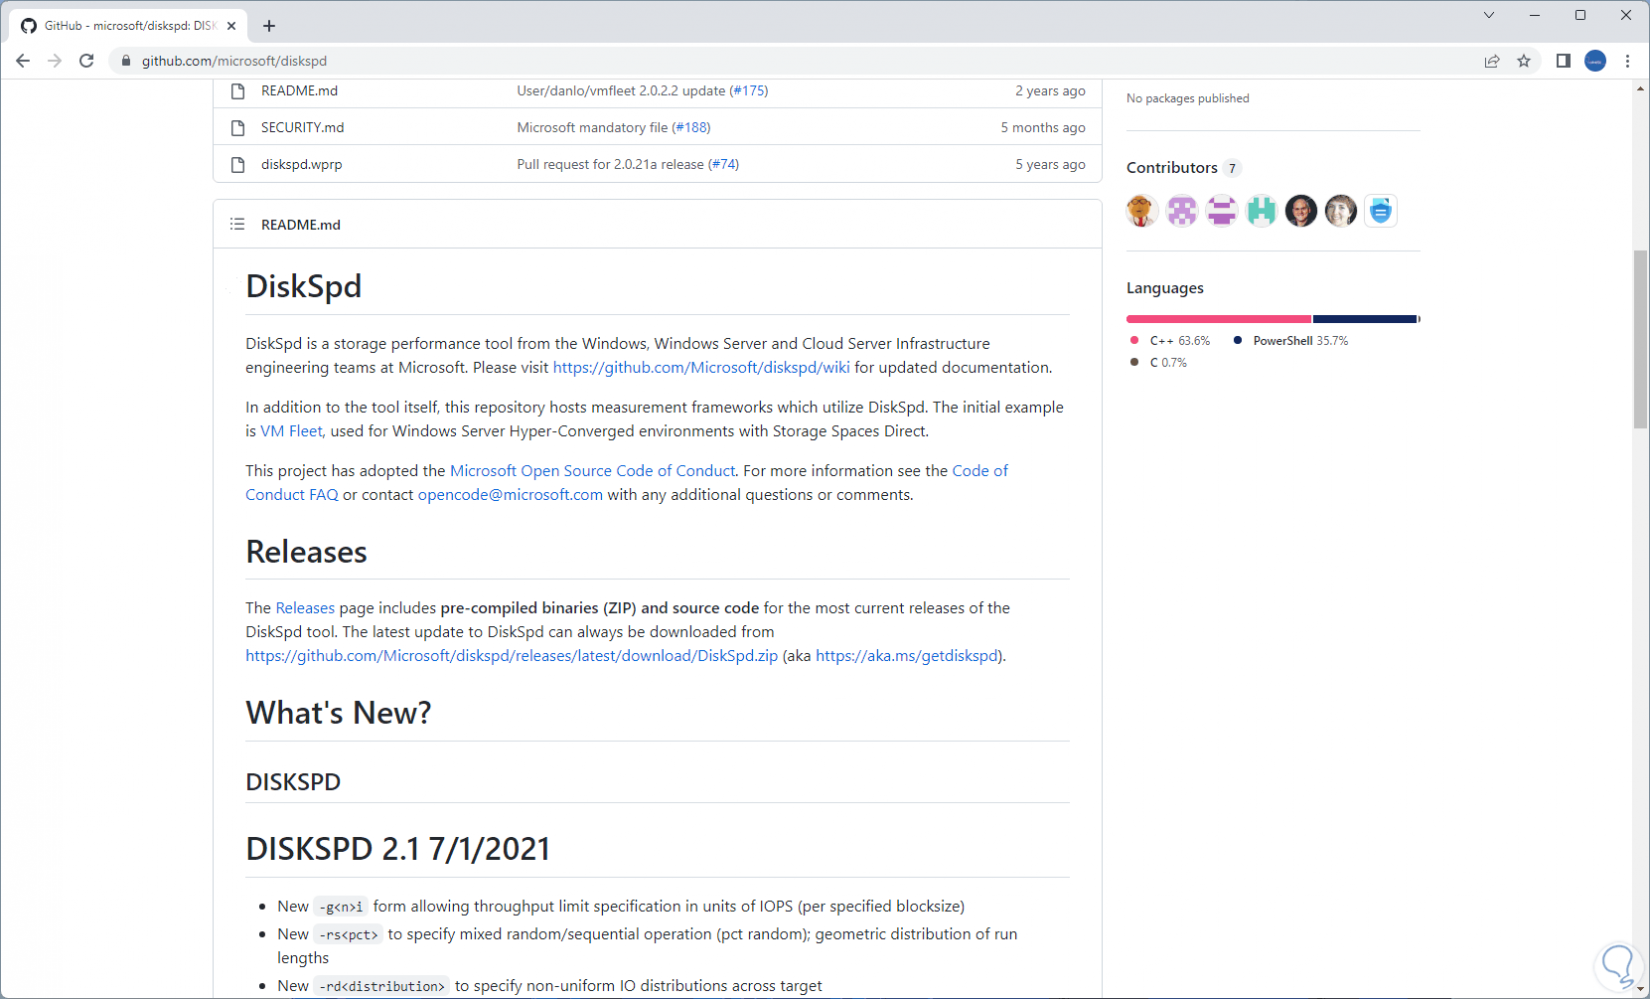
Diskspd has been developed as a command line utility which creates I/O (Input/Output) that allow a series of comparative tests to be carried out to see the current state of the hard disk, one of its advantages is that we can customize the criteria for execution for a custom result.
Step 1
Its download is available at the following link. Download the utility from the Releases line.
diskspd
Step 2
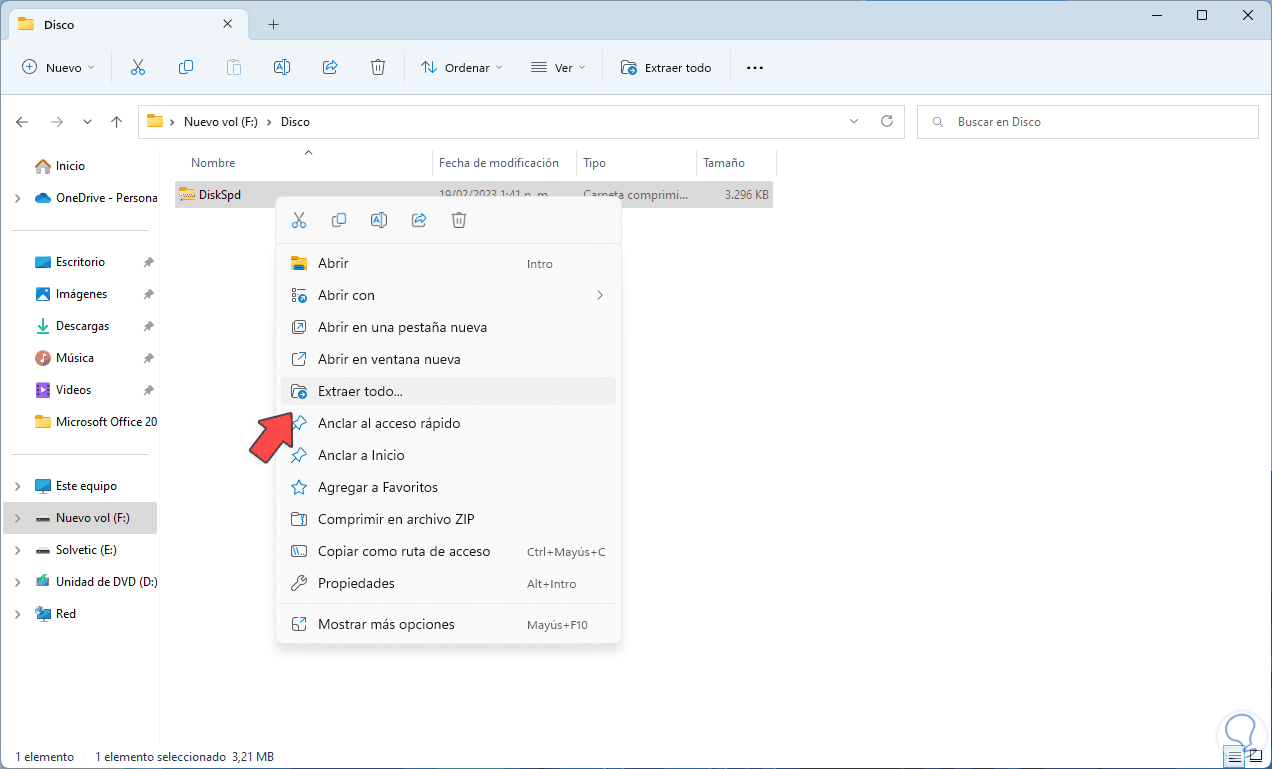
In the downloaded folder we extract the file by right clicking and selecting "Extract all":
Step 3
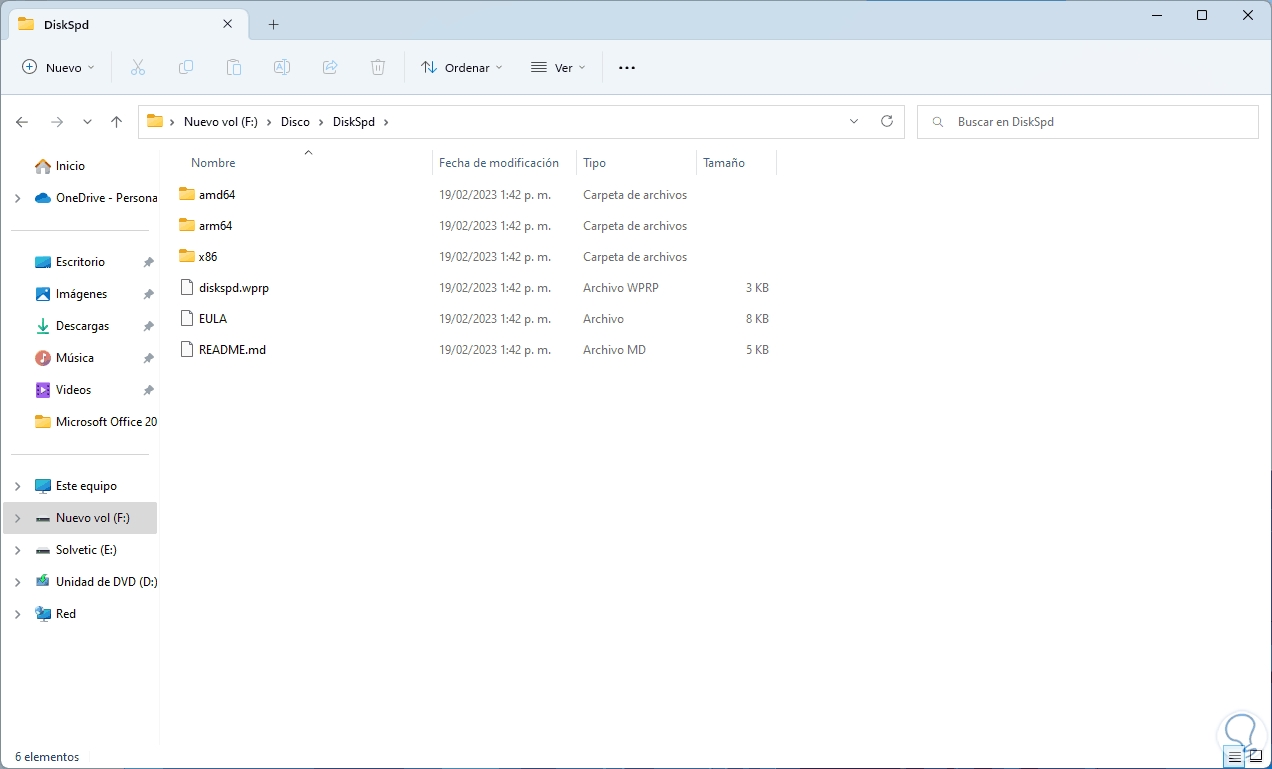
We will see the following:
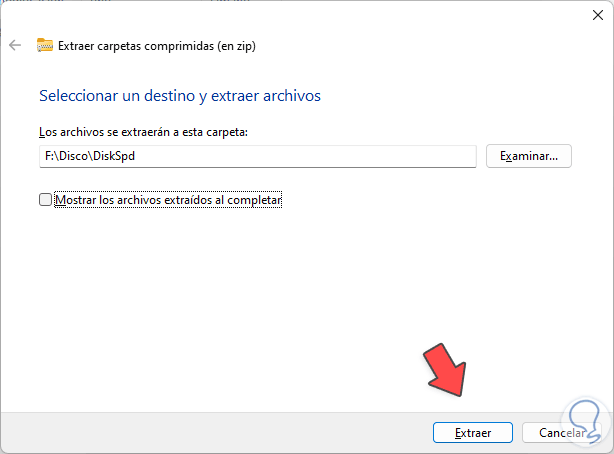
Step 4
We define where the content will be extracted:
step 5
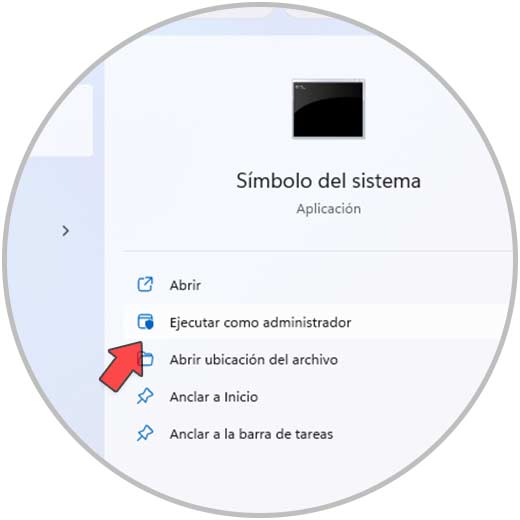
Open CMD as administrator:
step 6
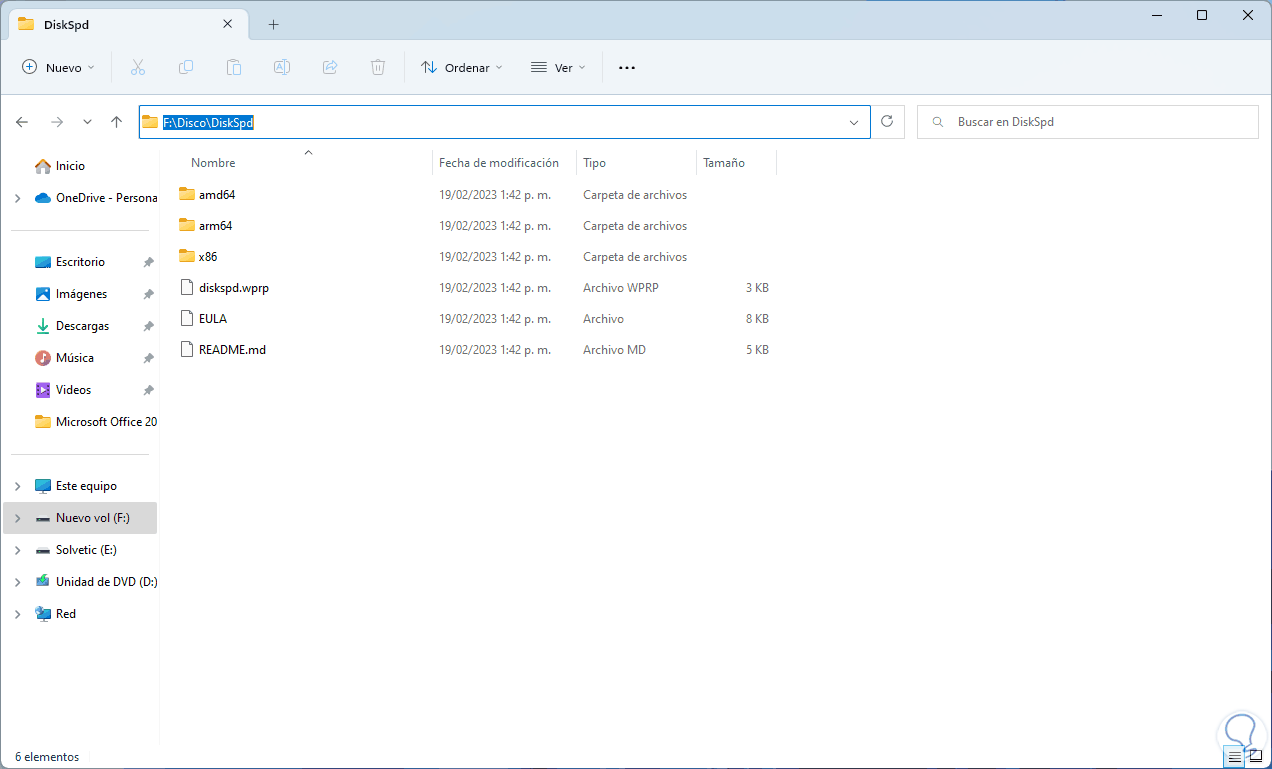
We must keep in mind the path where the Diskspd utility has been extracted:
step 7
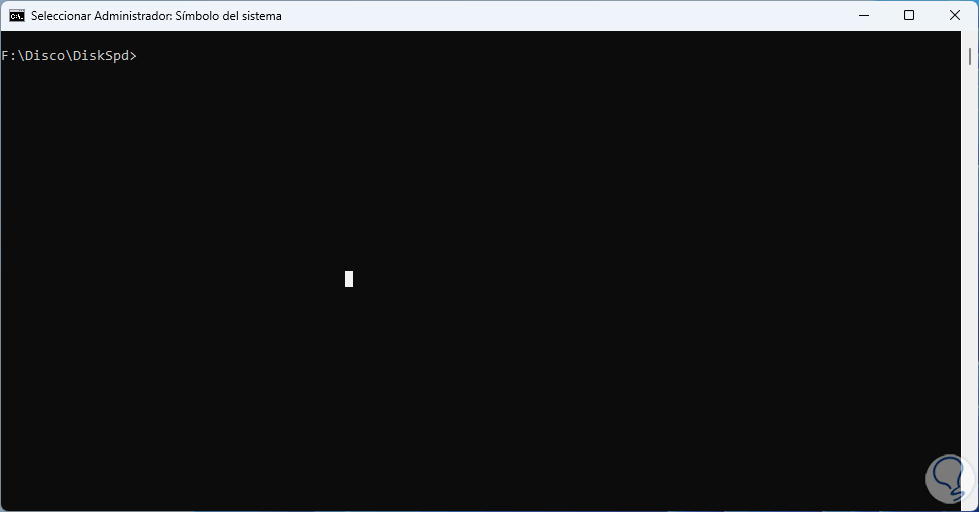
We go to the path where the downloaded utility is in the console:
step 8
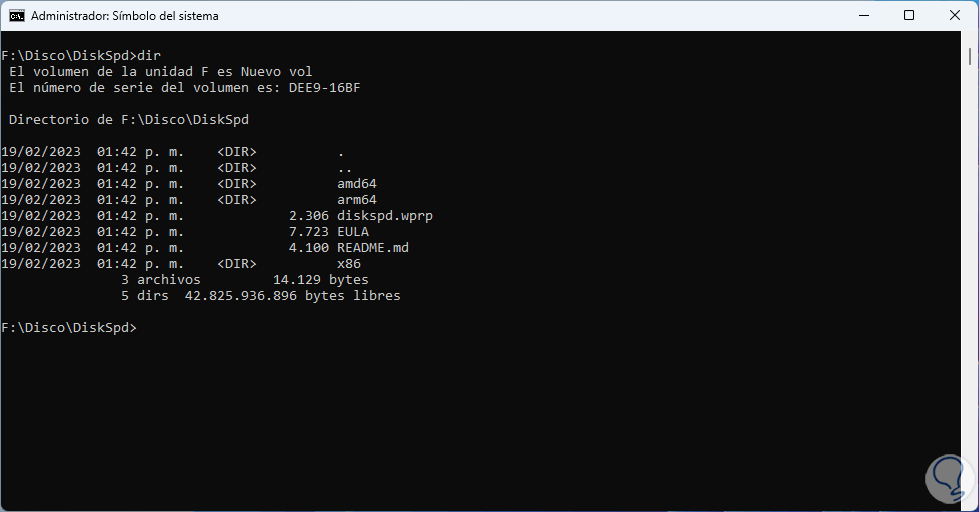
We can use “dir” to list the content:
step 9
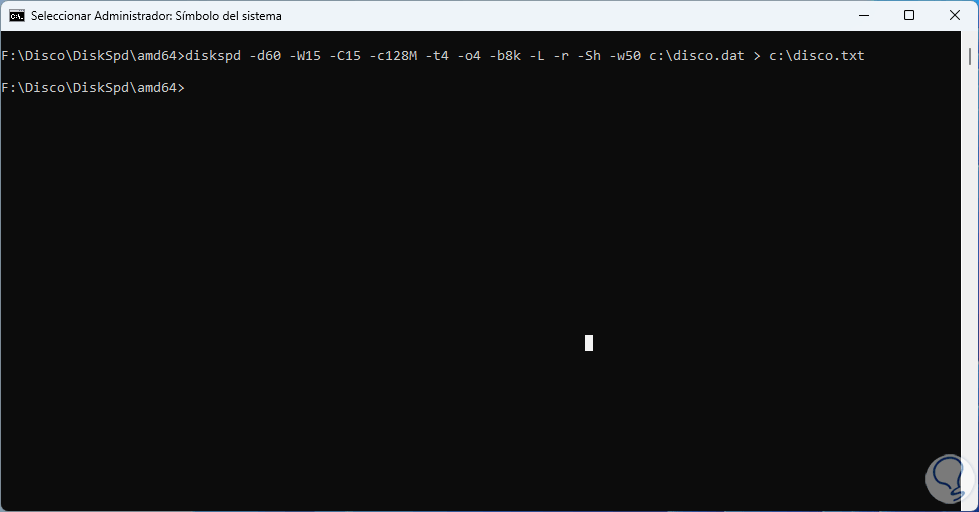
We execute the following in the console:
diskspd -d60 -W15 -C15 -c128M -t4 -o4 -b8k -L -r -Sh -w50 c:\name.dat > c:\name.txt
step 10
We expect the process to work in the background.
step 11
The criteria that we can use with Diskspd are:
- -t: refers to the number of threads based on the target or test file, it is a number that is based on the number of CPU cores for this example we have used 4 threads in order to use all CPU cores
- -o: refers to the number of outstanding I/O requests per destination per thread
- -b#K – Indicates the block size in bytes, KB, MB, or GB
- -r: means that the random I/O has been aligned based on the size that can be used in bytes, KB, MB, GB or blocks
- -w#: allows us to indicate the percentage of operations which are write requests (-w0 is equal to 100% read), w (write)
- -d#: indicates the duration of the test, the default value is 10 seconds but we can enter any value
- -suw: This option disables software and hardware write caching
- -D: captures IOPS statistics
- -L: This option measures latency statistics
- -c#g: allows to define the sample file size used in the test, this value can be used in bytes, KB, MB, GB or blocks
- -Sh – This option disables software caching like hardware write caching
Note
by using the value > c:\name.txt it is possible to send the result directly to a file and if this parameter is not used the result will be visible directly in the console.
step 12
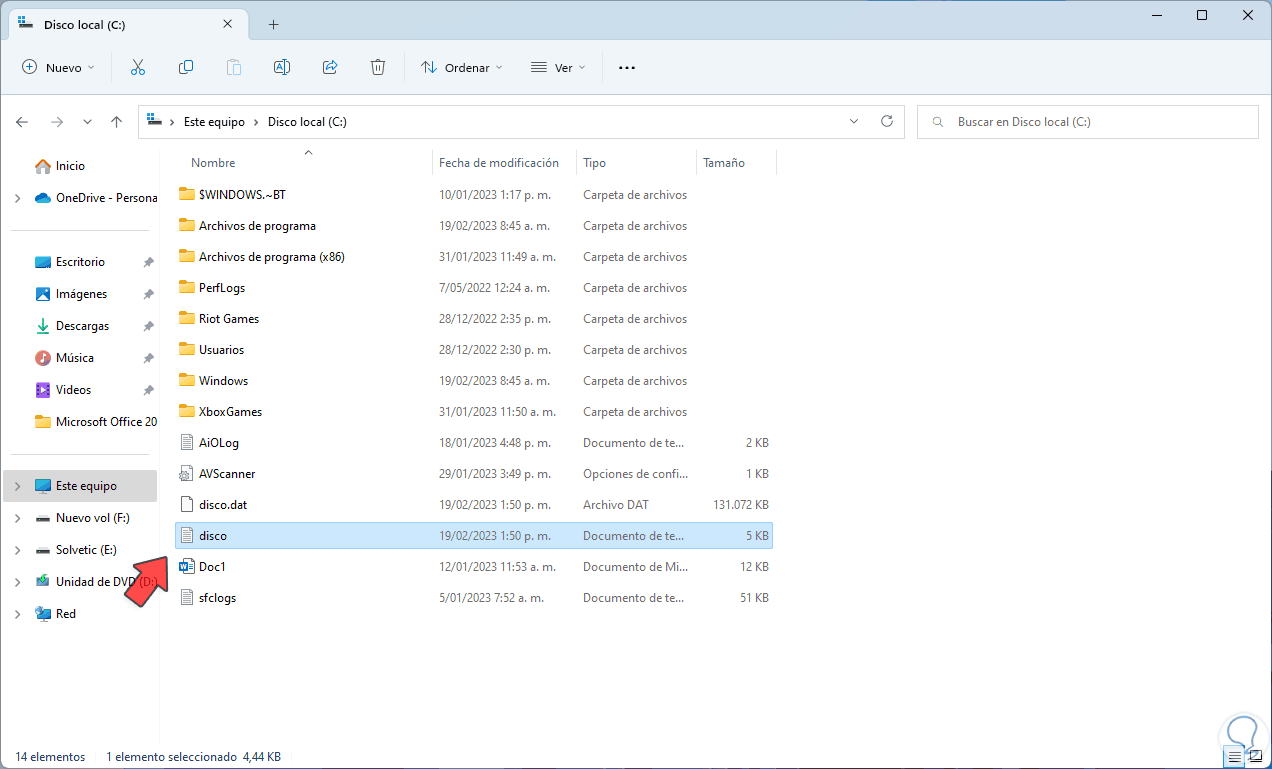
We check that the file has been created:
step 13
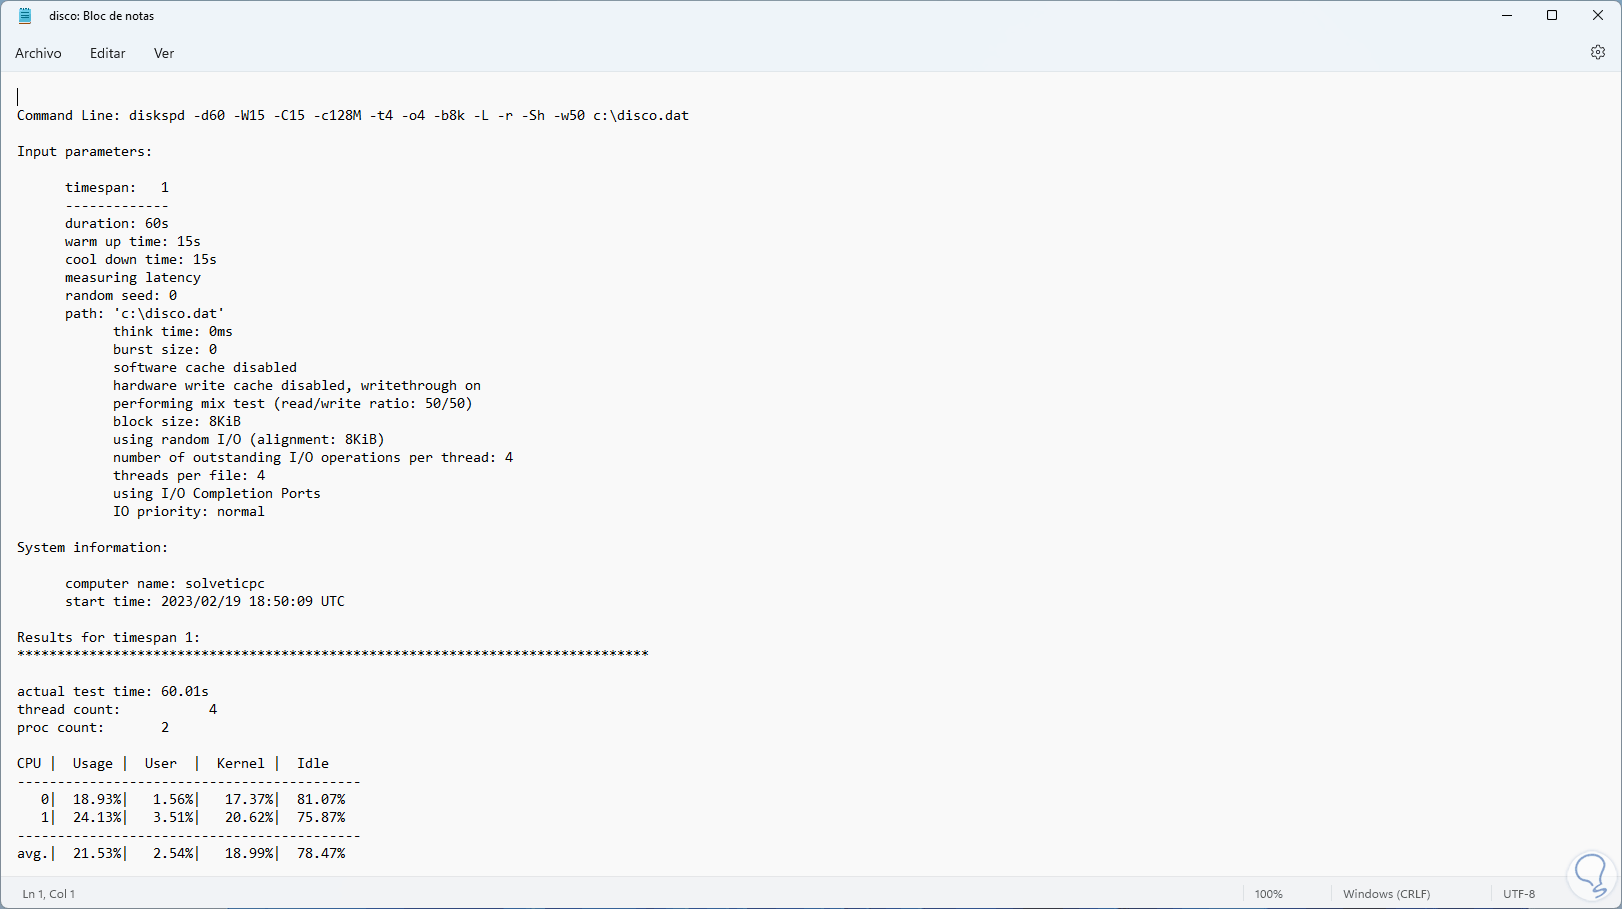
Open the text file with the disk analysis data:
step 14
In the central part we find the command that has been executed and values such as:
step 15
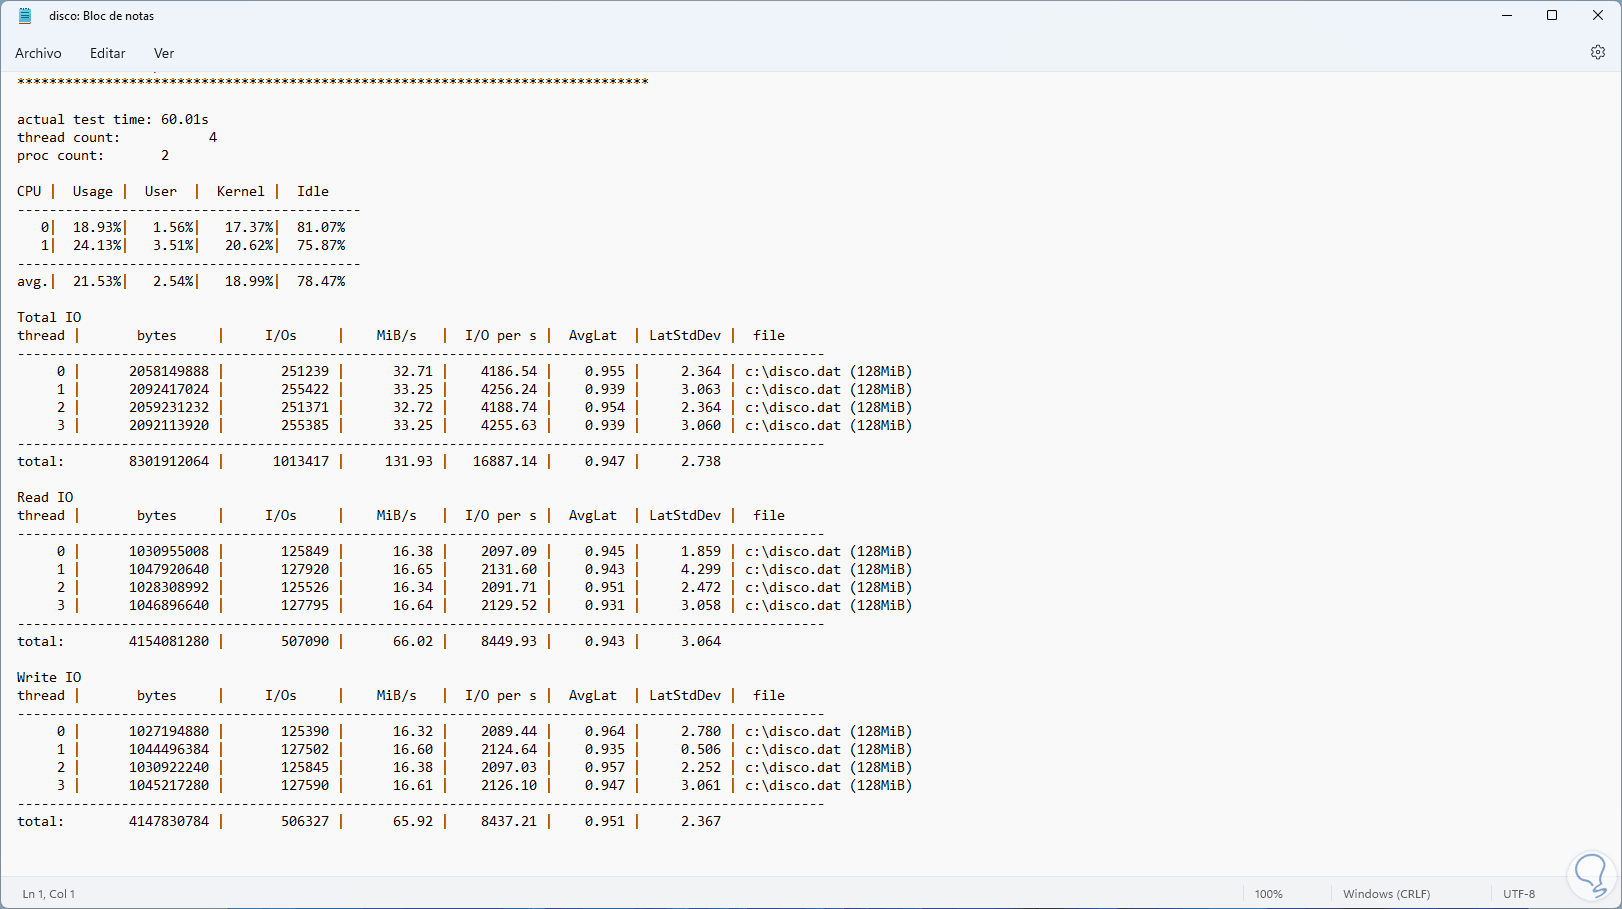
In the central part we find:
- Total I/O (Input / Output) in number of threads, size, etc.
step 16
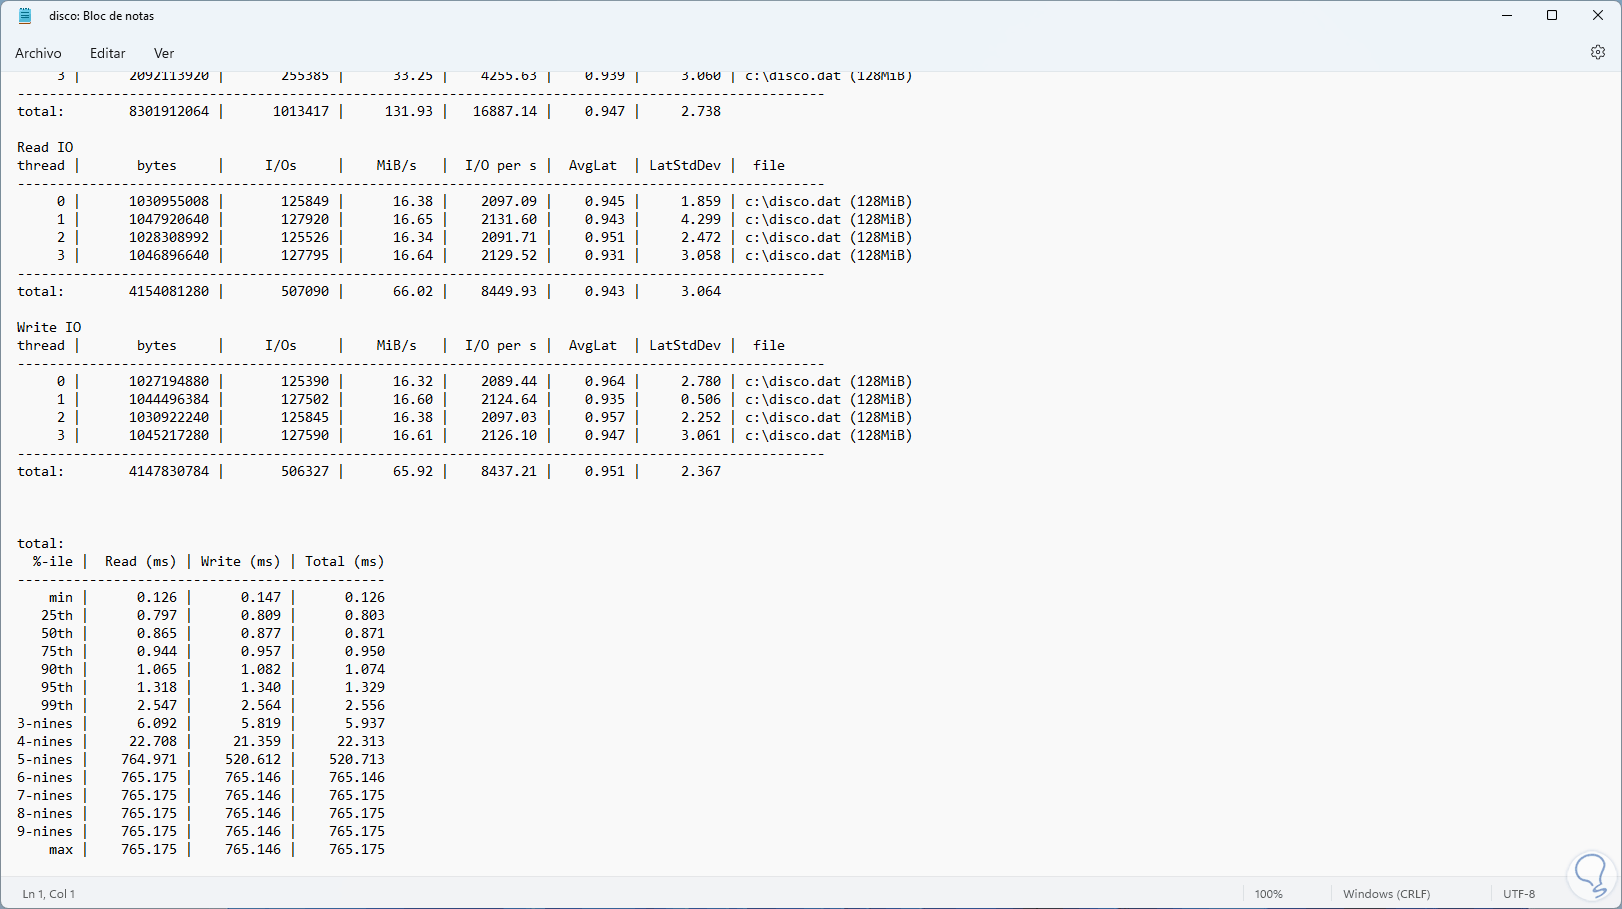
In the final part we see the input and output reading results in various percentages:
step 17
In the final part we will see a total summary of the test carried out with Diskspd.
We see how this utility is ideal for knowing the status of the hard drive in real time and making decisions about it..