When administering and managing Linux systems, it is necessary to have the best tools to take full advantage, not only of free code, but also to the way we obtain the information of each system and its components, whether hardware, processes or services. A fundamental aspect in any system and organization will undoubtedly be the management of the network since if it fails or presents some kind of anomaly it will have a negative impact on the way in which the roles are distributed and will prevent us from performing hundreds of tasks naturally and correct..
To help us in this process of network management , we have a command called MTR (My Trace Route). This command is a network diagnostic tool based on a command line that works easily and can be used on systems such as Linux, Windows or macOS. Commands in Linux are the essential basis of their use and that is why it is important to know them.
The mtr command combines the functionality of the already known and practical traceroute and ping commands only here combined into a single tool. Identical to the operation of traceroute, the mtr command prints information about the route that packets take from the host on which mtr is executed to a destination host that we can specify in order to take control of all the steps involved in this action. , such as routers, packets sent, response times of all network breaks, etc ,. In this way, you can have a centralized control to detect errors if they exist..
Now let's see how to use this important command in Linux.
How MTR works
At the time we execute the mtr command on Linux, the network connection located between the local system and the remote host on which the process will be performed is scanned. There, in the first place, the address of each network jump is established where they involve elements such as bridges, routers and gateways, between the hosts, after this it is ping, which is a sequence of ECHO ICMP requests to each one to determine the quality of the link available for each machine.
Now, during this process, the mtr command generates certain useful statistics about each device which are updated in real time by default. The mtr command is preinstalled on most Linux distributions and now we will see how it works..
1. Install MTR command on Linux
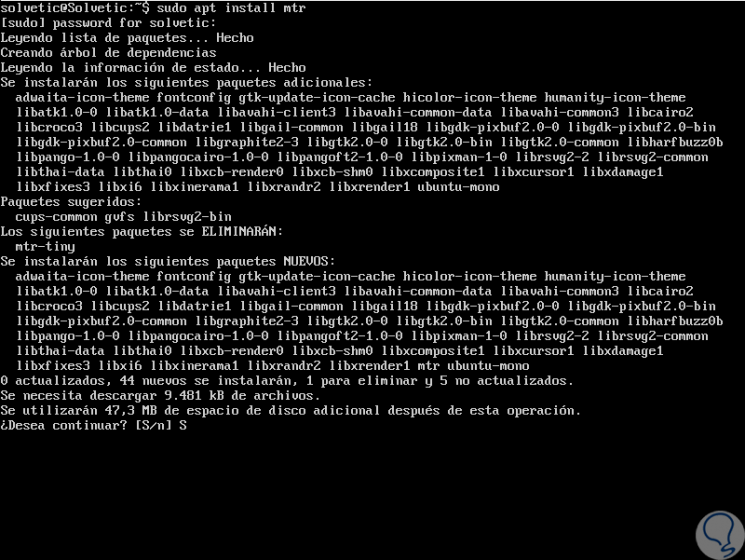
In case we do not have mtr installed, we can install it by running the following command based on the distribution we use. There we enter the letter S to confirm the download and installation of mtr.
sudo apt install mtr sudo yum install mtr sudo dnf install mtr
2. Use MTR command on Linux
Once installed we can start using mtr in Linux for some tasks that we will explain below.
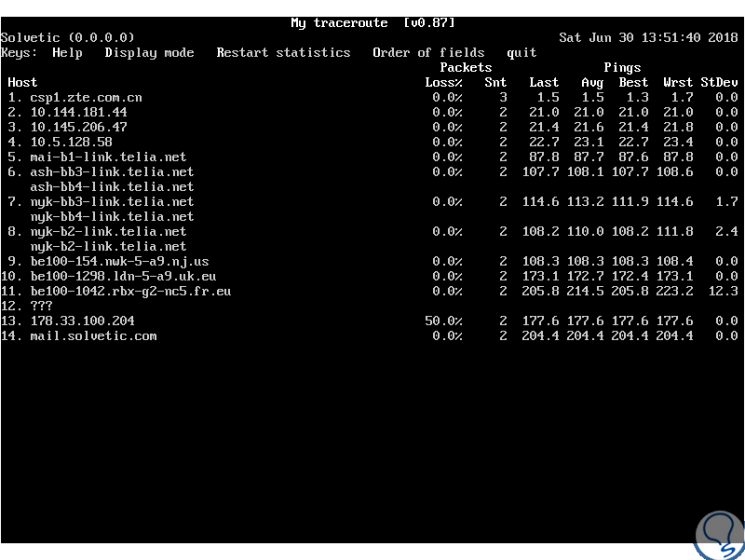
Step 1
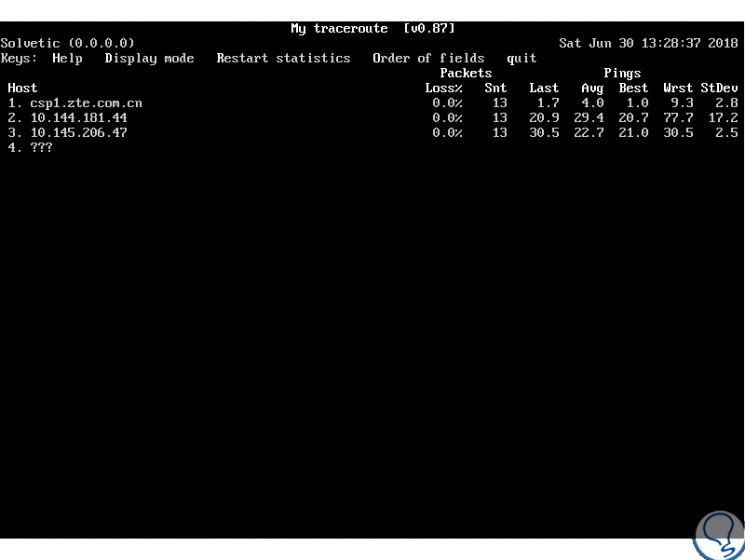
A simple way to use the mtr command is to indicate the name of a domain or the IP address of any remote computer as an argument, in this way the mtr command will display a real-time updated traceroute report which can be stopped by pressing the qo key The following key combination:
+ C Ctrl + C
mtr solvetic.com
Step 2
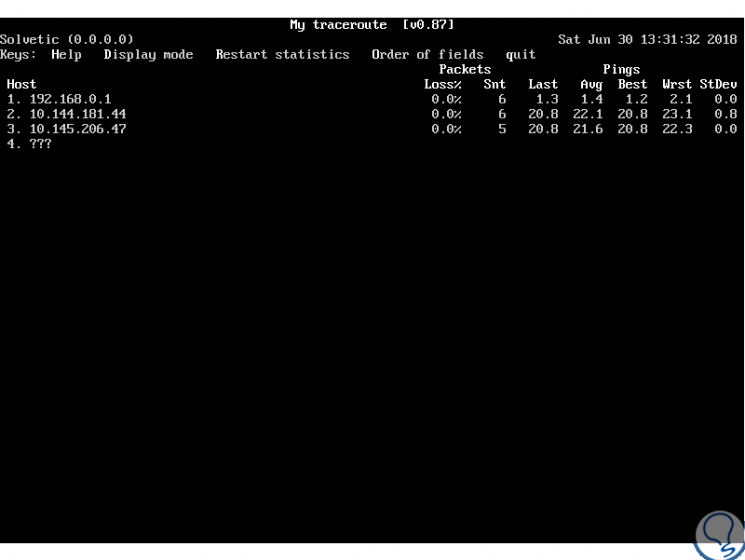
It will be possible to force the mtr command to display numerical IP addresses instead of host names (FQDN, fully qualified domain names), through the
-n parameter like this:
mtr -n www.solvetic.com
Step 3
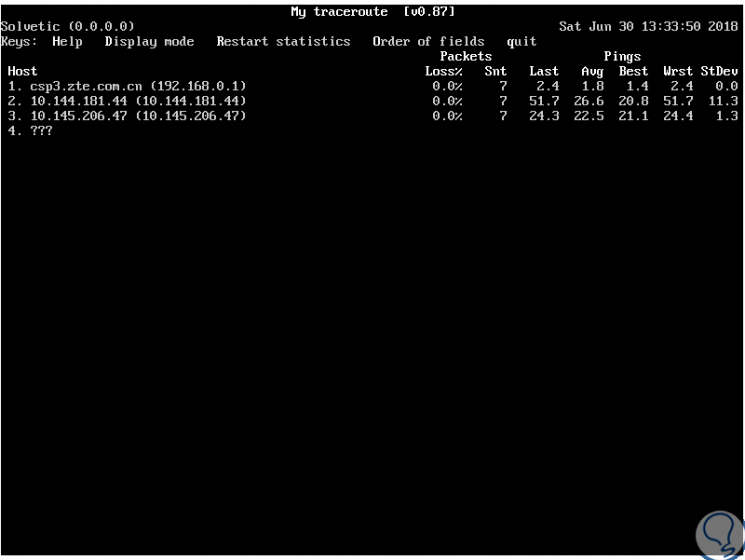
If we want the mtr command to display both host names and IP numbers, we must use the
-b flag like this:
mtr -b www.solvetic.com
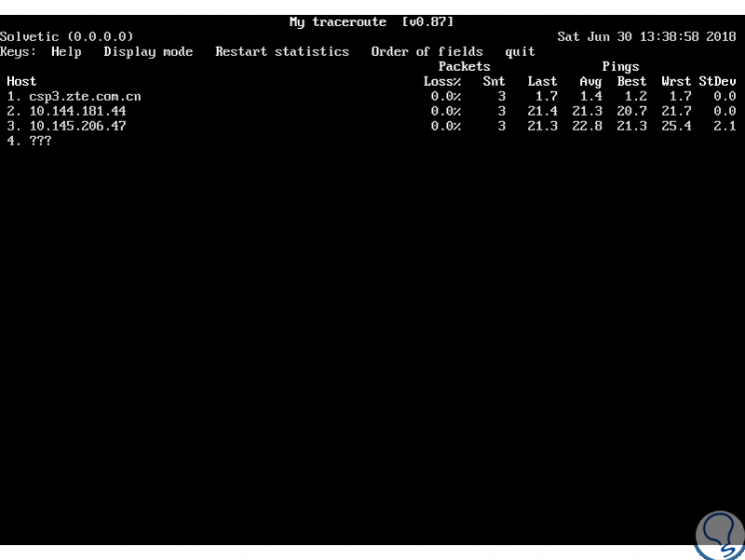
Step 4
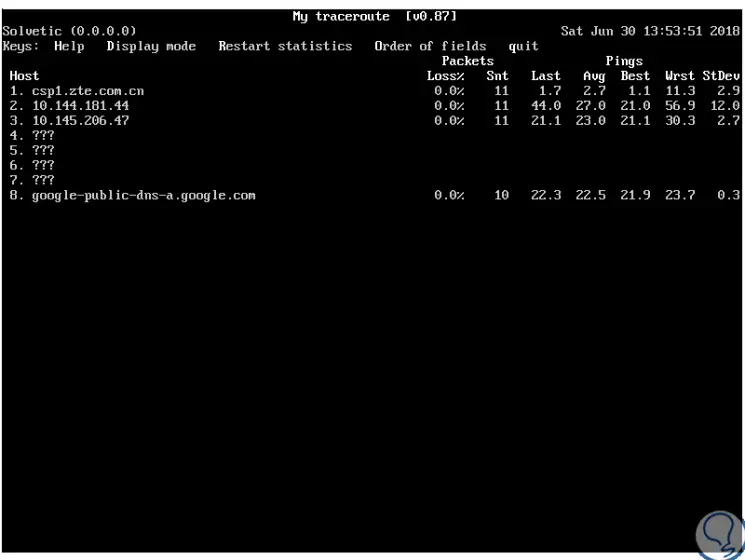
If we want to limit the number of pings to a specific value and exit the mtr command after executing those pings, we must use the
-c parameter, we can observe in the Snt column, once the indicated number of pings is reached, that the update live stops and the program quits its execution:
mtr -c3 www.solvetic.com
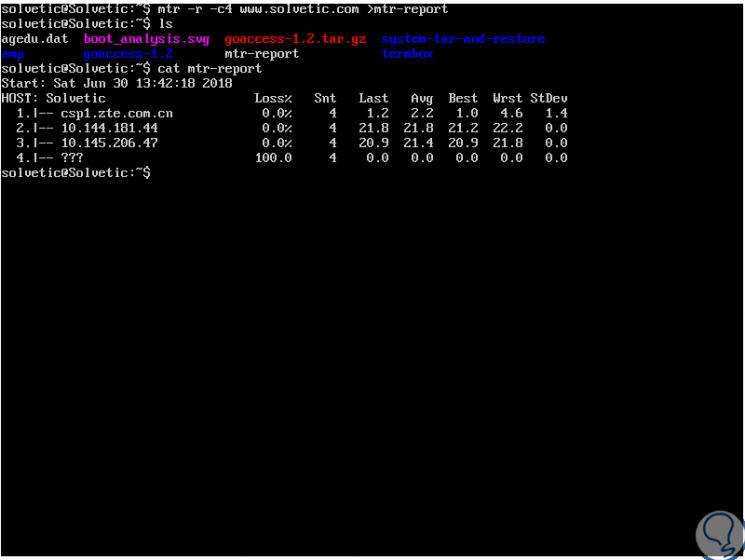
Step 5
Another option is to configure the mtr command in report mode through the
-r indicator, which is a useful option to generate statistics on the quality of the analyzed network. We can combine this option together with the -
c parameter to specify the number of pings to be executed, because these statistics are printed on standard output, we will have the option of redirecting them to a file for later analysis:
mtr -r -c 4 solvetic.com> mtr-report
Step 6
We can check the report using the "ls" command and then view its contents using "cat":
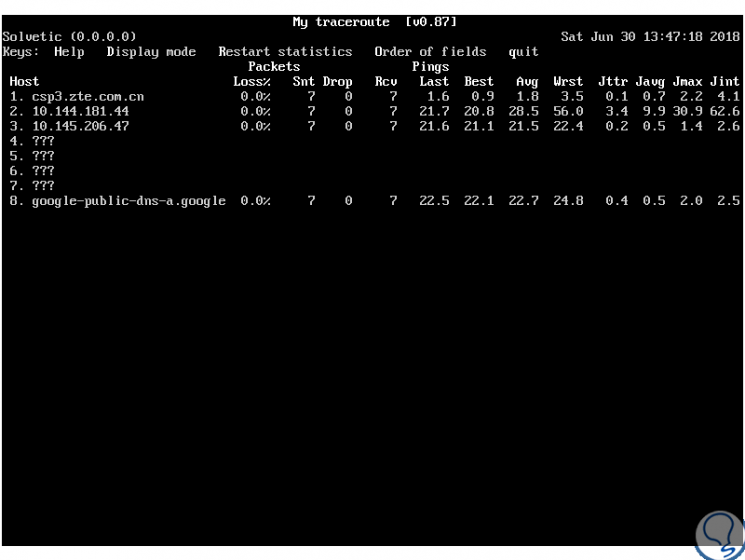
Step 7
Right there we can add the -w parameter to enable the broad report mode for a more complete output like this:
mtr -rw -c 4 solvetic.com> mtr-report
Step 8
Another alternative to use is the ability to re-organize the output fields in the desired way thanks to the -o parameter:
mtr -o "LSDR NBAW JMXI" 8.8.8.8
Step 9
The options to organize are:
Step 10
The default interval in mtr for ICMP ECHO requests is one second, this will be possible by changing the interval between ICMP ECHO requests by modifying the value using the
-i parameter like this:
mtr -i 2 solvetic.com
Step 11
It will also be possible to use TCP SYN packets or UDP datagrams instead of the default ICMP ECHO requests thanks to one of the following options:
mtr --tcp solvetic.com mtr --udp solvetic.com
Step 12
To specify the maximum number of hops, whose default value is 30, to analyze between the local system and the remote machine, we will use the "-m" indicator:
mtr -m 10 8.8.8.8
Step 13
Another alternative to use is to set the size of the packet used in the byte measurement by taking the
-s parameter like this:
mtr -r -s PACKETSIZE -c 4 solvetic.com> mtr-report
Step 14
Some additional alternatives to use with mtr are:
-h
Display the help of mtr.
-v
Display the used version of mtr.
-4
Use only IPv4 addresses.
-6
Use only IPv6 addresses.
-F (Filename) or –filename
Refers to reading the host names of a file.
-xml
Save the query in xml format
-t, --curses
Force the mtr command to use the terminal-based cursor.
--displaymode MODE
Use any of the following values ​​to display the results, 0 (default) to select statistics, 1 to display the information without latency and 2 to display the information with latency.
-l, --raw
Save the information in raw format.
-csv
Save the information in csv format.
-json
Save the information in Json format.
--show-ips
It displays both the host name and the IP address.
With the mtr command we can have a simpler control over the state of our network and check in a much more central way its different aspects focused on its optimization.