As system administrators and IT support personnel, it is practical and useful to have tools that help us manage in a much more centralized way each aspect of both the operating system and each of its components..
For this type of administration, today in TechnoWikis we will analyze a dynamic and complete tool to perform this type of administration and it is Netdata . And for this we will analyze how to use Netdata in Debian 9.
What is Netdata
Netdata (Network Data) is a graphics system designed for real-time distributed performance and general system health monitoring at the hardware and software level.
When using Netdata we have a valuable tool that offers and generates extensive information, in real time, of everything that happens on the system you are running (including applications such as web servers and databases), making use of modern interactive web panels facilitating thus the administration and control since the information is more than clear..
Netdata is fast and efficient, designed to run permanently on all systems (physical and virtual servers, containers, IoT devices), without interrupting the central function of these which does not interfere with any activity that we carry out in the system.
Netdata can be run on Linux, FreeBSD and macOS without problem.
The main features of NetData are:
Various interactive boot boards
Mouse and touch friendly available in 2 themes: dark and light
Fast
Netdata is able to answer all queries in less than 0.5 ms per metric, even in low-end hardware, which is really useful.
Highly efficient
Netdata can collect thousands of metrics per server per second, with only 1% of single-core CPU utilization, some MB of RAM and no disk I / O at all, which helps in resource-level savings.
It has an alert manager
Netdata supports hundreds of alarms so that we are aware of developments in our system, it supports dynamic thresholds, hysteresis, alarm templates, multiple role-based notification methods (such as email, slack.com, flock.com, pushover. net, pushbullet.com, telegram.org, twilio.com, messagebird.com, kavenegar.com) and more.
Extensible
Netdata can control any element from which a metric can be obtained, using its add-in API such as network data add-ons, BASH, Python, Perl, node.js, java, Go, Ruby, etc.)
Incrizable
The Netdata utility can run anywhere where a Linux kernel is running (even IoT) and graphics can also be embedded in the web pages we manage.
Configurable
Netdata makes use of custom panels that can be built using simple HTML without the use of JavaScript
Scope
Netdata can automatically detect everything on a system and is able to collect up to 5000 metrics per server.
Zero dependencies
Which is useful for static web files and web APIs
Maintenance free
Which brings more comfort
It has several operating modes
Netdata has various maintenance modes including stand-alone host monitoring, headless data collector, forwarding proxy, storage and forwarding proxy, central monitoring of multiple hosts, in all possible configurations. Each node can have a different metric retention policy and run with or without status monitoring.
Requirements to use Netdata
- Have Debian 9 which we get in the following link:
Debian 9
1. How to upgrade Debian 9 Linux
The first step is to update the Debian 9 packages using the following commands:
sudo apt-get update -y sudo apt-get upgrade -y
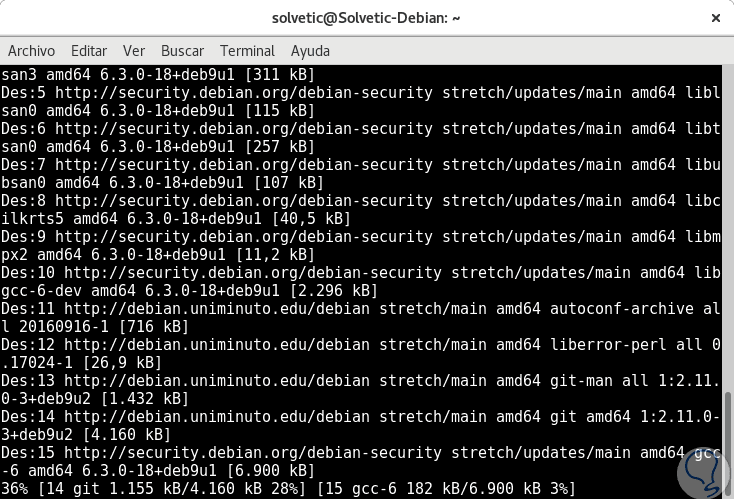
Once updated, we will install the required dependencies using the following line:
sudo apt-get install zlib1g-dev uuid-dev libmnl-dev pkg-config curl gcc make autoconf autoconf-archive autogen automake python python-yaml python-mysqldb nodejs lm-sensors python-psycopg2 netcat git -y


Login Join up!