Always knowing the status of the components of our equipment is key to determining the work capacity that we can apply to it. A PC limited in CPU , memory, or some other component can stop responding at key work times, reboot, freeze, or just not respond as expected. To determine the status of some of these components, if you use a Chromebook, you have an integrated function in the browser with which you will get a global view of the status statistics and therefore in TechnoWikis we will see how to do this..
With the Windows 10 performance statistics we can determine if our computer works correctly with the hardware it has or if it is limited in processes when performing them. We must always try to exceed the minimum requirements for an application since otherwise we could saturate Windows 10 or the disk at 100 .
To stay up to date, remember to subscribe to our YouTube channel! SUBSCRIBE
View system performance statistics on Chromebook
Step 1
To do this we open a new browser tab and execute the following:
chrome: // sys-internals
Step 2
Sys-internal is a small group of statistical data of components such as the CPU or memory which displays the status in real time, when executing this we will see the following:
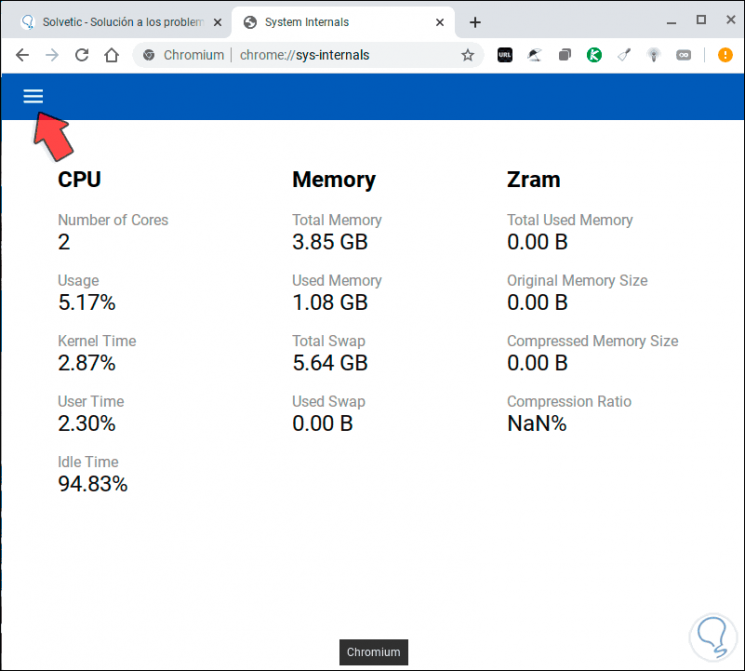
Step 3
We understand the three categories that this encompasses, which are the processor, memory and the Zram, the Zram is a compressed virtual memory which largely takes advantage of the physical RAM since it will create a compressed block in the RAM.
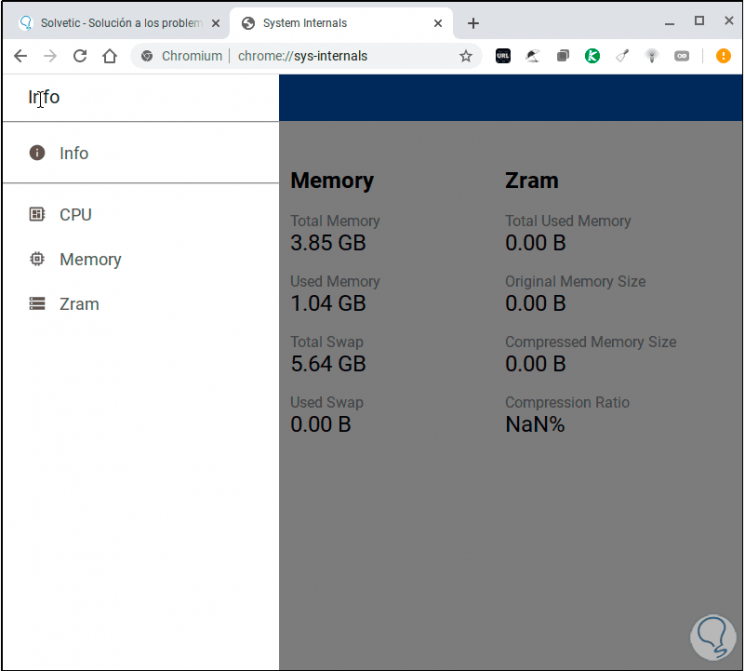
From the upper corner we can access the different sections to see details in graphic format, by default we see the assigned percentages and sizes, by clicking on this menu we will see the following:
Step 4
We click on CPU and see the number of processors available along with their values in hourly ranges:
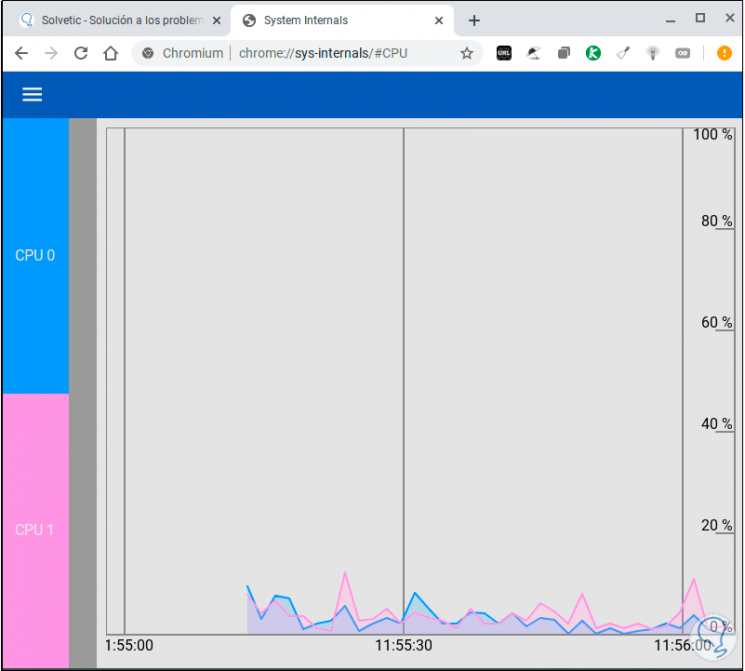
Step 5
You can click on each CPU core on the left side to add or remove it from the graph.
In the Memory section we will see the following:
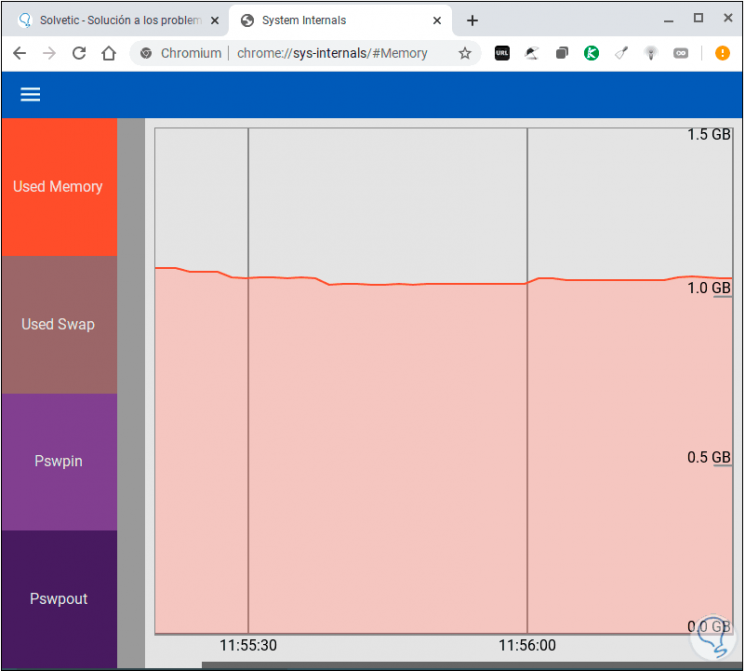
Step 6
We can see segmented memory as:
- Pswpin is the number of kilobytes that the system has swapped from the disk measured in seconds
- Pswpout is the number of kilobytes that the system has transferred to disk based on seconds
Step 7
Like the previous one, we can click on each section to activate it or not. Finally we go to Zram where we will see the following:
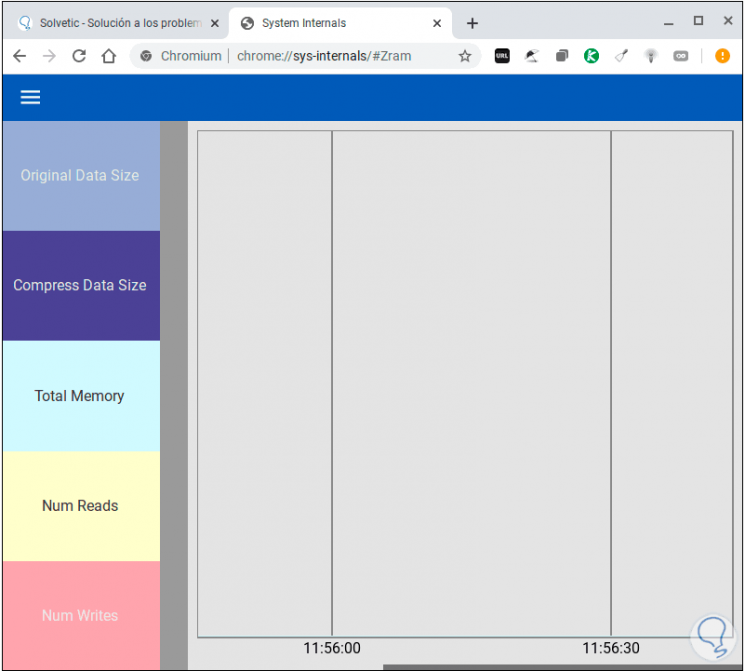
Step 8
There we find details such as:
- Number of reads and writes
With this functionality in Chromebook we have a complete analysis in real time of the statistics of the components of the equipment..