Windows 10 integrates into the system itself utilities that have been developed in order to carry out complete control over the state of the system and its components and we are talking about the Windows 10 performance monitor . This monitor allows us to know in real time the use of memory, network use, disk use and many other variables to determine the type of support activity to perform in case of failures..
Thanks to this performance or resource monitor , it is possible to know specific details about all the variables of each resource such as the performance of the Windows 10 GPU and for this reason we will learn to use it in a comprehensive way in Windows 10.
To stay up to date, remember to subscribe to our YouTube channel! SUBSCRIBE
How to run Windows 10 performance monitor
Step 1
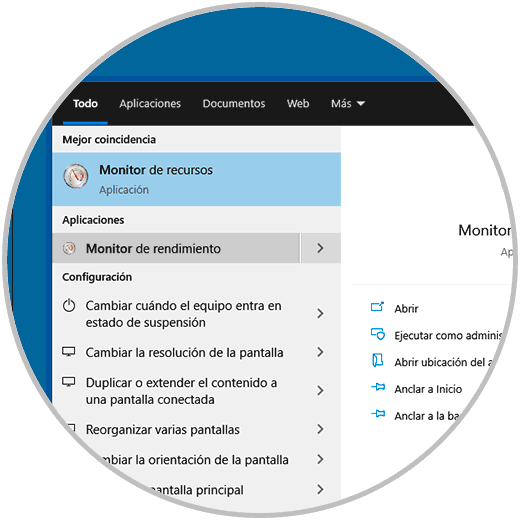
For this process we go to the Start menu search engine and there we enter "monitor", in the displayed results we select "Performance Monitor":
Step 2
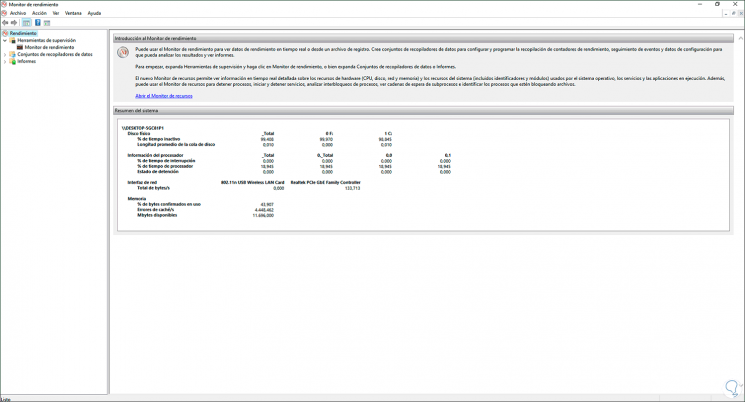
When executed we will see the following:
Step 3
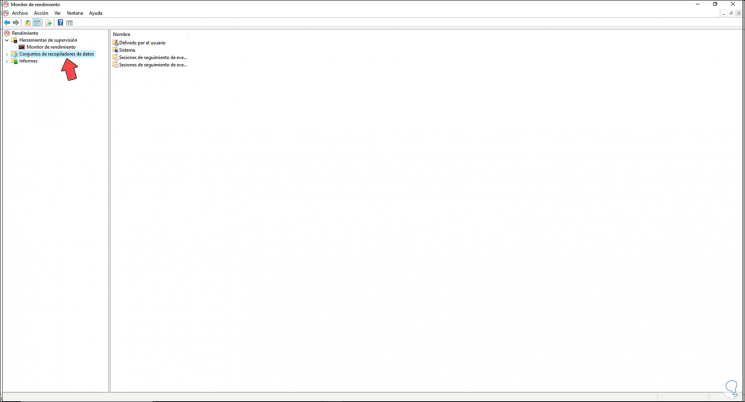
There we find by default a brief summary of the status of the components of the system, now we go to the section "Sets of data collectors":
Step 4
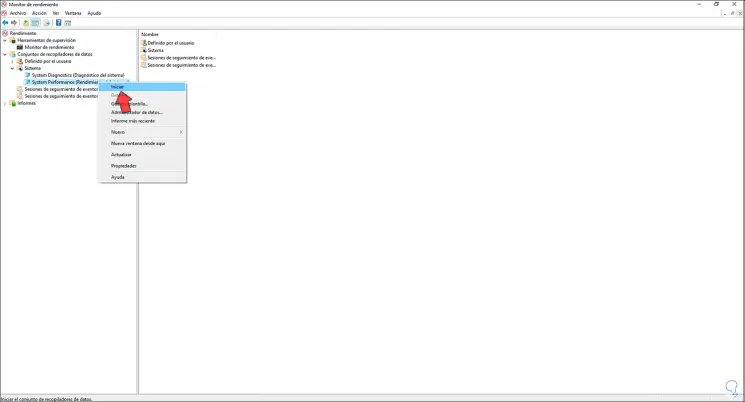
We display your options and select System, then right click on "System Performance" and choose "Start" in order to trigger the data collection:
Step 5
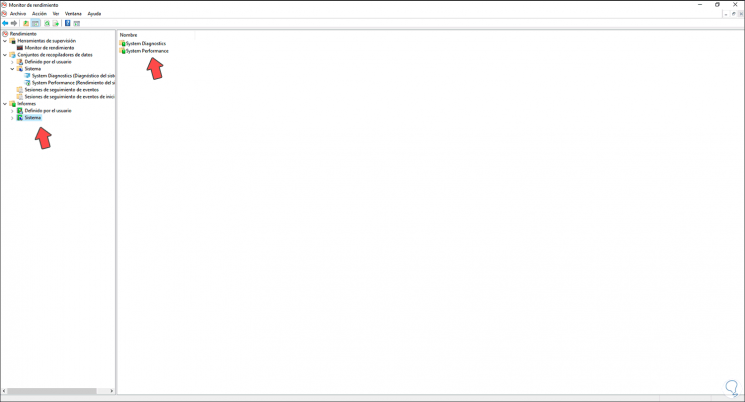
After this we go to the "Reports" section and in the options displayed we select "System":
Step 6
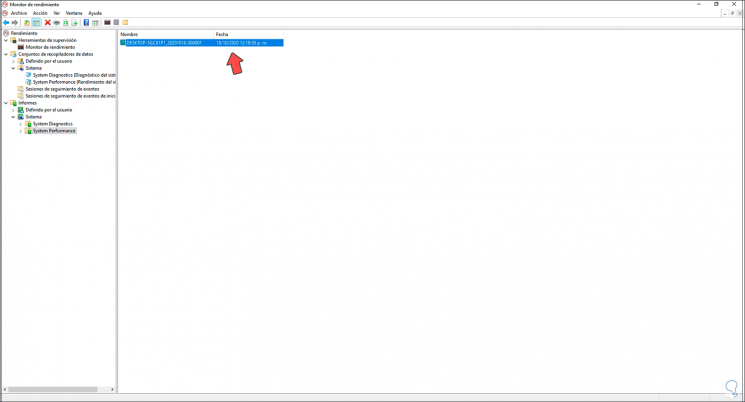
In the central panel we go to "System Performance" and when we select it we will see the detail of our team and the date and time the data was collected:
Step 7
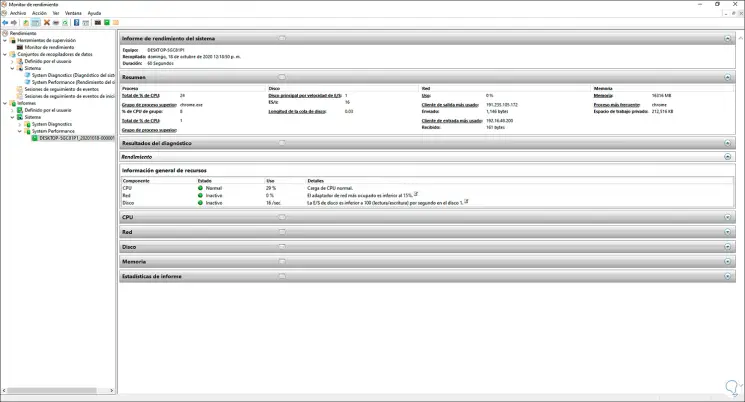
We double-click on this line and access the details in a much more complete way:
Step 8
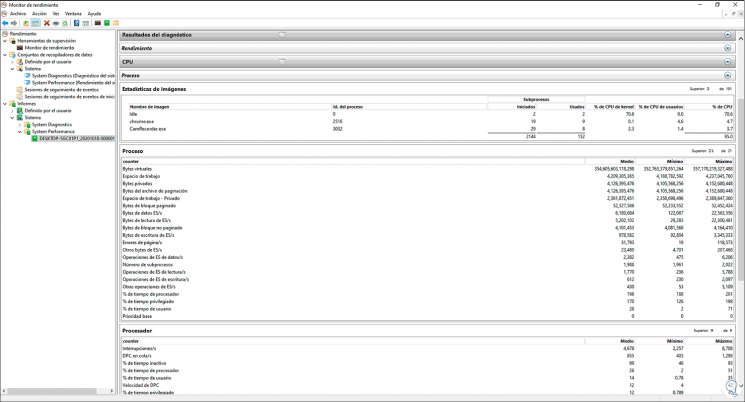
We can see that there are different categories of resources, when accessing each of them we see the complete details, for example, from CPU we can choose Processes or Services to see which of these are active and their impact on the processor:
Step 9
We can find specific details in averages, number of active services or processes, etc. Now we go to the "Network" section and there we can validate by interface or protocol:
Step 10
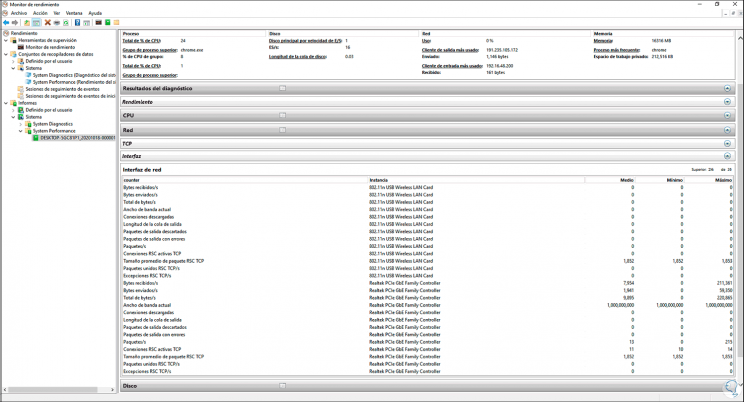
In this case we have selected "Interface" and we find specific details such as:
- Network driver used (Wi-Fi or LAN)
- Averages of packages sent and received
Step 11
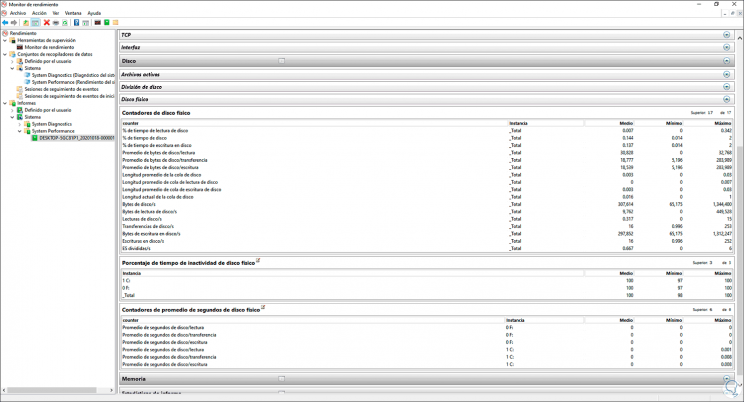
From Hard Disk we can directly select the physical disk or its division or active files, in this case we have selected the physical disk and we find aspects such as:
- Bytes counter sent and received (read and write)
- Likewise, it is possible to go to the Network or Report sections directly.
With the Performance and Resource Monitor in Windows 10 we have at hand a tool to fully monitor and in real time every aspect of the system devices to lead to the correct administration of these..