Microsoft has developed a series of useful applications, through which a series of analyzes , tests or controls on the operating system in general can be carried out and which can be very useful for all administration tasks that require full control over the various components of the operating system itself..
One of these tools is the Windows ADK (Windows Assessment and Deployment Kit) which has the necessary tools to customize Windows images in order to create a large-scale implementation and, before this , test the quality and performance of the system, its additional components and the applications that will be executed on it and thus avoid subsequent errors that may have a negative impact on the execution of Windows.
The Windows ADK download is available at the following link:
Windows ADK
Once downloaded we proceed to run the wizard:
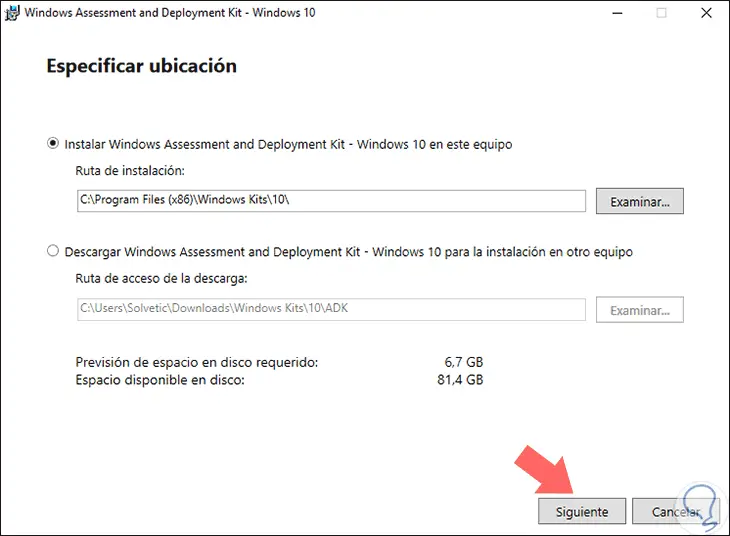
After accepting the license we will see the following. There we can select the features that we want to be installed in Windows 10 according to our criteria. Once selected click on "Install" to proceed with it..
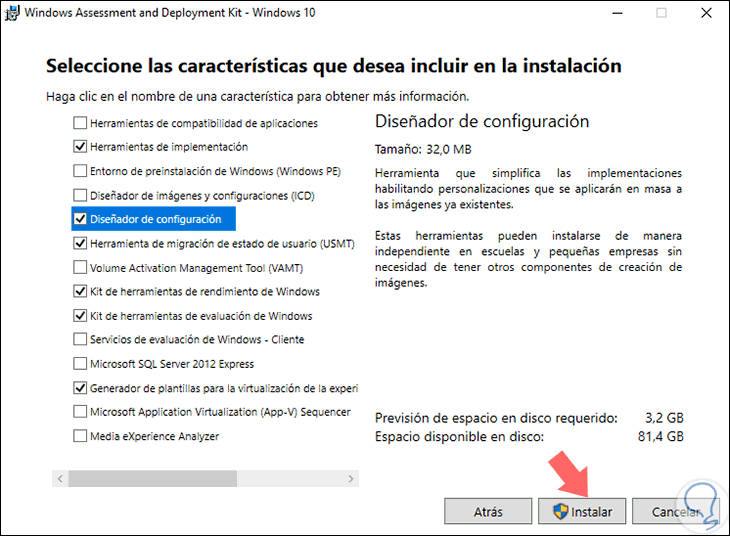
At this point, there is the Windows Performance Toolkit or Windows Performance Toolkit feature which are a series of performance monitoring tools, which are responsible for generating detailed performance profiles of Windows 10 operating systems and applications.
TechnoWikis will analyze in detail how to use Windows Performance Recorder (WPR) and Windows Performance Analyzer (WPA) in a Windows 10 environment and thus verify how we have handy utilities at hand that we might not know but that become an ally when it comes to bringing perform support and general administration tasks..
The system requirements to run Windows Performance Toolkit are:
- Windows Performance Recorder (WPR): From Windows 8 onwards
- Windows Performance Analyzer (WPA): From Windows 8 onwards with Microsoft .NET Framework 4.5 or later.
What is Windows Performance Recorder (WPR)
WPR is a great recording tool which was developed to create recordings of events for Windows (ETW), it will be possible to run WPR from the user interface (UI) or from the command line as we deem necessary.
WPR offers integrated profiles which we can use in order to select the events that will be recorded in Windows 10, and, simultaneously, we can create custom profiles in XML.
With WPR it can also be invoked and controlled using the WPRControl application programming interface (API).
When using WPR, multiple system events will be recorded as
- Use of VirtualAlloc (virtual assignments)
- Events of suppliers related to XAML
- Events of HTML-related providers, such as Internet Explorer and JavaScript
- Desktop Composition Activity
- All desktop composition activity
In addition to this, WPR has the following integrated profiles
- Audio faults: Associates all technical problems generated during audio transmission
- Technical video problems: Help to visualize all the failures occurred during the video transmission
- Internet Explorer: Analyze the performance of Internet Explorer
- Minifilter I / O Activity
- XAML application analysis
- HTML application analysis
When executing WPR, it will be possible to select several performance scenarios directly in the user interface (UI) where we will have options such as:
general
This scenario records the overall performance while the equipment is running.
On / Off - Start (On / Off - Boot)
It is responsible for recording the performance while the computer is in the process of being started.
On / Off - Quick Start (On / Off - Fast Startup)
This scenario records performance during a quick start.
On / Off - Off (On / Off - Shutdown)
Record the performance while turning off the computer.
On / Off - RebootCycle
Record the performance during the entire computer restart cycle
On / Off - Standby / Resume (On / Off - Standby / Resume)
It is responsible for recording the performance of the equipment in standby mode and after its resumption.
On / Off - Hibernate / Resume (On / Off - Hibernate / Resume)
This scenario records performance when Windows 10 is in hibernation state and will then resume.
1. How to access Windows Performance Recorder (WPR) in Windows 10
To access this tool we have the following options:
Option 1
In the Windows 10 search box enter wpr and there select the utility
Option 2
Go to the menu:
- Windows Performance Recorder
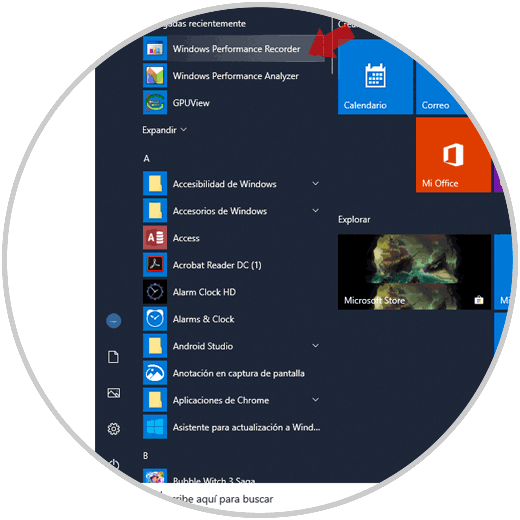
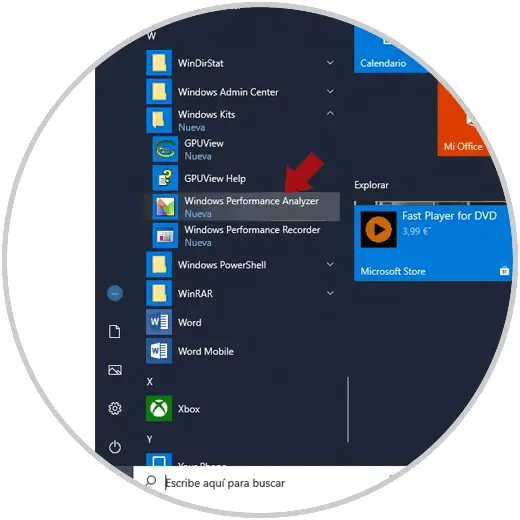
Option 3
Click on the "Start" menu and look for it in recently added applications
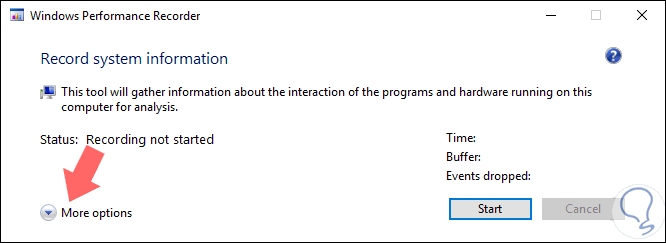
Step 2
When executing the utility we will see the following. This is the basic environment. If we click on the "More options" line
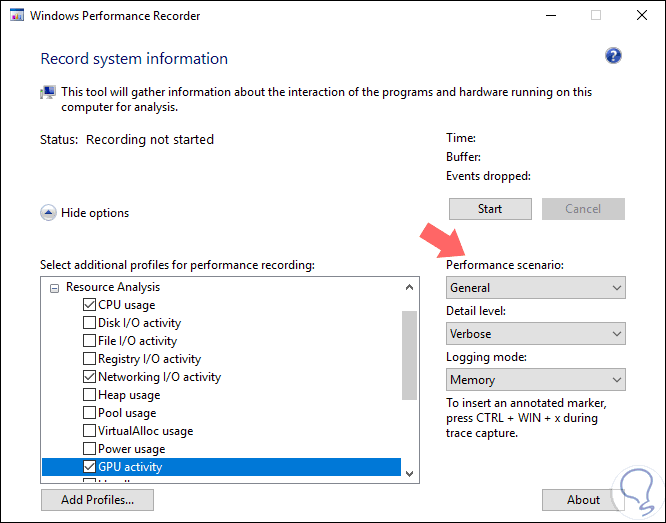
Step 3
We will access the profile options or parameters to analyze:
In the right side section we can choose
- Level of detail: There we have the options "Light" and "Verbose". The Light level of detail is basically used to time the recordings while the Verbose level of detail provides detailed information for the analysis.
- Logging mode: There we have the File options which records the log data in a sequential file or Memory records the log data in circular buffers in memory directly.
At the bottom we can add the desired profiles if necessary. Once we define each of these steps, click on the "Start" button
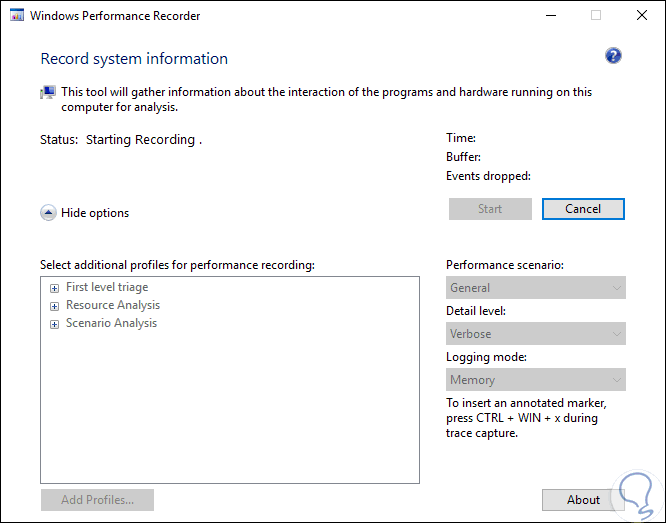
Step 4
We will start recording the events according to the defined criteria:
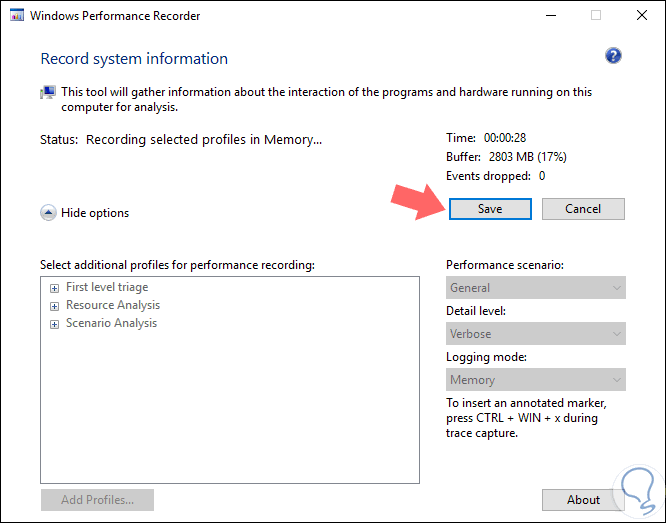
Step 5
We can see that time elapses, used buffer and recorded events. At any time we can click on the "Save" button to save this information
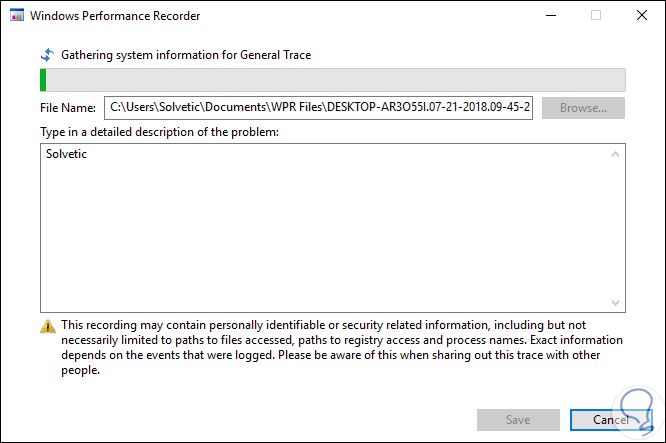
Step 6
The following will be displayed:
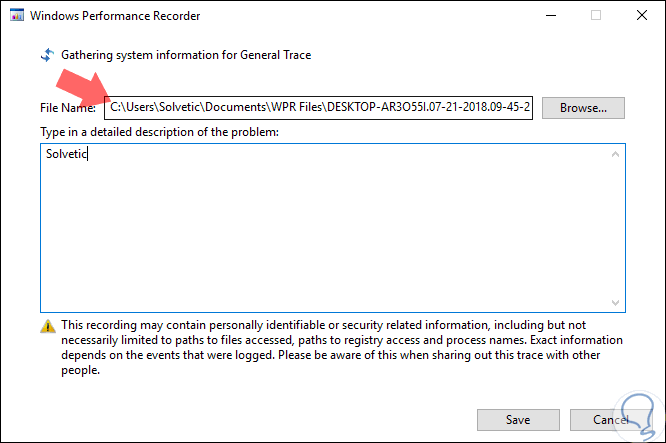
Step 7
There we define where the report is to be saved and click on Save for this:
Step 8
Once the report is saved, the following will be displayed:
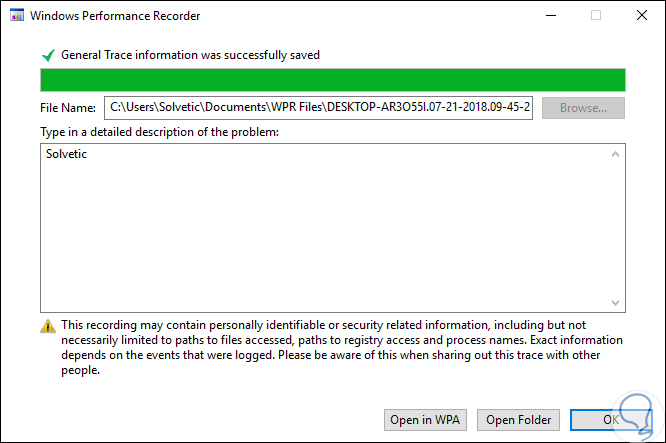
Step 9
As we can see, the process is completed and it will be possible to open the container folder or open the report directly with WPA.
Note
As mentioned before, WPR can be executed from the command line where the total complexity of WPR is integrated into the recording profiles.
If we choose to use the command line, the syntax to be used will be as follows:
wpr {-profiles [<path> […]] | -start <arguments> | -stop <arguments> | -cancel | -status <arguments> | -log <argument> | -purgecache | -help <arguments> | -profiledetails | -disablepagingexecutive} The available options are:
What is Windows Performance Analyzer (WPA)
WPA was developed as a powerful analysis tool that is capable of combining a flexible user interface with extensive graphing capabilities and data tables that we can pivot and these have full text search capabilities. When using WPA we will have a Problems window to explore what is the cause of the problems presented.
The user interface (UI) of Windows Performance Analyzer (WPA) is based on a collection of coupled windows arranged in a central workspace, with this workspace we will have at hand a series of Analysis tabs which can be decoupled or move and anchor in a different location if we wish.
Some of the functionalities when using WPA are
- Analyze WPA view profiles
- Describes the query syntax used in WPA searches.
- Analyze the WPA opening of an evaluation
- Multiple views of comparative analysis, with which it will be possible to compare the results of two different traces.
- Windows Store application analysis
2. How to access WPA in Windows 10
Step 1
To access Windows Performance Analyzer we have the following options:
Option 1
In the Windows 10 search box enter wpa and there select the utility
Option 2
Go to Start menu / Windows kits / Windows Performance Analyzer
Option 3
Click on the "Start" menu and look for it in recently installed applications in Windows 10
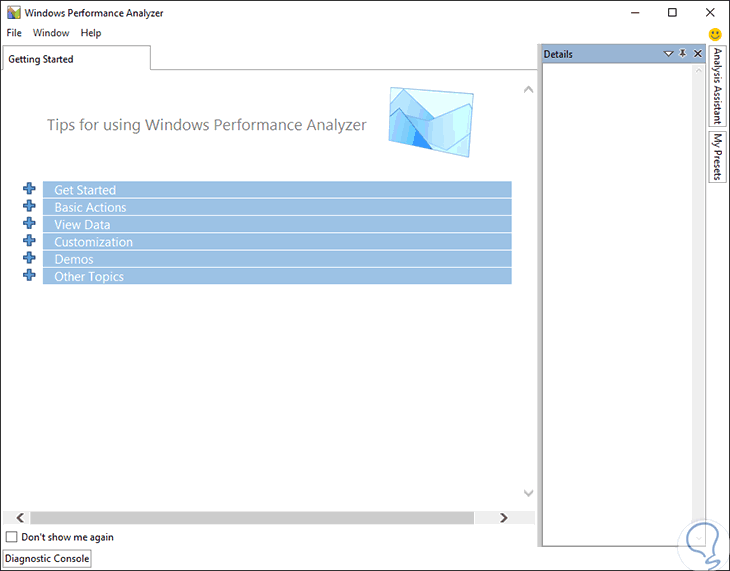
Step 2
When accessing WPA for the first time, the following will be displayed. There we find the following sections:
Get Started
It offers instructions for three basic scenarios: open a trace file, configure symbols and apply a profile in WPA.
Basic Actions
In this section we find instructions on how to use the Analysis Assistant, highlight a time interval and expand, search or filter data.
View data
Through this option we find explanation for graphs and data tables
Customization
It gives us advice on how to customize WPA
Let's give
This section includes links to videos where it will be possible to see the basic principles of Windows Performance Analyzer (WPA), advanced customizations and analysis of the store application in order to improve our user experience.
Other topics
It includes a link to the MSDN Development Center, and has traditional performance issues.
Step 3
Undoubtedly one of the most useful options of WPA are the graphics generated which give us detailed information about the data that was collected by WPR, the graphics available in Windows Performance Analyzer by category are:
System activity
- Transitional Process Tree
Team
- CPU usage detailing usage per process, use of DPC and ISR per module, use per priority, context change per CPU, chronology per CPU, timeline per process and more.
- DPC / ISR, detailing DPC / ISR duration by module, function, CPU, DPC chronology by module and function, ISR Timeline by module or function.
Storage
- Mini delay filters, highlights the timeline by driver, process, thread and accounts by Mini-Filter
- Disk usage detailing disk usage and priority, activity by IO type, account by IO Type, account by process, disk displacement, service time per process or route name, size per process, route name or stack, performance by process or type of IO and more.
- Records, analysis by operation, process or key, time elapsed by operation, process or key and more.
- Input / Output (I / O) files, highlighting account by type, activity by process, thread or type, duration by process, thread or type, size by file name, process or stack for read / write
.
Memory
- VirtualAlloc Commit LifeTimes
Energy
- Processor use and much more.
To view any of the reports recorded with WPR, go to the "File / Open" menu or use the following key combination:
+ O Ctrl + O
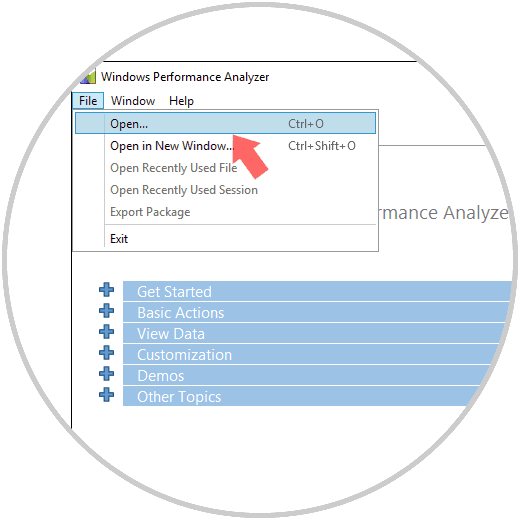
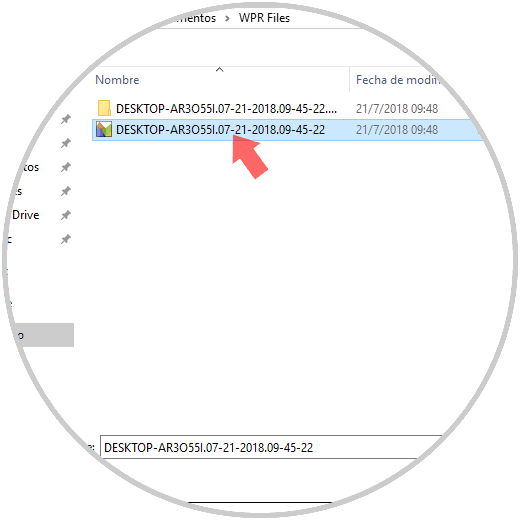
Step 4
There we will navigate to the generated report. Click on "Open"
Step 5
The process of loading the report will begin:
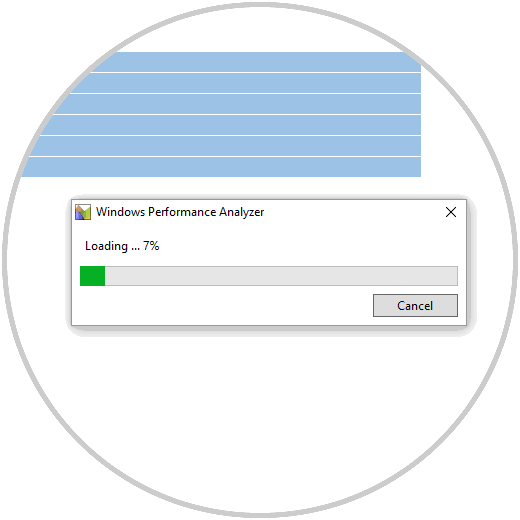
Step 6
Once loaded we will see the following:
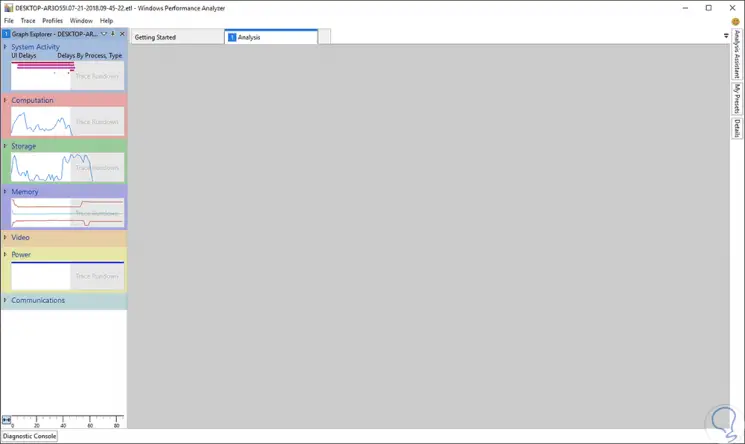
We can drag some of the lateral options towards the center panel for a much more complete and detailed information of the data:
This WPA panel consists of the following elements:
Analysis Tab
It is the central work area of ​​Windows Performance Analyzer (WPA) since from it we can analyze the recordings, there we explain the meaning of the lines or bars in the graph by clicking on the desired space and it is possible to use the right drop-down arrow in the title bar of the chart to change from a line chart to a stacked line chart or a stacked bar chart in search of the best view of the data.
Analysis Assistant Window
When you select a chart or a data table, the information about that particular chart and table is displayed with the Analysis Assistant and from there we can add or improve the display options.
Error window
This is useful when we have created the recording in the Evaluation Platform, the error or problems window lists the problems that identify the evaluation. This window is docked in the upper right corner, so if we have not created the recording in the Evaluation Platform, this window is minimized because there is no data to display.
Details window
This window offers details about the selected problem and the recommended solutions for it.
Diagnostic Console Window
Located at the bottom, and its function is to provide a list of exceptions in the recording and details associated with the loading and decoding of symbols.
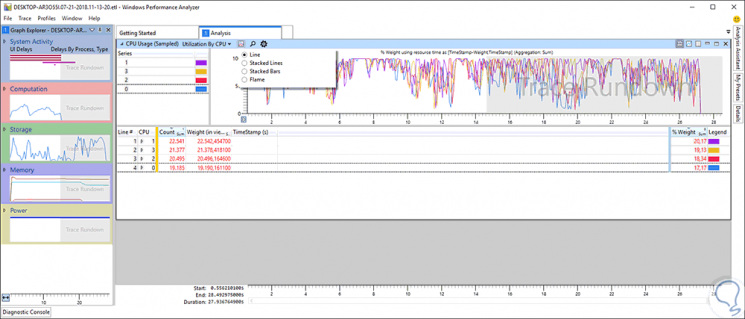
We can select the type of graphic desired by clicking on the drop-down arrow:
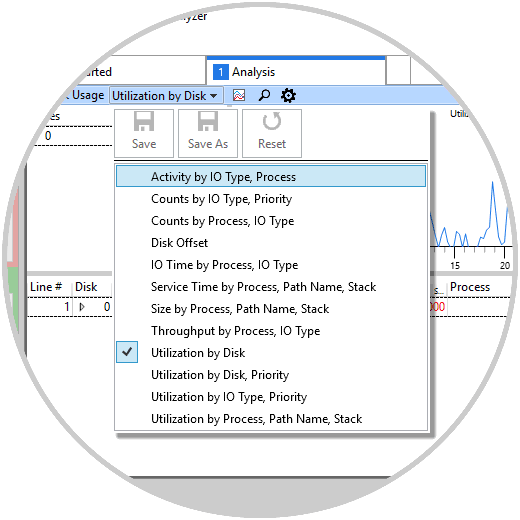
We can see how the results vary based on the selected criteria:
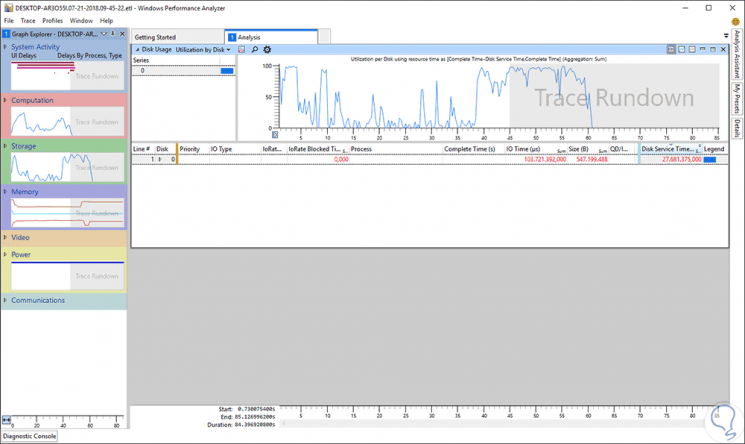
Step 7
In the "System Activity" graph we find the way in which each Windows 10 process consumes hardware resources on the computer:

Windows Performance Analyzer focuses on performing a detailed analysis of the CPU, which is one of the fundamental hardware components for system performance, for this, in WPR it is ideal to activate only the CPU box to obtain detailed results in areas such as:
Processor usage management
This section covers details such as Processes, Threads (Threads), Deferred Procedure Calls (DPCs) and Interrupt Service Routines (ISRs).
Aspects such as:
- CPU frequency graphics with details such as minimum and maximum duration, frequency in MHz,% duration, etc.
- Use by process or priority and much more.
WPA settings
As we have mentioned, it is possible to obtain various types of visualization of the graphics and other parameters in this tool.
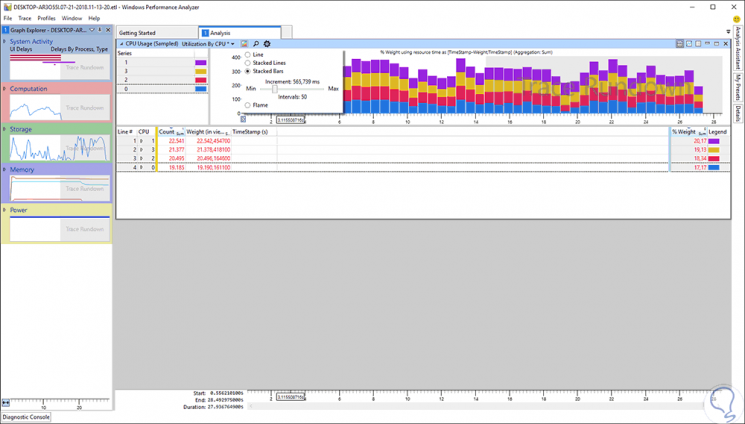
Step 8
To obtain another type of graph, we click on the Select Chart Type icon and define the desired one:
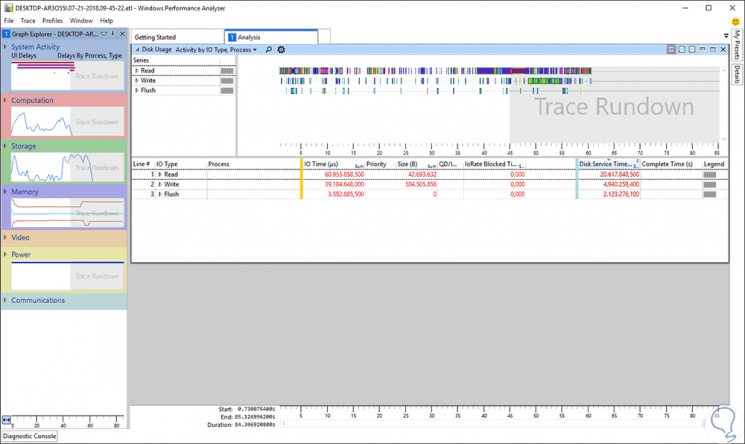
Step 9
Based on the type of chart to use, we can specify certain parameters:
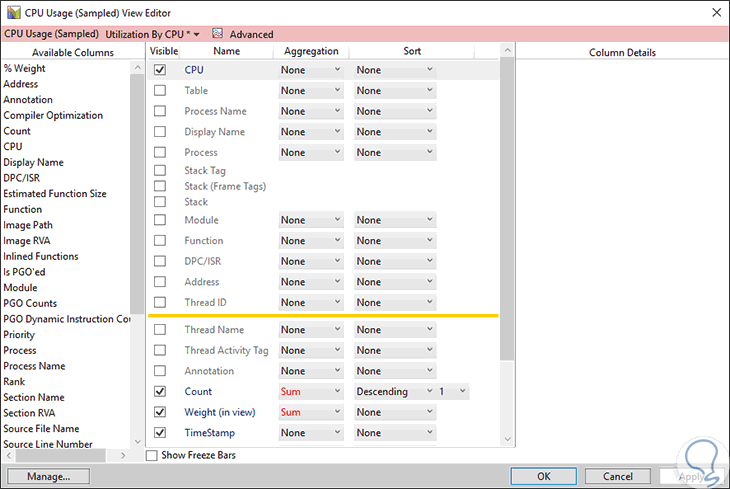
Step 10
The gear icon (Open View Editor) allows us to define how the data will be represented in the graphs:
Some useful keyboard shortcuts for using WPA are
Open a new track or session
Open a new crawl or session in a new window
+ MAYÚS + O CTRL + SHIFT + O
Deploy and navigate to Graph Explorer
Open a new comparative analysis view
+ MAYÚS + N CTRL + SHIFT + N
Go back to the previous analysis view
Display the WPA help site
Close the current analysis view
Close all analysis views
+ MAYÚS + W CTRL + SHIFT + W
Change the name of the current analysis view
Open the current duplicate analysis view
Open the preset selection drop-down menu
Focus column headings of the data table
Display only the data table
+ MAYÚS + T CTRL + SHIFT + T
Generate only the chart
+ MAYÚS + G CTRL + SHIFT + G
Displays both the chart and the data table
+ MAYÚS + B CTRL + SHIFT + B
Zoom to the selected time range
Zoom in the new view
+ MAYÚS + . CTRL + SHIFT + .
Zoom out
+ SHIFT + - CTRL + SHIFT + -
Zoom in or out of content
+ rueda de desplazamiento del ratón CTRL + mouse scroll wheel
Scroll left or right
+ rueda de desplazamiento del ratón SHIFT + mouse scroll wheel
Highlight the selected time range
Delete the highlight
+ MAYÚS + M CTRL + SHIFT + M
Search in the column of the data table
Find the following occurrence in the data table
Find a previous occurrence in the data table
Copy a cell from the data table
Navigate to the last row of the data table
Open the preset selection drop-down menu
Expand all graphics in Graph Explorer
We can see how these two tools, WPA and WPR, become a valuable tool to be clear about the state of our system and its internal components to take the best performance or management measures on them.
It is a free option created by Microsoft through which we can list hundreds of useful results regardless of the type of task to be executed.