The CPU is a central part of our equipment and it is through it where millions of processes of the entire system and user orders pass, and the technical specifications of the processor (cores, threads, speed) are of great importance..
But additionally, the daily management of this temperature is one of the most essential, the reason is super vital, if the CPU temperature exceeds its maximum levels it is possible that the equipment restarts, crashes or shuts down suddenly, currently the temperature Normal working temperature ranges between 40 and 65 ºC (104 and 149 ºF), above these levels it is considered high risk and the causes of a high temperature are:
- Excessive use of equipment
There are some utilities that will help us to validate the CPU temperature in Windows in real time.
To stay up to date, remember to subscribe to our YouTube channel!
SUBSCRIBE ON YOUTUBE
1 See CPU Temperature using Ryzen Master (AMD)
This is an exclusive application for AMD processors with which we will be able to perform actions such as:
- Access controls to manage processor and general system configurations
- It has a "Game mode" profile which is a group of preconfigured settings for when using a game
- It is possible to manage memory voltage or memory control
- Allows you to disable CPU cores
- We can disable multithreading simultaneously
Step 1
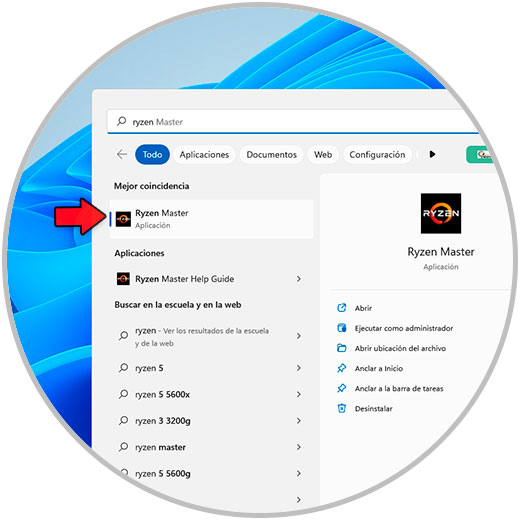
To use it open Ryzen Master:
Step 2
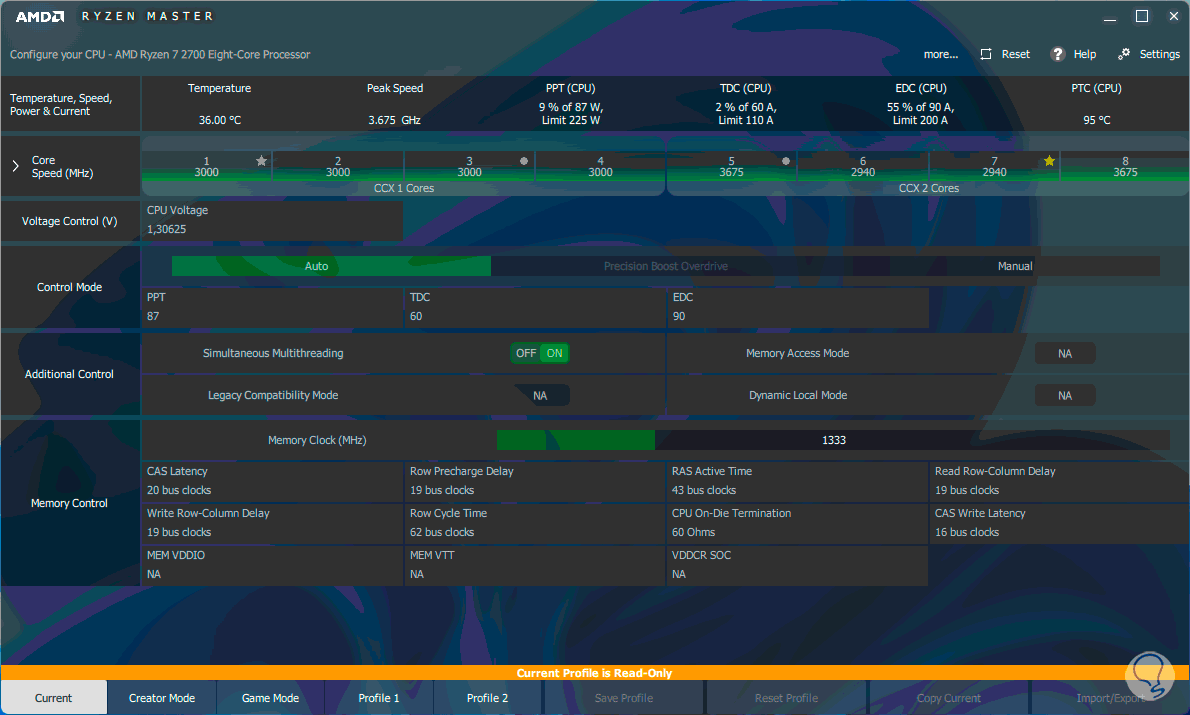
In the app in "Temperature" we validate the current temperature of the CPU:
Note: if you do not have Ryzen Master, you can download it at the following link:
Ryzen Master
2 View CPU Temperature using HWMonitor
HWMonitor is a utility that allows us to monitor hardware focused on reading system health sensors such as voltages, temperatures, power, fan speed, uses, clock speeds, etc.
Step 1
Its download is available at the following link:
HWMonitor
Step 2
Some of its most outstanding features are:
- Monitors hardware at the CPU and GPU level
- Compatible with SSD drives and hard drives via SMART
- Compatible with AMD Ryzen 9 7950X, Ryzen 9 7900X, Ryzen 7 7700X, Ryzen 5 7600X, Intel Core i9-13900/K/F/KF, Core i7-13700/K/F/KF, Core i5-13600/K/ CPUs F/KF, Core i5-13500, Core i5-13400 and Core i3-13100
Step 3
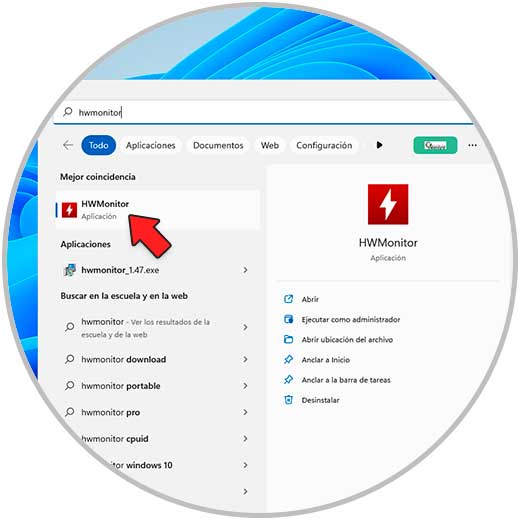
For its use we open HWMonitor:
Step 4
In the application, under the CPU line, place the temperature in "Temperatures":
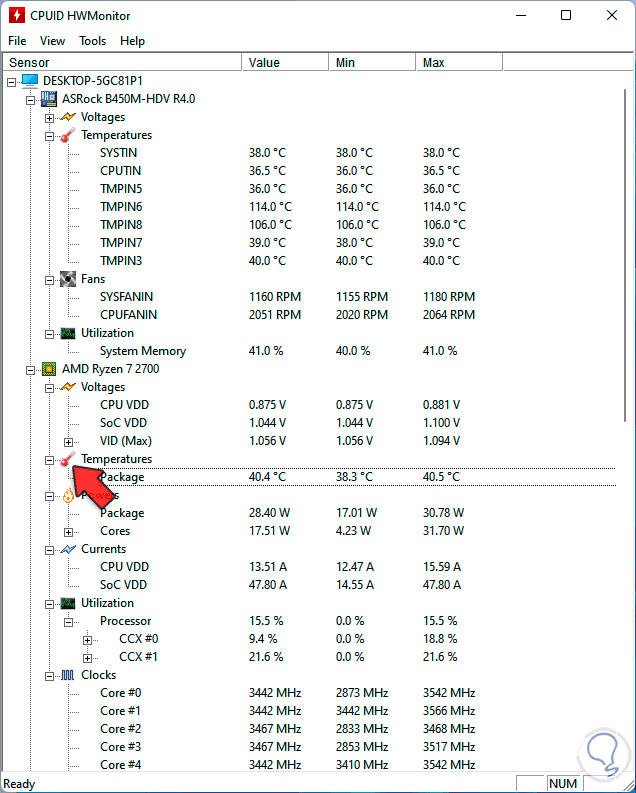
We find the current value as well as the minimum and maximum temperature..
3 View CPU Temperature using Open Hardware Monitor
Open Hardware Monitor has been developed as an open source software which monitors the sensors of temperature, fan speed, voltages, load and clock speeds of our equipment, it is compatible with most of the hardware monitoring chips in the present.
Step 1
Its download is available at the following link.
Open Hardware Monitor
Some of its features are:
- Compatible with Nvidia and AMD GPU sensors
- It is compatible with SSD hard drives and SMART technology
- Support for most motherboards
Step 2
To use this application we must open Open Hardware Monitor:
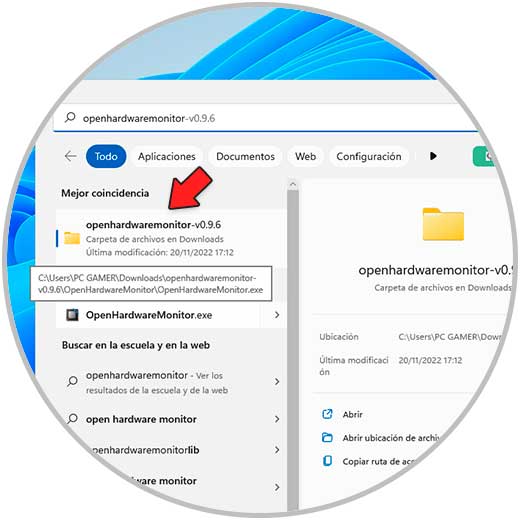
Step 3
Under the CPU section you find the current CPU temperature:
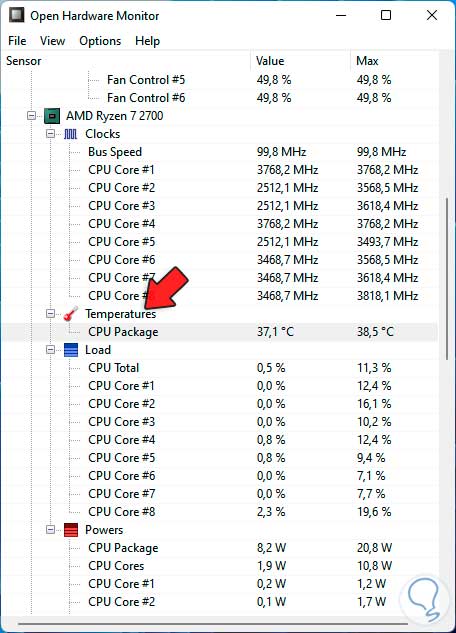
There we find minimum and maximum temperature of the CPU.
4 View CPU Temperature using Core Temp
This application is ideal for monitoring the temperature of the processor and accessing other essential information, with Core Temp we can validate the temperature of each individual core of the processor in the system, its use is given thanks to the "DTS" (Digital Thermal Sensor - thermal sensor digital) integrated into the CPU.
Step 1
Its download is available at the following link:
Core Temp
Step 2
Open Core Temp from Start:
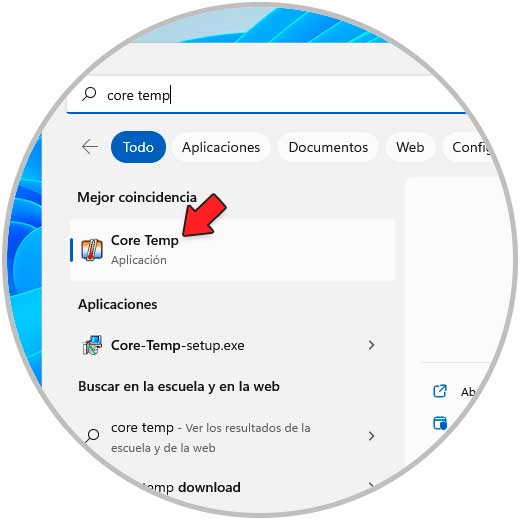
Step 3
At the bottom we find the CPU temperature:
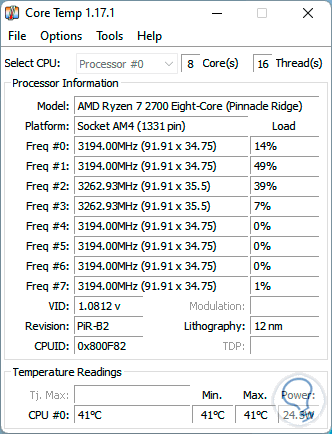
Step 4
There we can go to "Options - Settings" to access its configuration:
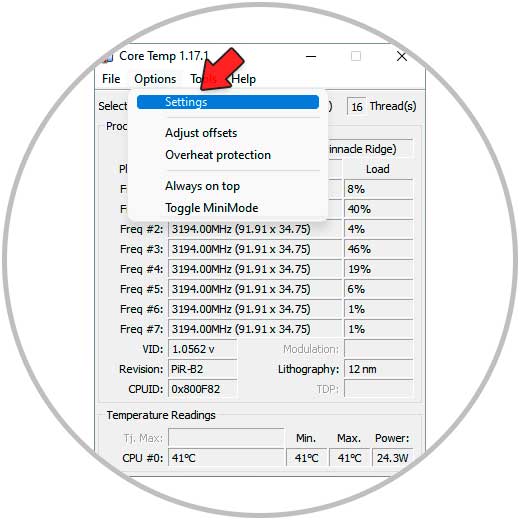
step 5
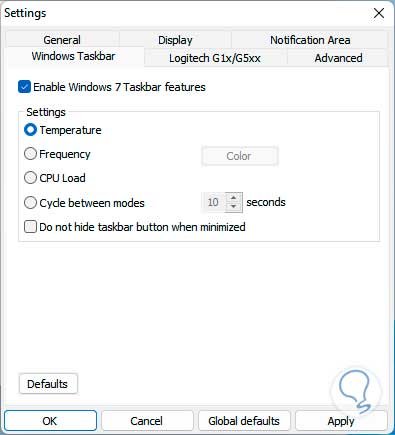
In the "Windows Taskbar" tab, we activate the "Enable Windows 7 Taskbar features" box and leave the "Temperature" box active so that the CPU temperature monitoring is taken:
5 View CPU Temperature using Speccy
Speccy is one of the most complete applications to perform not only temperature monitoring but many other extra activities, with Speccy we will have full access to details of our equipment's hardware and software.
Step 1
We can download it at the following link:
Speccy
Some of its advantages are:
- Allows you to save snapshots or system captures
- Access to detailed reports
- Offers various configuration options
Step 2
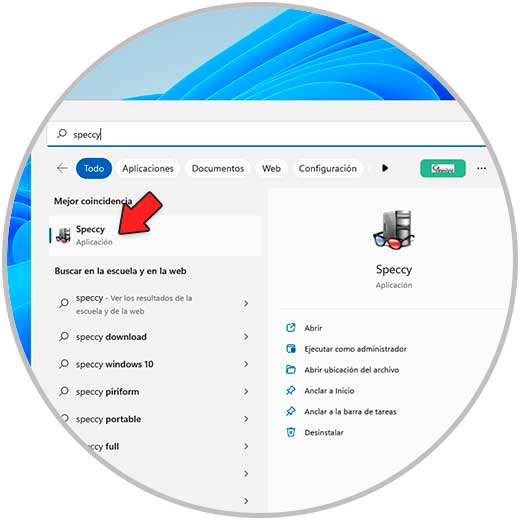
Open Speccy:
Step 3
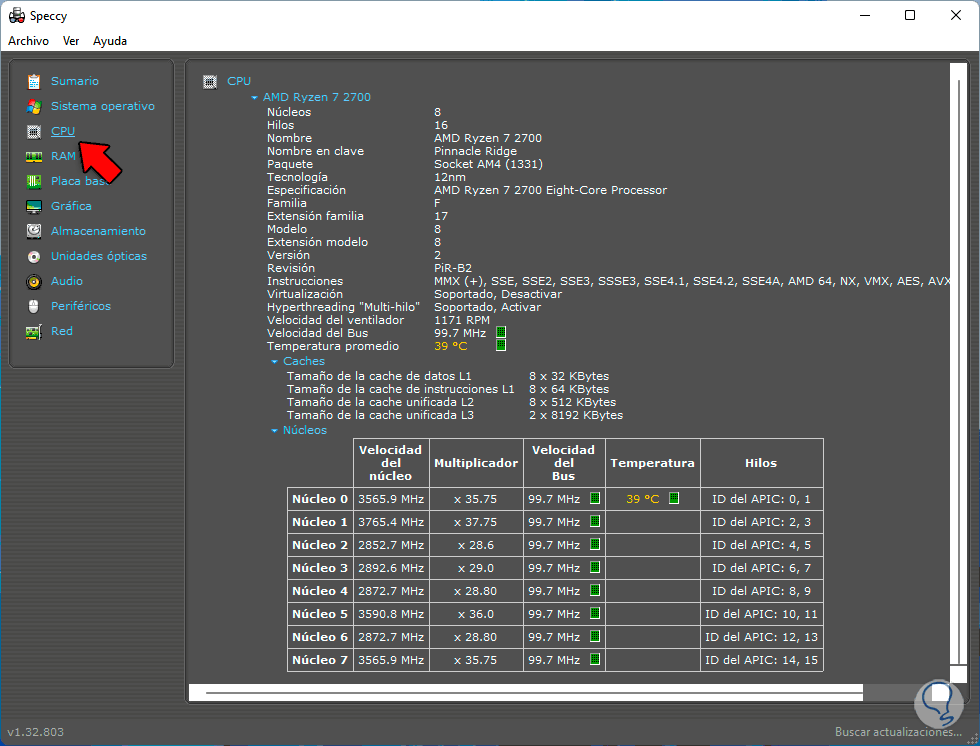
In the main window go to "CPU" to find the current temperature:
Step 4
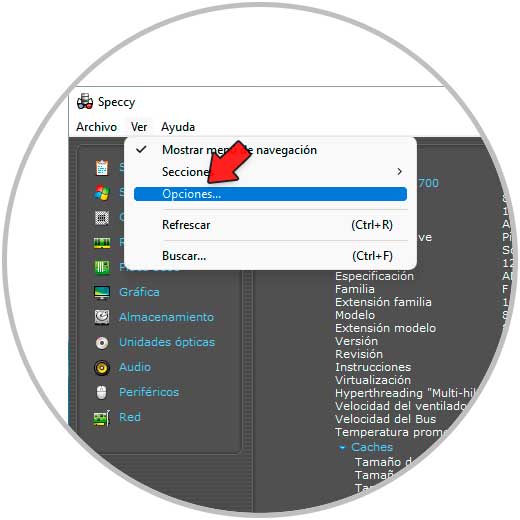
We go to the "View - Options" menu:
step 5
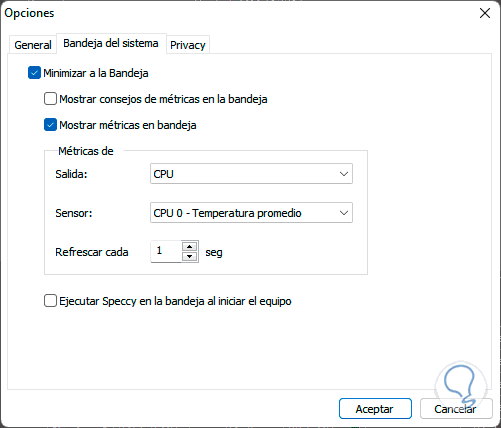
In the pop-up window in "System Tray" we activate the "Minimize to tray" box, activate "Show metrics in tray" and select "CPU", this to see these metrics in the taskbar:
6 View CPU Temperature using SpeedFan
SpeedFan has been created as a utility to monitor voltages, fan speeds and temperatures in computers where your CPU has a hardware monitor, additionally it is possible to access SMART info and display hard drive temperatures.
Step 1
Its download is available at the following link:
SpeedFan
Their functions are:
- Can access digital temperature sensors
- Allows you to change the fan speed
Step 2
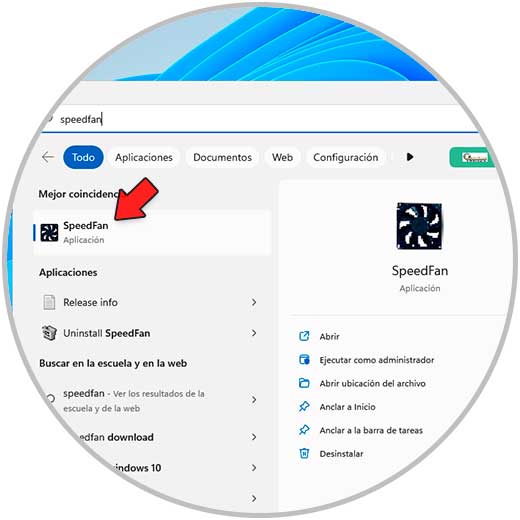
Open SpeedFan:
Step 3
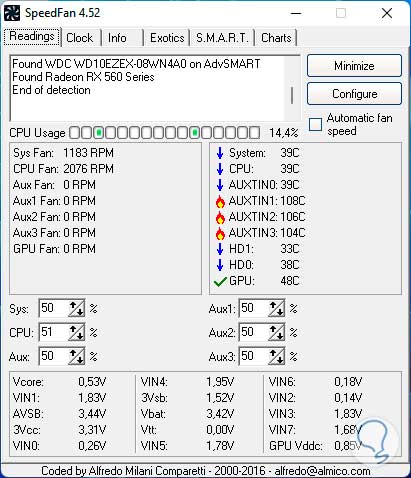
We wait for the metrics to load and on the right side we find the CPU temperature:
Step 4
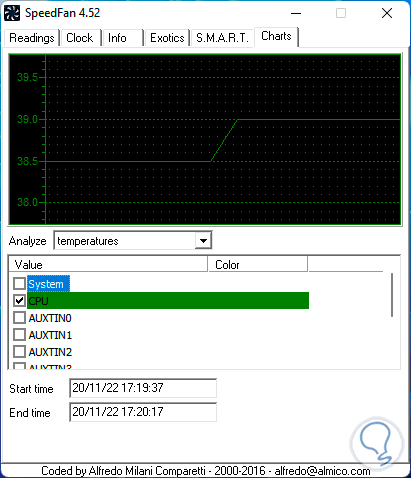
We go to the "Charts" tab, select "CPU" and it is possible to access metrics in time ranges:
7 View CPU Temperature using HWInfo
HWInfo is another option to know the CPU temperature since it performs a compatible hardware analysis and monitoring to list the details in real time not only of the CPU but of all the hardware components, some of its actions are:
- Extensive data reporting software information
- Detailed information about the hardware
Step 1
We download the utility:
HWInfo
Step 2
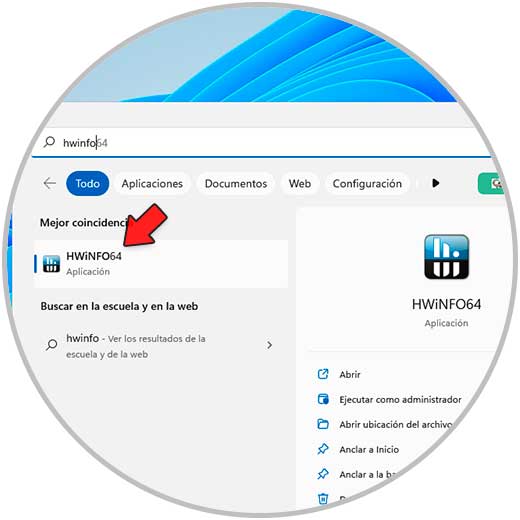
We open HWInfo:
Step 3
We click on "Start":

Step 4
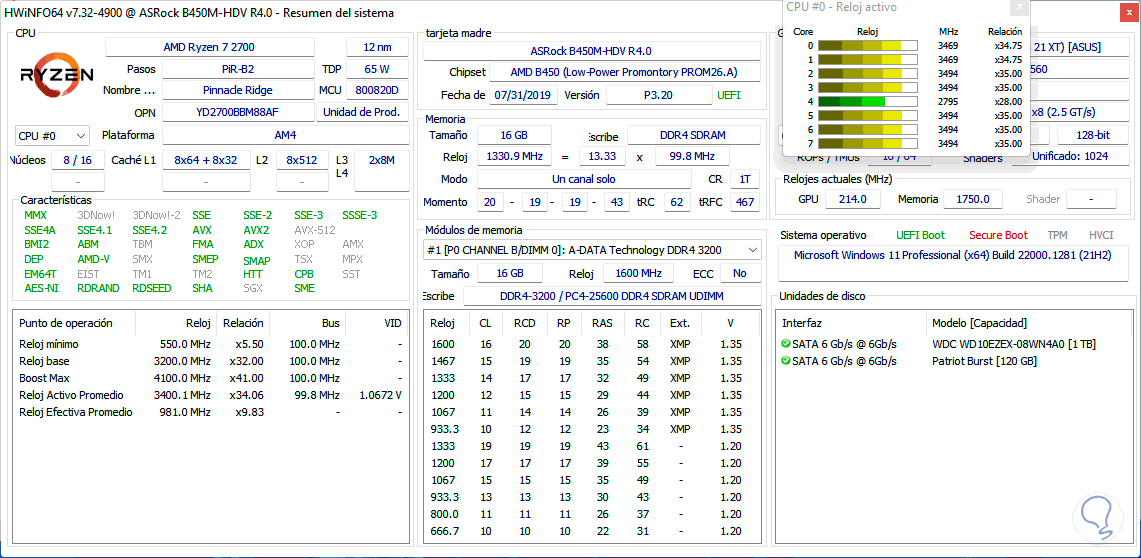
In the initial window you will find complete hardware details:
step 5
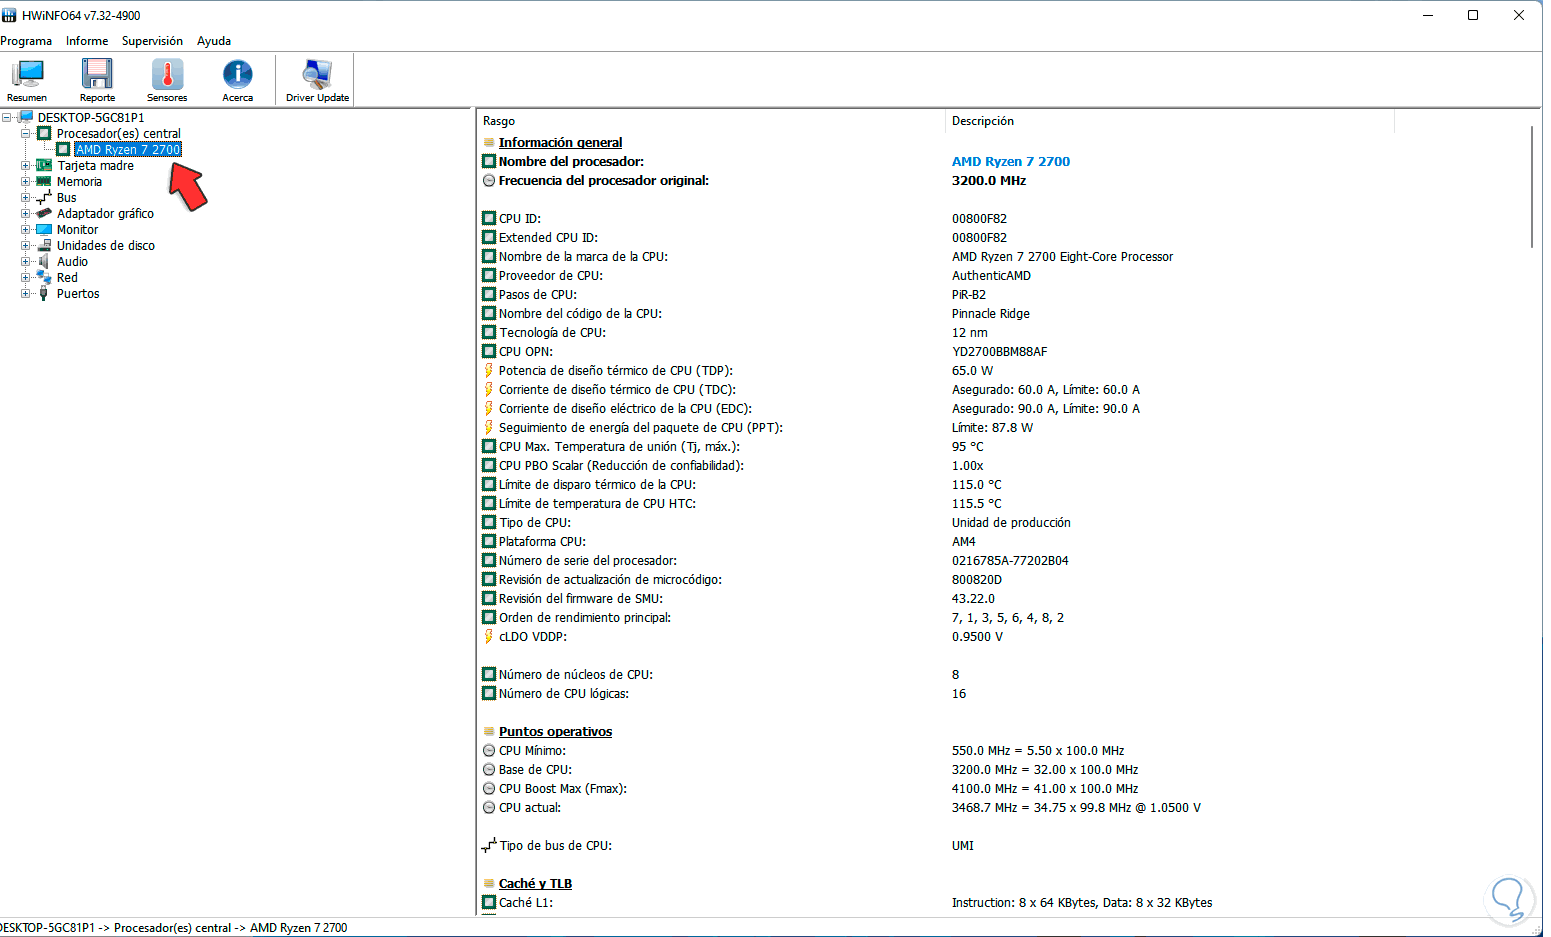
We close this window, now we go to "Central processor(s), select the processor and locate the temperature:
step 6
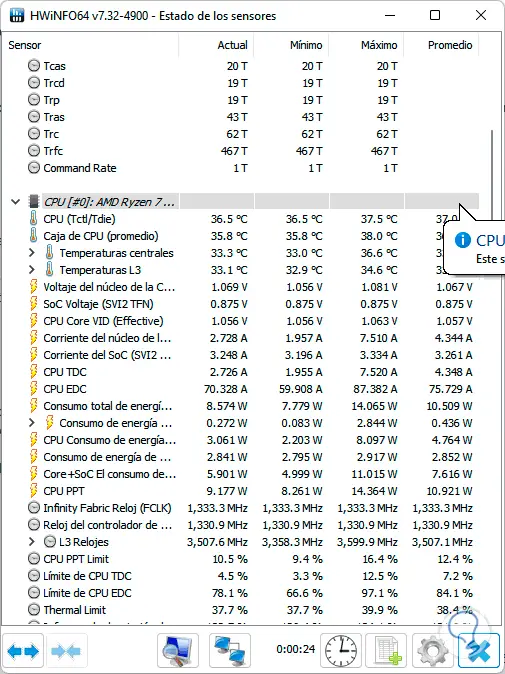
We click on "Sensors" and under the CPU the current temperature will be detected:
step 7
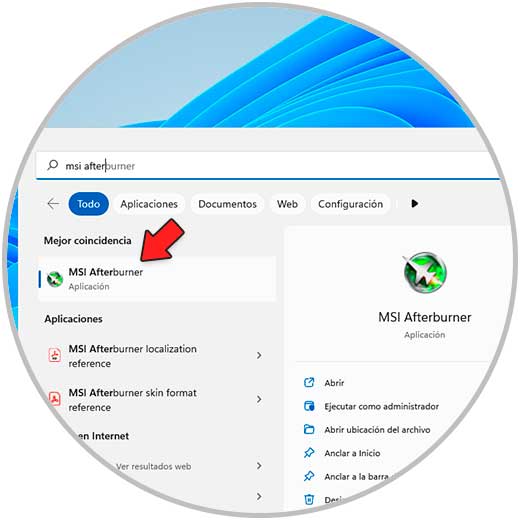
It is possible to right click on the temperature line to access various settings:
8 Check CPU Temperature using MSI Afterburner
This is a utility for MSI motherboards but it is compatible with other models to generate the necessary information, we can download MSI Afterburner at the following link:
MSI Afterburner
Their characteristics are:
- Integrates Overclocking tools
- OC SCANNER function which is an automated function to detect the ideal stable overclock setting for the card
- Allows you to create profiles for fans
Step 1
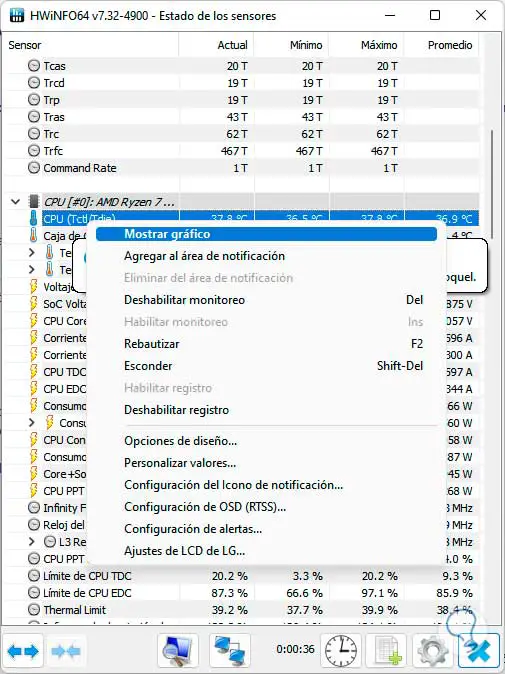
Open MSI Afterburner from Start:
Step 2
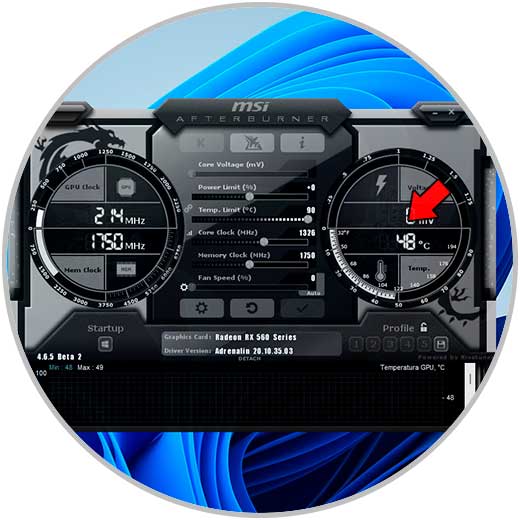
Find the temperature on the right side of the app:
See CPU Temperature using AIDA64 Extreme
This is another of the simple apps to know in detail the current CPU temperature, within the various functions we find:
- Support for Microsoft Windows 11 2022 and Windows 10 22H2 2022 update
- Improved support for Socket AM5 and Z790 chipset motherboards
- GPU details for Intel Raptor Lake
- Support for modern OpenCL GPGPU hardware technologies
Step 1
The download of AIDA64 Extreme can be found at the following link:
AIDA64 extreme
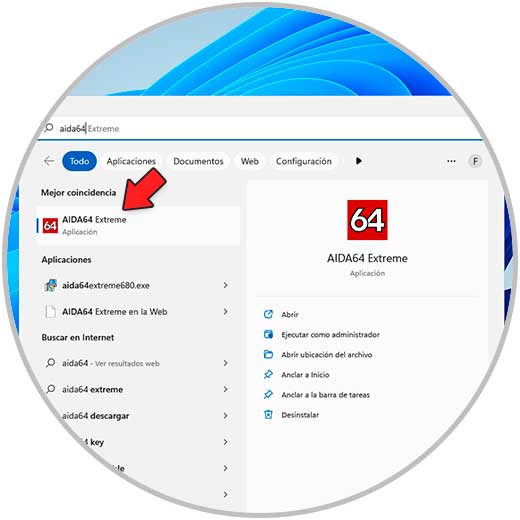
For its use we open AIDA64 Extreme from Start:
Step 2
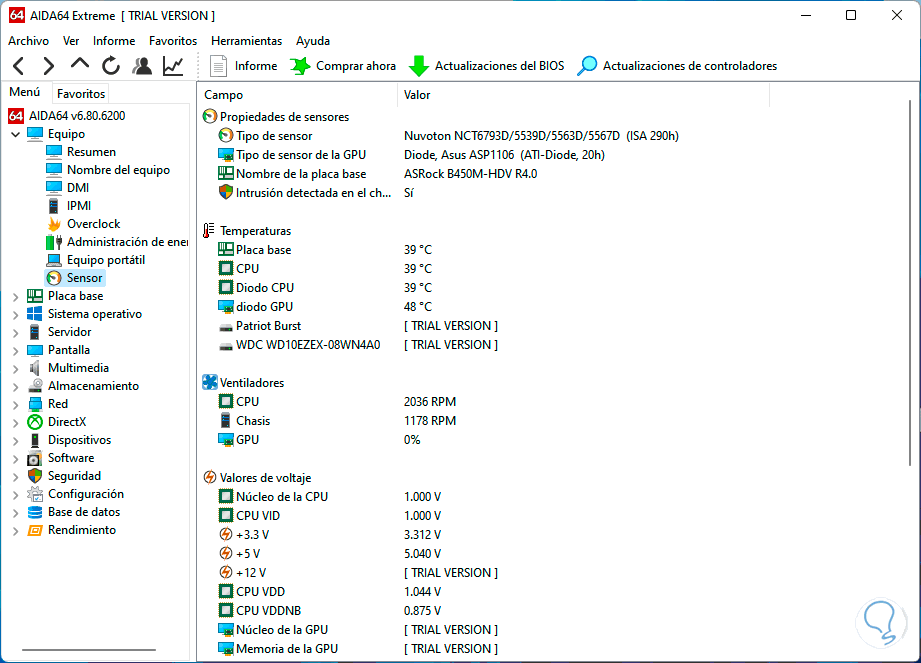
In the displayed window we will go to "Equipment - Sensor" and there in the "Temperatures" section locate the current CPU temperature:
We see how each of these applications is ideal for knowing the CPU temperature in real time and thus knowing if it is necessary to take action on it..