The Power Bi query editor is a Power Bi tool with which we must come into contact as soon as we access the Power Bi program; When we open Power Bi, and import data from a program like Excel, we have the option of loading the data directly into the program, or we have the option of transforming it..
If we choose the option to transform the data, Power Bi will directly open the data that we are importing from the Power Bi query editor, a tool from which we can work with the transformation of the data.
As we have already seen what it is and what it is for transforming data in Power Bi, when working with data projects and preparing professional reports, we must start the work from the foundations; In this case, we are talking about ensuring that the information with which we are going to work meets the following requirements:
- Correct information: Make sure that the information with which we are going to work is correct and there are no errors in the data
- Complete information: We have to make sure that the data with which we are going to work is correct, yes, but it must also be complete: contain all the necessary columns to be able to prepare the reports completely. We have to see if all the important values or KPIS that we want to show later in the reports are in the data, if all the KPIS are reflected in the information
- Review data structure: The information, as we are explaining, must be correct and complete, in order to establish a solid, reliable and truthful base with which to work without errors, where all the information necessary to make the reports is. All this information must be collected with an adequate structure where the information has a logic structured in columns; Although we think that it is obvious, and that the data will always be collected with a structure, the truth is that this is not always the case. When exporting or working with other programs, we can find information that is not properly structured. We can find data that does not have, for example, column names, that some columns do have a header, and others do not, that have blank columns, or that the information is simply not structured in columns. These are just some examples. For this reason, it is convenient to carry out a review, to verify that the data is reliable and has a valid structure with which to work: separated and properly categorized information in columns where each column has a header. (In case of not having a header, we will see later how to add it)
- Review of the format: add, in addition to everything we have mentioned, the need to review the format of each column with a single purpose, which is none other than to capture the information in the most appropriate format, in the format that we want to apply to each column, thinking about the final reports, how we want them to look. For example, if in a column of our data we have dates, we must give that column the appropriate date format. If, on the other hand, they are value columns, make sure that the data within Power Bi is displayed as values, or if they are columns with text information, they are considered as such within the table.
How important is the transformation of data in Power Bi
As we already discussed in how to transform data in Power Bi, this is a step that, despite being tedious, is perhaps the most important when creating a reporting or modeling project. Because? Simply because we are establishing the database from which to work. Any errors, or lack of consistency, lack of formatting, etc. It will result in reports that are not correct. In other words, Power Bi is a very powerful modeling and reporting tool that helps us a lot, as we will see later, in the creation of tables, visualizations, graphs, and panels to be able to work intuitively, dynamically, establishing an automation mechanism.
However, although this part of the final process can be created in a simpler, more automatic, and intuitive way, the truth is that we must put our effort into making the necessary checks and transformations on the data. The reason is very simple: it is in this part of the process where more mistakes are commonly made. If we fail in this part of the process, what we do from now on will not be correct.
We have seen many cases where the style, the design of the reports, and the structure is masterful. And yet at the moment of truth they are not useful, they lead us to make wrong decisions, or they simply do not work because they are not correct. In the best of cases we will be able to detect that the reports are not correct, but it must be taken into account, especially when the volume of data with which one works is large, that one or several errors at this moment is likely to be difficult. to detect..
Is it therefore important to ensure the veracity of the information with which we are going to work? You already know the answer, there are plenty of reasons to dedicate time and resources to this phase of the project. And in this sense and context, it is better understood why Power Bi has an editor with which we can make changes to our data.
Let's remember, how we discussed in what the data transformation in Power Bi is for, the important pillars that explain the importance of this part of the process:
- Coherence and purification , to ensure the veracity of the data, eliminating what is not true
- Standardization: Always keep in mind and work with a standardized nomenclature will save us many problems and headaches. It is a fundamental aspect, as we already explained, to be able to synthesize the information correctly.
- Structure: having the information, our data perfectly organized, with a logical structure, separated into columns, without errors, with headers in each column, without empty rows, will be a guarantee to be able to create the professional reports that we are looking for
1 How to open Power Bi Editor?
We need to open the Power Bi editor in order to transform the data and build a valid data model as a base to start building (Reports, Dashboards, dashboards,...). As we already told you about how to transform data in Power Bi, we have two main ways to open the editor in Power Bi
- The first, right in the process of importing the data, and before loading it;
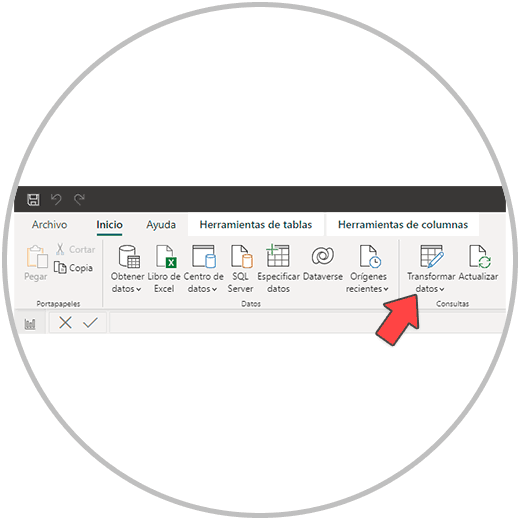
- We can also open the Power Bi editor at any time from the top menu, from “Transform data”.
In order to open the Power Bi editor when we are importing the data, we remind you that you must follow these simple steps:
Open Power Bi editor to import the data
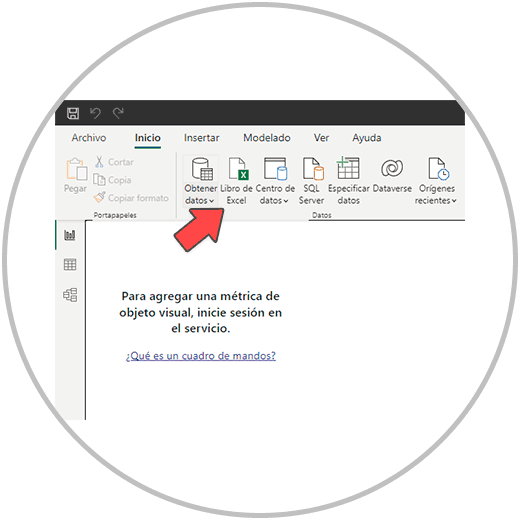
We can import an Excel file from the Power Bi "Excel Workbook" option, which we will easily find in the top menu, as can be seen in the image.
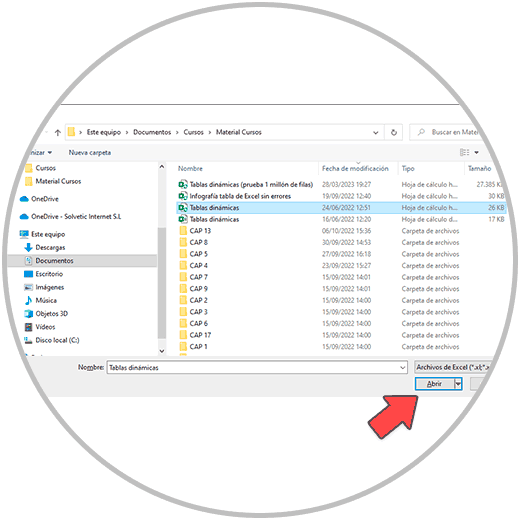
By clicking on “Excel Workbook”, we have to choose the Excel file with which we want to work in Power Bi. We select the file, and then click on “open”
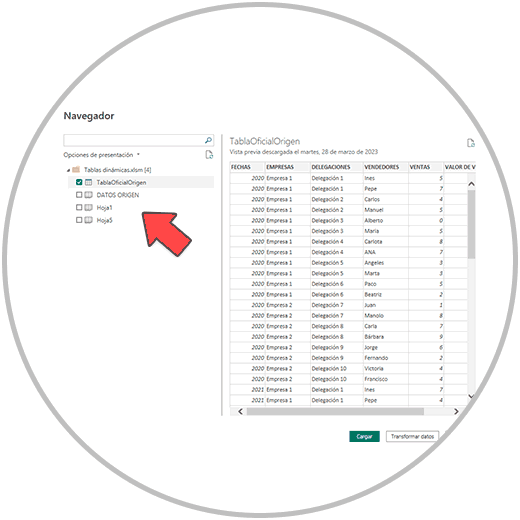
As we already know, the Excel file that we are going to import into Power Bi can be 100% integrated, with all the sheets or tabs of the Excel file, or we can, on the contrary, select the sheet or sheets within the file that really interests us. In this step, therefore, we would select the sheets that interest us from the file. Once the sheets to be imported from that file have been selected, we will see how at the bottom right we have the option to load the data.
In this case, and instead of clicking on the button to load data directly, we are going to click on the "Transform data" button
After clicking on the "Transform data" button, we will see that the Power Bi Editor (Power Query Editor) opens automatically, from where we can make all the changes, transformations, and editions in the data that we have commented on.
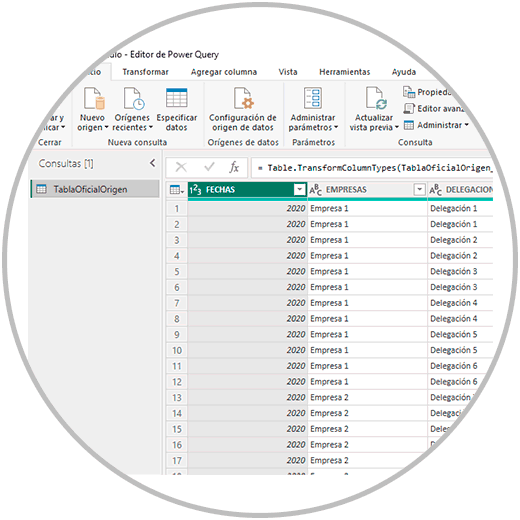
From the Power Bi editor we will be able to make editions, transformations and changes that we are going to explain below (remove duplicates, put column headers, delete empty rows, divide a column in two, make groupings, etc.)
Important
Accessing the Power Bi editor, the Power Query editor, is not exclusively something of the import process, as we have already explained. It is a tool that is available to access at any time and situation of the project.
Therefore, and although it is recommended to use it at the beginning, it is an option that we can use in case we realize that we have forgotten to make any changes to the data. We can then go to the Power Bi Desktop menu, at the top, where we will find the option "Transform Data"
2 How Power Query Editor works: most important tools
Next, we are going to see the most important options that are used most frequently in editing data, as well as the options that are most relevant from a functional and practical point of view and that we need to know to learn how to use Power Bi.
Important
The functions and tools you need to transform your data, to edit it are mainly in the menu. But you will also find how we will see editing and transformation options by clicking directly on a cell, column or row with the right button of your mouse.
Review of the data that we are importing: quick review of the data in order to ensure that we are working with the appropriate data. On some occasions it is common to start working with a version of the data that is not adequate, we have some later and it is not the one we are importing, or we have made a direct mistake when selecting the sheets of our Excel file. The first thing to do, therefore, is to check that you are importing the correct file, and the correct file sheets as well.
Check the structure of the data: Check that the information with which you are going to work is well categorized into columns, and that the data is complete.
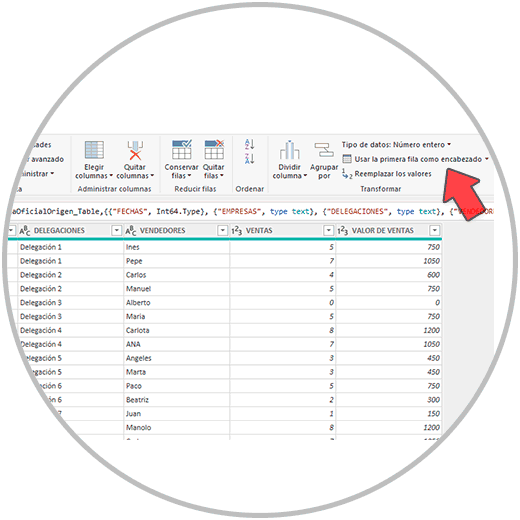
Check the headers: Let's see if our data has headers in each column or not. It is possible that, when performing the import, when we open the Power Query editor we see that the names of the columns are not there, or they are in the first row. If the data is in the first row, we will click on “use the first row as header”
If we don't have headers, nor are they in the first row, double click on the column names that have been assigned to be able to edit them and name the columns whatever you want..
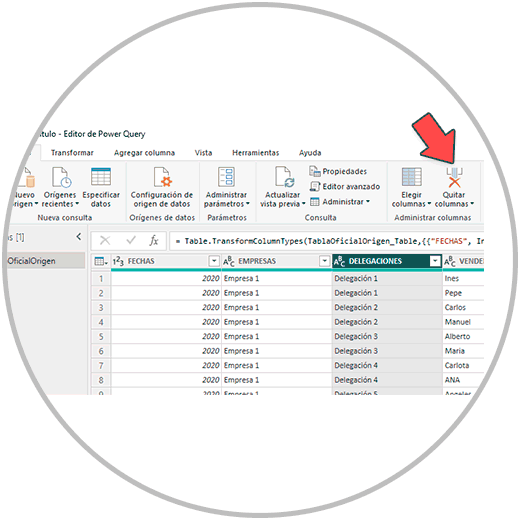
Review columns (Remove columns): We are going to check if the columns that you are going to import are the ones you need, if you need to clean up and remove some columns. In order to remove columns, you can do it from the Power Query menu itself. You select the column by clicking on the header, and click on remove columns, in the menu as you can see in the image.
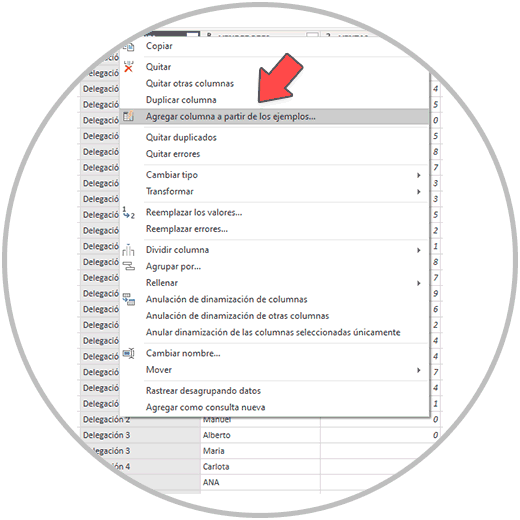
You could also right-click on the name of each column, where you will see that you have the option to “remove column”.
Duplicate or add columns: A very common situation when you work with data is to realize that you have to not only clean the information, but also add new columns that collect complementary information. In order to add a column in the Power Query editor, we can double-click with the right mouse button on any header of our table, and we will see the two options:
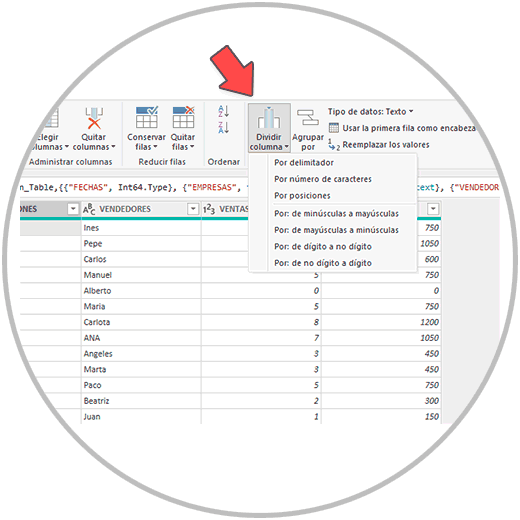
6. Split Columns: The information contained in a column is sometimes capable of being separated into two or more columns so that each column has unique information. If that were the case, from the Power Query menu you could also separate the information contained in a column and separate it with "Split Column".
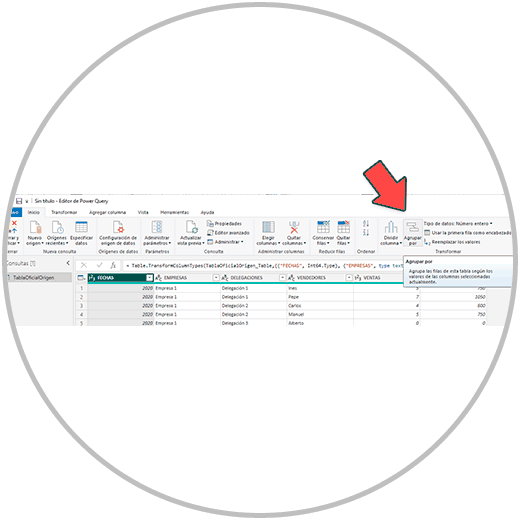
7. Grouping of columns: We can also make groups to synthesize the information by concepts that are collected within our table. If, for example, we wanted to collect a table, as in the example below with all the information by year, we would select the column, and go to the menu to find the option "Group By"
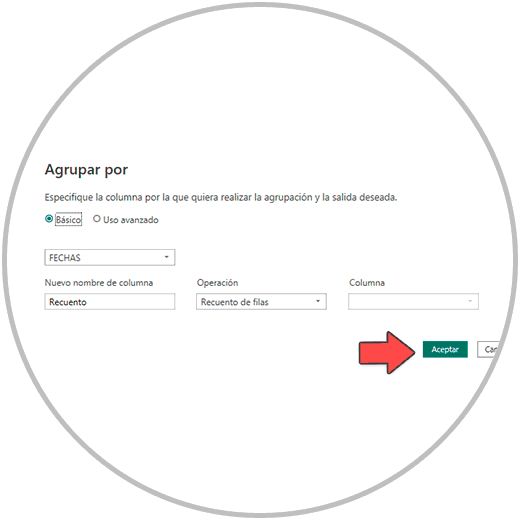
Clicking on "group by" will open a window where we choose how we want to group. We would click on OK to be able to group the data and then we would see the data grouped by the selected column and with the options that we have previously chosen.
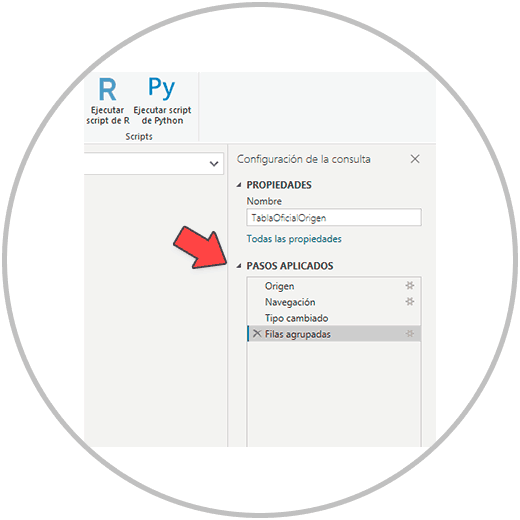
If we want to undo a grouping, we will use "query settings". A visualization that Power Bi offers to better see and control the changes.
Important
One of the differences between Office and Power BI is that "undo changes" (Control + Z) doesn't work. Unlike Office, in the Power Query Editor we have a very interesting and useful feature for change tracking, a more visual way of seeing the changes made and being able to view and undo any changes. It works like a logbook where changes are recorded, as you can see in the image below.
[/center]
8. Review columns and formats. Now review the columns once you have already confirmed or edited the headers. It is time to review the information in all the columns and the format you want to use in each one. To change the format, as well as to access other column configuration options, and as we have already seen, we double-click on the column we want to edit. A menu will open from which we can make many changes: some that we have already seen, such as removing that column, duplicating a column, splitting a column, grouping a column, etc.
In this case, to change the format of the cells of that specific column, we are going to look for the option "Change type"
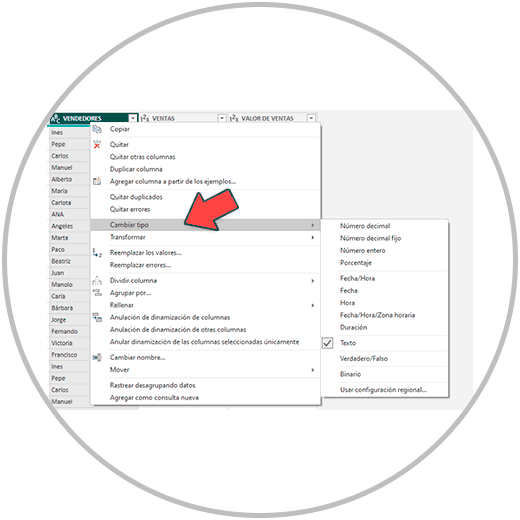
When you click on change type you will see that there are several value options that you can apply depending on whether that column refers to values in percentage, if they are values with decimals or if it is a time format.
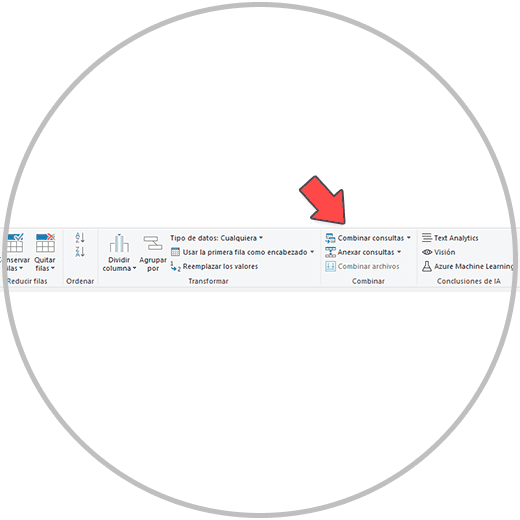
9. Combine queries: One of the most interesting options of the Power Query editor is to be able to cross data to complete in the same table, information that we have separated in several Excel sheets, in different files, or that is stored in different databases, on different servers. Combining queries in Power Bi is synonymous with unifying information, crossing data or information using a common field from which a single table is created with the information we want.
To combine queries, we go to the Power Query editor menu, and enter the "Combine queries" option.
From Combine queries we are going to see our data, and we will have to choose the other table where the data we want to unify and the type of unification we want to apply are.
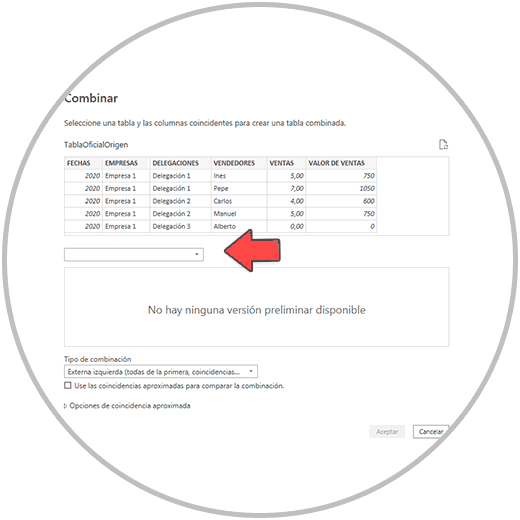
Combining data, unifying or crossing information, is an important section that we will explain in detail later due to its importance. But within the possibilities and potential of Power Bi, it is important that you learn what options Power Bi offers, and why it is a useful tool in data processing, and why financial and analysis companies and departments implement Power Bi on your teams.
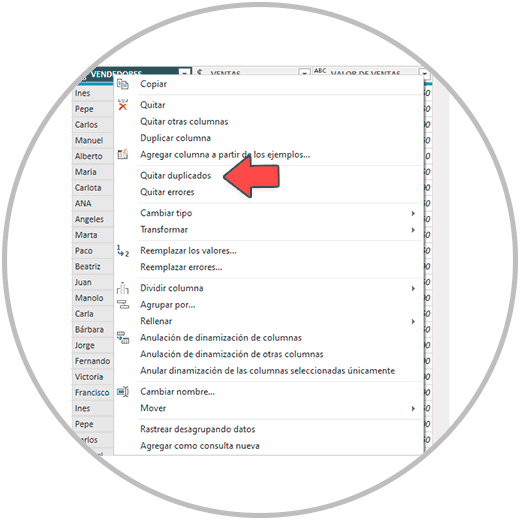
10. Eliminate duplicates: Another of the interesting functions of the Power Query editor, in tasks of cleaning data and debugging tables before carrying out reports, visualizations, etc. is the possibility of being able to eliminate duplicate data. Something that can happen, especially when we cross data. At this point, you have to be careful, the fact that a field is repeated does not imply a duplication itself. For example, if we have several sales made by the same seller on the same day, it does not mean that all those sales are duplicates. In order to remove duplicates, you simply right-click on the name of the column with the duplicate data, where we will find this "Remove duplicates" function.
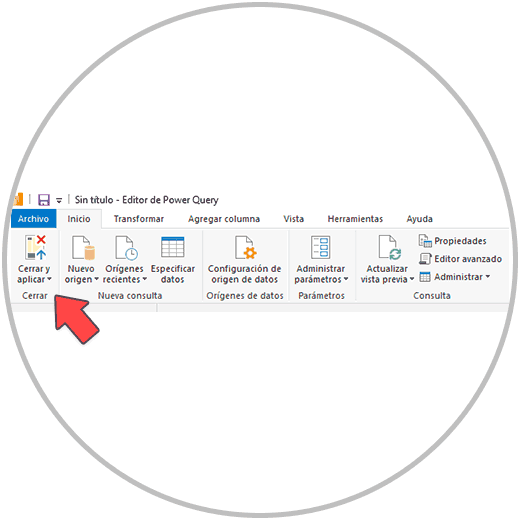
Once all the necessary changes and editions have been made, to model and make our reports, the changes are applied and we close the Power Query editor from the button that we will see at the top left as the first option in the Power Bi horizontal menu “Close and Apply"
Once the Power Query editor is closed, we will see how a window appears on the screen that indicates that now if the data is being loaded in Power Bi, to be able to make models, or perform visualizations, reports, etc.
We have explained to you why transforming the data is such an important step, and why this part of the process should be taken as a crucial step when it comes to guaranteeing the veracity of our reports. Making reports with Power Bi, as we will see later, is a task that we are going to learn very quickly, but we stress the importance of this part of the process where we have to put all the mechanisms and attention so that the data is correct.
The Power Query editor offers many options in transformation tasks; As we have commented, the ideal is that, if you are going to import Excel sheets, the task of reviewing and verifying that everything is correct is done from the Excel program itself. But after importing the data, do this one more time and use the tools provided by the Power Bi editor if necessary to clean up the data and format it appropriately. You should also take into account that you can combine tables, and that you should pay even more attention when you are unifying or cross-checking information in Power Bi; It is common to see duplicate data, errors, or bad formats in tables after combining data.
Learning from Power Bi is learning from the capabilities of the tool in data processing and reporting, but it should also help us to acquire an analyst mentality, to adopt as a culture the review of the information on which we are going to build reports. and professional Dashboards.