When wanting to work with models in Power Bi, make reports or visualizations, as we already explained in how to install Power Bi, we need to work either from Power Bi Service or we can install Power Bi desktop for free, the desktop version of the Power Bi application for computers..
When starting to work with Power Bi and creating our first reports, visualizations or Dashboard, Power Bi Desktop will help us by offering a powerful and stable tool designed to be able to work dynamically by offering an intuitive interface focused on reporting professionals.
Excel is the ideal complement to be able to work with Power Bi; In Excel we can work with our data and create tables with the desired columns and information, we can format each column according to the type of information it contains, and we can perform formulas, operations such as concatenating columns or eliminating duplicates, among many other options.
Thus, when importing the data, our data must be previously reviewed in Excel, they must be correct, we must have applied the desired format in each column, we must check above all that there are no cells with errors, or cells where information is missing , nor do we have empty rows. And as we will explain later, there must be a standardization in the nomenclatures. Something that we will already know if we have worked with dynamic tables, or have taken the TechnoWikis Pivot Tables course..
But, what would happen if, despite the review carried out in Excel, and once the changes have been imported, we want to make some change to the data? It is at this point in the project where we can already use Power Bi to be able to make these last changes or transformations in the data, once the data is already imported, and thinking about how we want to later represent it in the reports and visualizations.
This transformation of the data can be done from the Power Query editor, a Power Bi editor where we can make many changes to the imported data..
What is data transformation in Power Bi: Power Query editor
When we talk about data transformation in conversations where Power Bi is the protagonist, we talk about the changes that we can make to the data that we have imported into Power Bi, and these changes can be made thanks to the Power Query editor; We can make changes to the formats in the cells of a column, we can review the information again and eliminate, for example, incomplete information, or perform other operations in order to have a valid data model to work with (eliminate duplicates, change the structure of data, add new columns or remove unnecessary ones (these are just examples among all the options offered by the Power Query editor).
All these options and tools that Power Bi offers have a single purpose, which is none other than to transform the imported data into a valid data model with which to work and subsequently carry out reports, visualizations or Dashboards.
What is a data model in Power Bi
When we talk about a model or models in Power Bi, we are talking about the transformation of the data or information that is used in Power Bi in order to later create reports and panels or Dashboards. When we talk about modeling in Power Bi, we talk about structuring the data, on the one hand, editing it if necessary, and relating it so that the information can be later represented in reports and visualizations. Data transformation is, in other words, an important and necessary phase to carry out before building our reports (even when we have already carried out all the checks in Excel before importing into Power Bi).
1 What is the use of transforming data in Power Bi
The purpose of the transformation is to be able to cleanse, convert, combine, and edit the data. The data transformation in Power Bi helps us to be able to convert the imported data into a model that is valid to work, where the data has been cleaned and we have given it the correct format.
Always thinking about the final objective (which are the reports we want to make) will help us in this case to better understand why this step should be considered as a part of the crucial process where we are laying the foundations of what will ultimately be a professional report. .
Important
In this regard, one piece of advice that we can always apply to our Power Bi projects is to ask ourselves some questions related to the objective of our reports when we are in this phase of data transformation:
What data do we want to show in the report?
How do we want to show that data, in what format, in what way?
What data tables are we going to display?
What graphs do we want to represent?
Does our data model have all the necessary information, with all the KPIs and are they in the appropriate format?
Answering these questions will help us carry out a more objective review focused on our objective, in order to create the data model that we want and, above all, we need to build our reports.
When it comes to transforming data within Power Bi, we will find many options to prepare the data, to purify it and give it the desired final style and format.
In summary, we can make three types of changes in the transformation of the data:
- Combine data from different sources: Combine data with different sources to unify them in a single model
- Make format changes to the imported data : Once the data is imported, we can give a different format to a column that, for example, contains date data. In data transformation we can also make changes to the data structure, adding or removing information. We can add rows and columns, and we can also delete rows and columns. We can also change the proper order of the columns, and move them to the left and right according to our need. Regarding the structure of the data, we can make very interesting changes such as dividing the columns according to the characters, or if, for example, we have numerical and text information in the same cell and we want to divide it.
- Data grouping: We can also establish groupings in the information contained in the data. If, for example, we have the information on the sales of a company with the dates, which contains information on the sellers, the stores where these sales have been made, the countries where we have a presence with a store. If we have all this information, we can, for example, establish groups to see in an aggregated way the sales made by country, or, for example, the sales made by each vendor, by each store,...
- Changes to the information: We can make some interesting changes to the data such as removing empty cells or removing duplicate data.
- Ordering changes: We can also create some change in the ordering of the data, if we want to order information by establishing different criteria according to the columns of the data. But we can also make other deeper ordering changes, such as transposing the information, or inverting rows and columns.
2 Why is it important to transform data in Power Bi?
The transformation of data in Power Bi is important as part of the process or stage when working in Power Bi, as we have already seen, and we summarize below in three points:
Data consistency, cleansing
Review the data, two, three, or as many times as necessary to ensure the consistency and veracity of the data. On the one hand, as we have already explained, it is important that the data with which we are going to work is correct, does not contain errors, and is complete. The Power Query editor in this sense will help us in all these aspects, which, although they can be worked on in Excel before importing, must be reviewed and edited at home if necessary, before creating a report, visualizations or dashboards. The urgency when creating a report quickly can play a trick on us. An error in this part of the process can lead us to display reports with data that is not correct, and therefore can lead to an erroneous decision making.
Information standardization
It is in this step where we commonly find many errors in the final reports due to the lack of standardization in the information in a table. Let's imagine that we have used two or more data sources to build our data model in Power Bi. As they are different data sources, let's imagine that the name of the sellers with first and last names is represented differently. In one source, the order is name and surname, in another first the surname and then the name. In this specific case, when grouping the data, creating tables, dynamic tables or visualizing it in a graph, this information will be represented incorrectly, since the same salesperson will be represented as if it were two different salespeople.
One of the functions that Power Bi and pivot tables share is to be able to unify the information to be able to build a common table, to be able to make a graph or visualization. If the information does not have a standardization, when it comes to unifying the data, Power Bi will not be able to carry out this work successfully, since it will not be able to attribute to the same seller, continuing with the example, the sales made by having in the same table two different forms of nomenclature. Manolo Garcia, and Garcia Sanchez, Manolo. Even when referring to the same person in both cases, Power Bi will understand how they are two different people and therefore it will not be able to synthesize the information under the same person. In the final reports, this would result in an error as it was not possible to synthesize, unify or add all the information to the same person.
The standardization of information is a culture that we must apply on a day-to-day basis, always keeping in mind that the databases must be correct. We must not only think that this is something that can happen to us when we combine several data sources; When we are importing a database, or Excel table, it may contain the same errors described above. In other words, the information that we import into Power Bi may contain errors. And one of them is the lack of standardization in the nomenclatures.
Edition of the information, in the structure and in the data
As part of the transformation of the data in Power Bi, as we have mentioned, we must review the information in order to establish a data structure that is represented correctly, analyze if the data is complete or we must add information in a new one. column, for example, where we want to perform a calculation or ratio. We make these types of changes or editions of the data when we think we want to represent them in the reports. If, for example, we see that there is a ratio or KPI that we want to show in the final reports, and we see that it is not represented in our model. We can create new columns or calculated fields that complete the information in our model.
3 How to transform data in Power Bi
Now if we are going to see the necessary steps to be able to complete this phase. In order to perform data transformation with Power Bi's Power Query, we mainly have two options. (Before loading the data in Power Bi, when we import an Excel file, for example, or after loading the data in Power Bi).
Method 1
Once we import the data into Power Bi, we will see that before loading the data, we have an option that says "Transform data", as we will see later in the images.
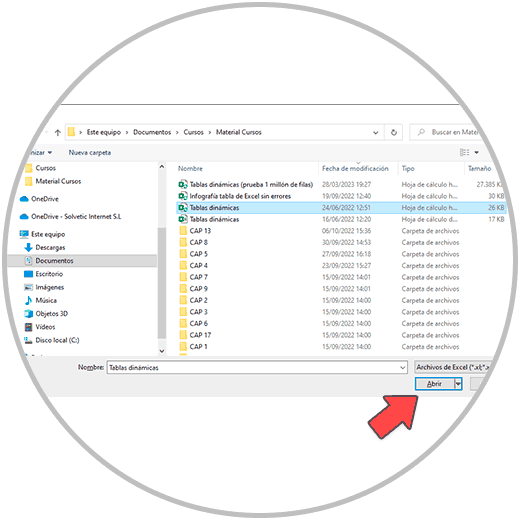
To start the process, we therefore import an Excel file from the Power Bi main menu, by clicking on “Excel Workbook” (an option that, as you can see in the image, is at the top, in the Power menu BiDesktop).

Once we click on "Excel Workbook", we choose the Excel file that we want to load, and then we click on "open" (button at the bottom right of the window)
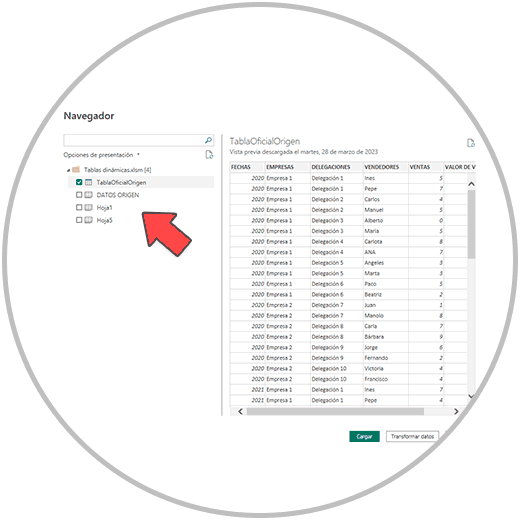
Now in the next step, is when we must choose which sheets of our Excel we want to import into Power Bi. We simply have to mark the desired sheets, where the relevant information that we want to use to later build our reports is.
In this case, and instead of clicking on the load data button, we will see a button on the right that says "Transform data" where we will click.
Once we have clicked on "Transform data" we will see that the Power Query Editor opens, from where we can make the necessary changes to be able to clean the data, organize it, structure it, and make the appropriate editions before making reports or visualizations.
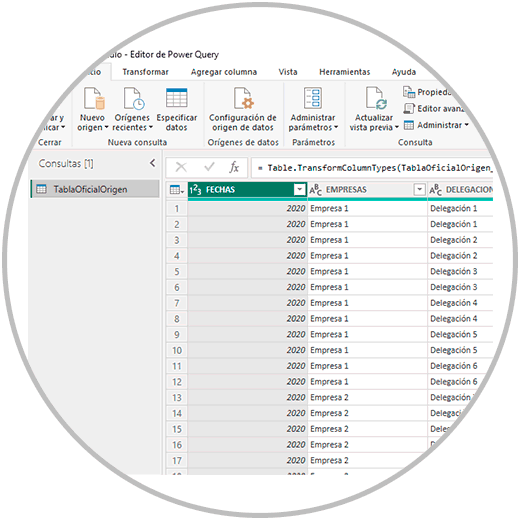
From the Power Query editor, we will be able to make the aforementioned changes, such as removing duplicates, removing empty rows, putting a column header, if it does not have one or having it in the first row of the document. We will be able to group the data, make columns dynamic, etc.
Once all the changes have been made, to be able to model or directly make reports or visualizations, we must apply the changes and close the Power Query editor, a button that is located at the top left of the horizontal menu "Close and Apply" (as as we see in the image below).
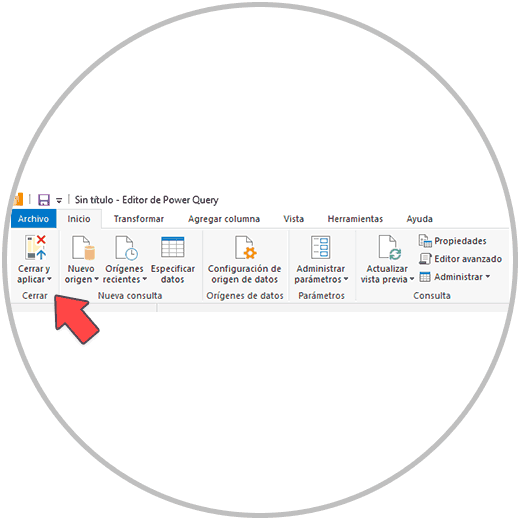
Once the Power Query editor is closed, we will see how a window appears on the screen that indicates that now if the data is being loaded in Power Bi, to be able to make models, or perform visualizations, reports, etc.
Method 2
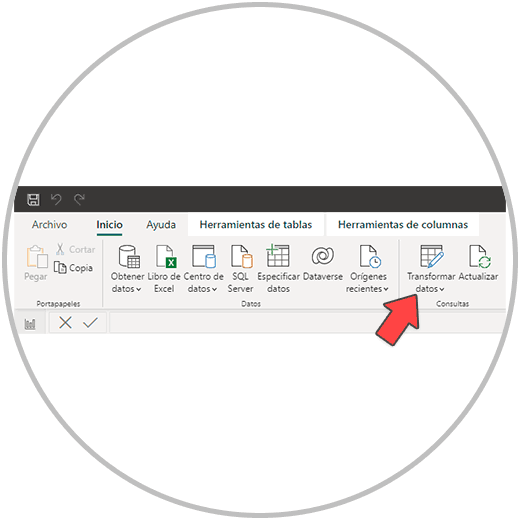
If at any time we realize that we have overlooked making a change in the data transformation, we just have to go to the horizontal menu of Power Bi Desktop.
There we will see how within the "Start" tab we will be able to find the option to transform data.
The Power Bi editor, called Power Query, as we have seen, offers a multitude of options that, as we have mentioned, have the objective of cleaning, debugging the data, making changes and combining with other Excel tables.
There are many options offered within the Power Query editor, many of them of great value and usefulness in this phase of the project where we are building a solid base for reporting. For this reason, we will take an in-depth look at the most interesting tools in the Power Bi editor on how to use Editor Power Query, in order to better understand the potential of Power Bi, in data management, and to learn what kind of changes we can make when we are importing data into Power Bi.
The Power Bi transformation is a phase of the data processing process, as we have already seen, of great importance and value to be able to make as many changes as necessary in order to minimize the chances of finding errors in the final reports.
And although it may seem like a more tedious part of the process, or it may lead us to think that Power Bi is a very complex tool, we must be convinced that we are building a solid report. How the construction of a house where all the construction phases are important, but ensuring a good foundation, and the good placement of the bricks will result in a solid house that will not collapse in the face of any contingency.