Current operating systems have functionalities that allow recording every situation that occurs; both with the operating system itself and with its internal applications and components. This facilitates all the tasks that as administrators we must carry out within the tasks of support, audit and error prevention ..
Thanks to the event logs , it is possible to obtain details of shutdowns, reboots or logins in the system, access, edition of applications and each of these tasks can become essential for administration efforts regardless of the size of organization.
Splunk has been developed as a large capacity software, which can be integrated to carry out business records management in real time in order to collect, store, search, diagnose and report any record or data generated by the company. server and multi-line application logs are also included; structured, unstructured and complex..
This is why today TechnoWikis will explain what Splunk is and how to install and configure it on CentOS 7 Linux step by step.
What is Splunk?
Splunk is an operational intelligence platform, which allows system or network administrators to access much more complete details about values ​​and information that can allow the company to be more productive, profitable, competitive and secure in all aspects both Internal as external.
Splunk manages two essential areas that are:
Operational intelligence
This allows real-time understanding of everything that happens in IT systems and technological infrastructure in order to make correct decisions, associated with errors and improvements to be made looking for the best benefit for all.
Machine data
These contain records of all activity and behavior of customers, users, transactions, applications, servers, networks and mobile devices among others; where configurations, API data, message queues and many more aspects are included.
Splunk features
Among the features offered by this platform we have:
Take data from any equipment information
Splunk can collect and index the registry and team data from any source; in this way it will be possible to combine the data of the equipment with the data in the relational databases, data stores and Hadoop and NoSQL data stores.
Open Development Platform
Developers can create new custom Splunk applications or integrate Splunk data into other applications; which gives us the opportunity to maximize the use of the platform.
Business class architecture
Splunk has a scale of automatic load balancing and clustering of multiple sites, in order to support hundreds of terabytes of data daily and thus optimize response times and provide continuous availability for administrators.
Splunkbase applications and add-ons
Splunk applications are available to take full advantage of the platform and thus increase its benefits.
Indexing
Splunk indexes data from the IT infrastructure. In this way it will be possible to obtain data from websites, applications, servers, databases, operating systems and much more.
Search
Search is the best alternative to access data in Splunk. It will be possible to save a search as a report and use it in order to feed the dashboard panels. In addition, these searches offer data information such as metric calculation, search for specific conditions and more.
Alerts
Splunk alerts notify us when the search results and in real time meet the conditions configured as well. It is possible to configure alerts to trigger actions such as sending alert information to designated email addresses, posting alert information in an RSS feed and executing a custom script as required.
Reports
Splunk allows us to save searches and pivots as reports, to later add reports to dashboards as panel panels.
Pivot management
A pivot refers to a table, graph or display of data created with the Pivot Editor. The Pivot Editor allows users to add attributes defined by data model objects to a table, graph or data visualization without having to execute searches in the Search Processing Language (SPL) to generate them.
Boards
Splunk boards contain module panels such as search boxes, fields or graphs in order to display search results and in real time.
System Requirements
The following operating systems are required to use Splunk:
- PowerLinux, Little Endian kernel version 2.6 and higher.
- zLinux, kernel version 2.6.
- Windows Server 2012, Server 2012 R2, and Server 2016.
1. How to install Splunk on CentOS 7 Linux
For this installation we have two options:
Option 1
The first is to go to the Splunk website, create an account and thus obtain the latest version available for the Splunk Enterprise download page distribution. RPM packages are available for Red Hat, CentOS and similar versions of Linux.
The official website is as follows:
Splunk
Option 2
Step 1
If you do not wish to use this method, we can use the wget command to download it directly to the system by executing the following command:
wget -O splunk-7.1.2-a0c72a66db66-linux-2.6-x86_64.rpm 'https://www.splunk.com/bin/splunk/DownloadActivityServlet?architecture=x86_64&platform=linux&version=7.1.2&product=splunk&filename=splunk-7.1 .2-a0c72a66db66-linux-2.6-x86_64.rpm & wget = true '
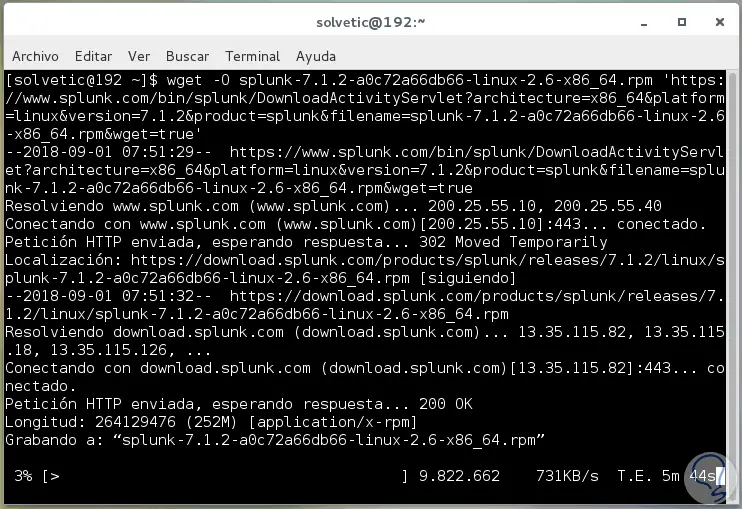
Step 2
Once the package download process is complete, we will install Splunk Enterprise RPM in the default directory; which is / opt / splunk using the RPM package manager as follows:
rpm -i splunk-7.1.2-a0c72a66db66-linux-2.6-x86_64.rpm
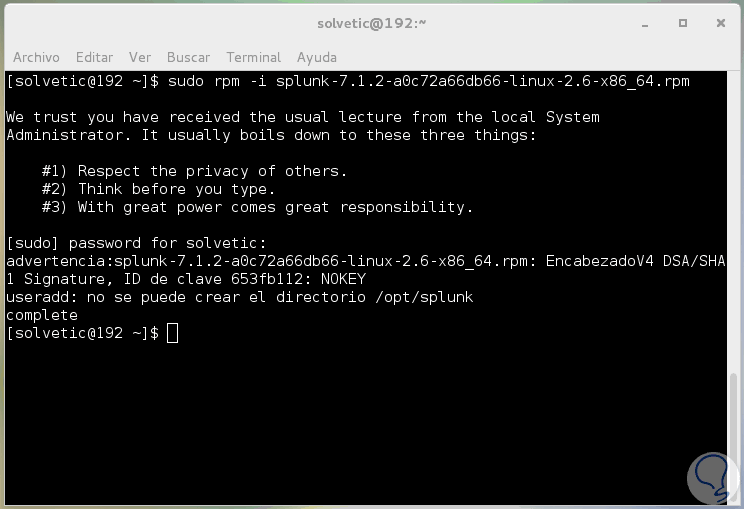
Step 3
Now we are going to use the Splunk Enterprise command line interface (CLI) to start the service like this:
sudo /opt/splunk/bin/./splunk start
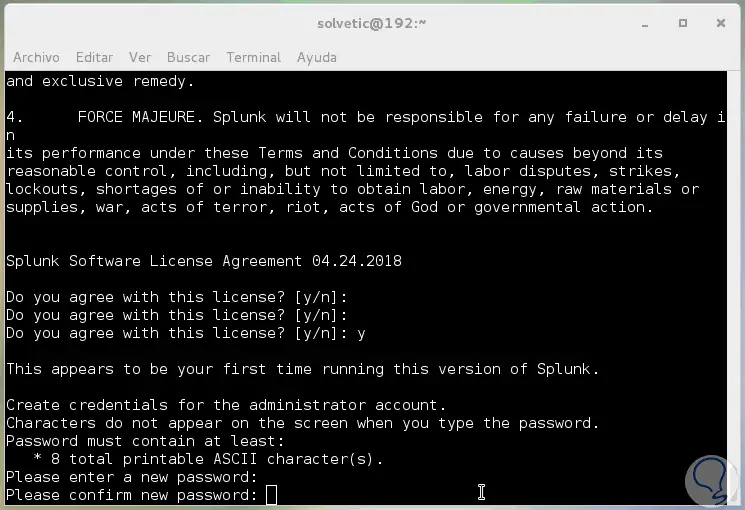
First of all, we will need to read the license term agreements:
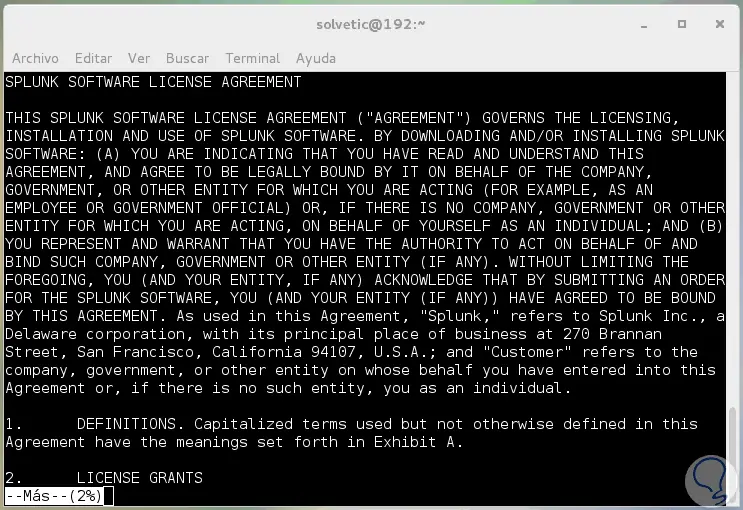
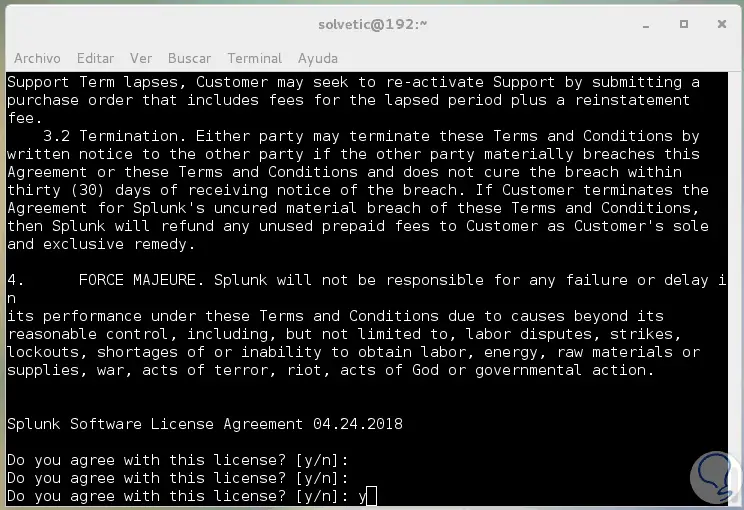
Then, we must enter the letter "y" to accept the terms of this license, press "Enter"
Step 4
Now we must assign, and confirm, the password of the administrator user. Press "Enter" again
Step 5
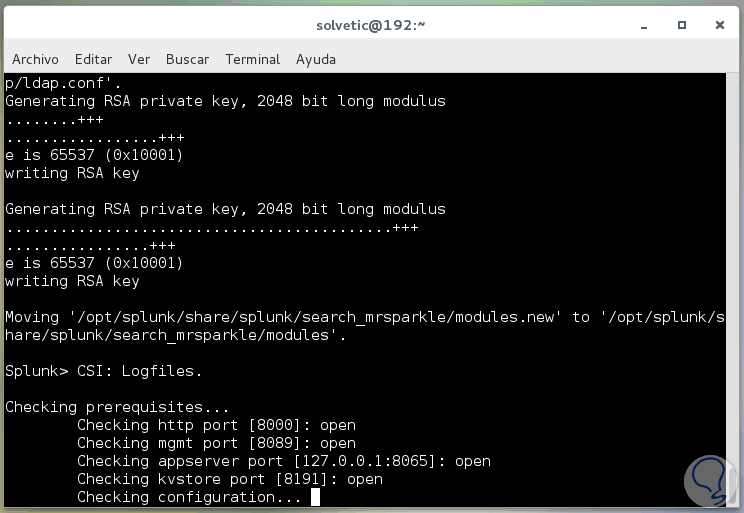
The Splunk configuration and installation process will begin:
Step 6
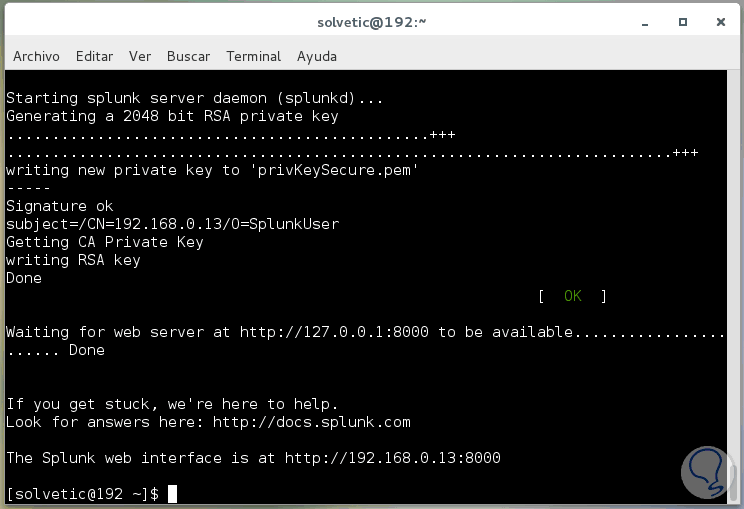
If all installed files are correct and all preliminary checks are passed, the Splunk server daemon (splunkd) will be started, which will generate a 2048-bit RSA private key. In the final part we will see how to access the Splunk web interface:
Step 7
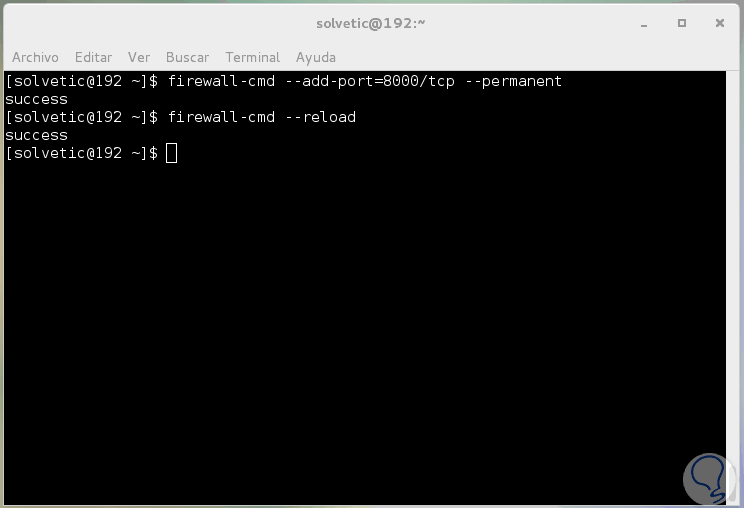
Next, we will open port 8000, which listens to the Splunk server, on the firewall using the firewall-cmd as follows:
firewall-cmd --add-port = 8000 / tcp --permanent firewall-cmd --reload
2. How to access Splunk on CentOS 7 Linux
Step 1
Once this is done, we will access the Splunk interface using the following syntax:
http: // IP_SERVIDOR: 8000
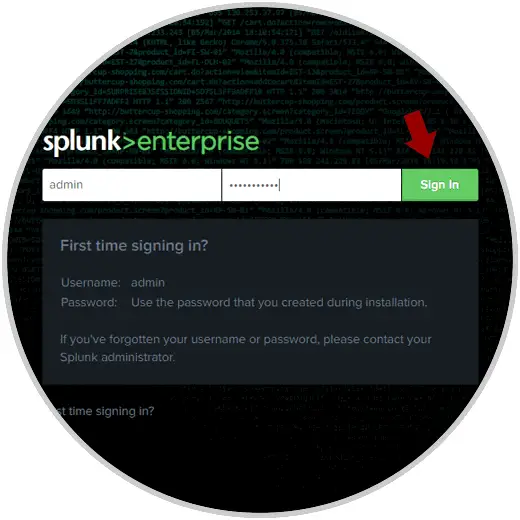
In the displayed window we will enter the admin user and the password that we have defined during the configuration process already described. Click on "Sign In"
Step 2
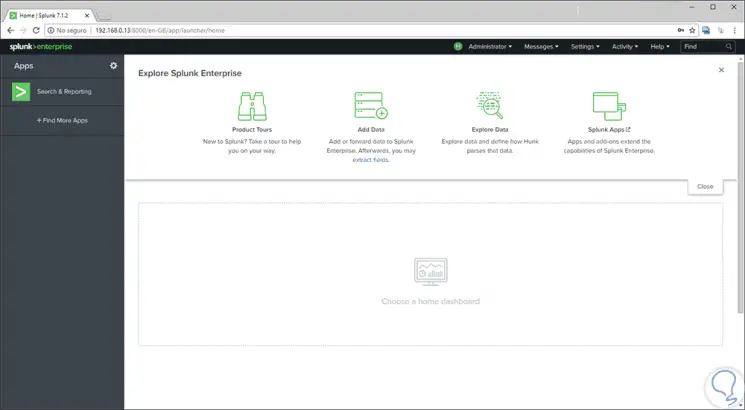
This will be the initial application environment:
Step 3
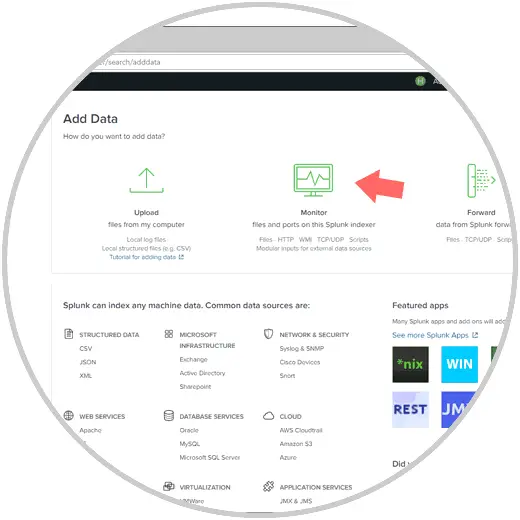
To add data to monitor, click on the "Add Data" section and see the following. There we click on the "Monitor" section.
Step 4
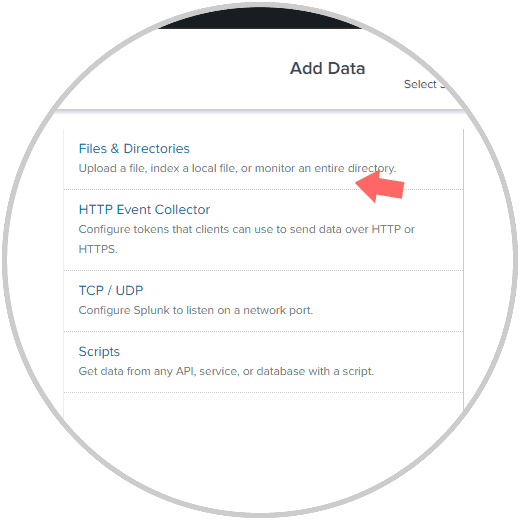
In this case we will click on the category "Files & Directories"
Step 5
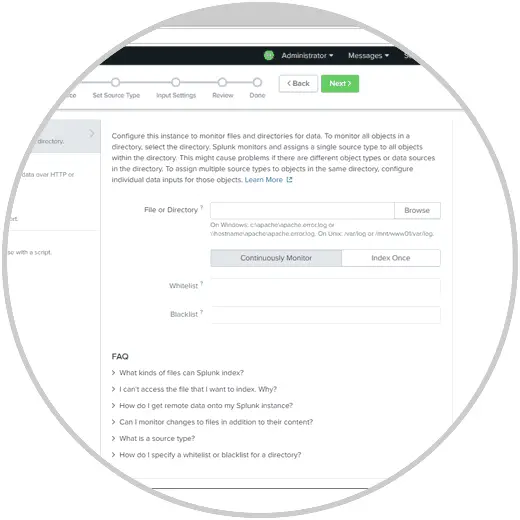
In the next window we must configure the instance to monitor files and directories for the data.
Step 6
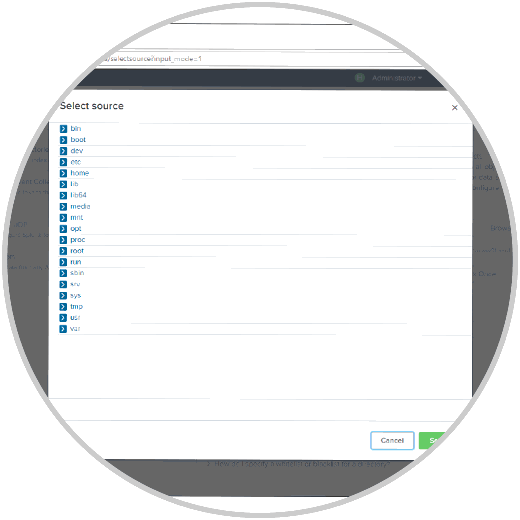
To monitor all objects in a directory, we will select the respective directory. If we want to monitor a single file, it will be necessary to select it by clicking "Browse" to select the data source, the following will be displayed:
Step 7
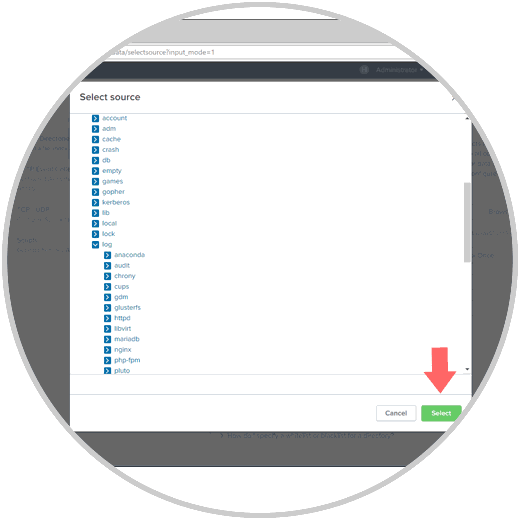
Simply click on each line to display all its subdirectories where we will select the desired one. Once selected we click on the "Select" button.
Step 8
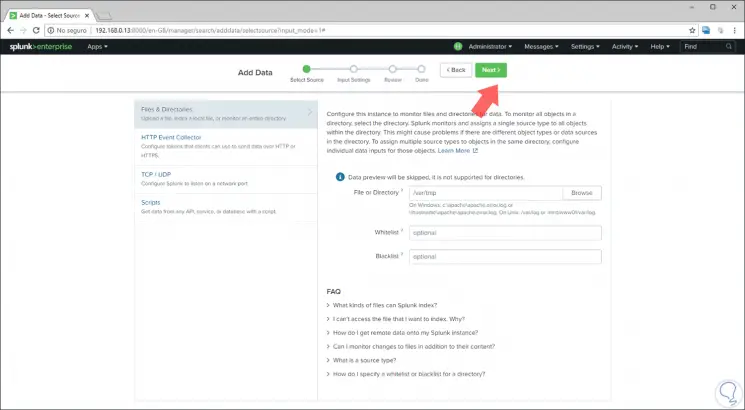
We will see this; Now we click on the "Next" button at the top.
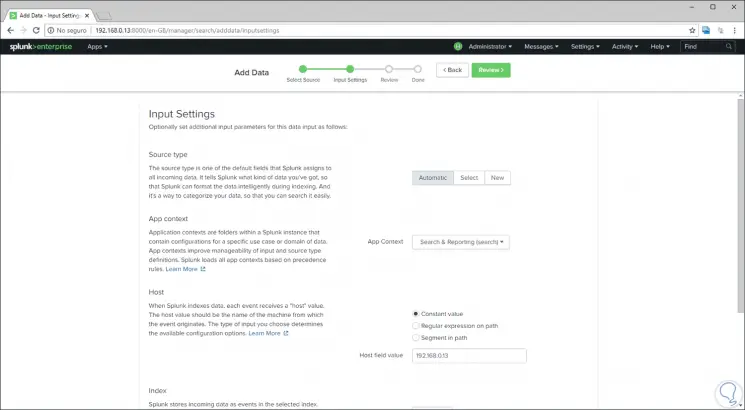
Step 9
We will define the monitoring configuration of the selected data. Once this is defined, click on "Next".
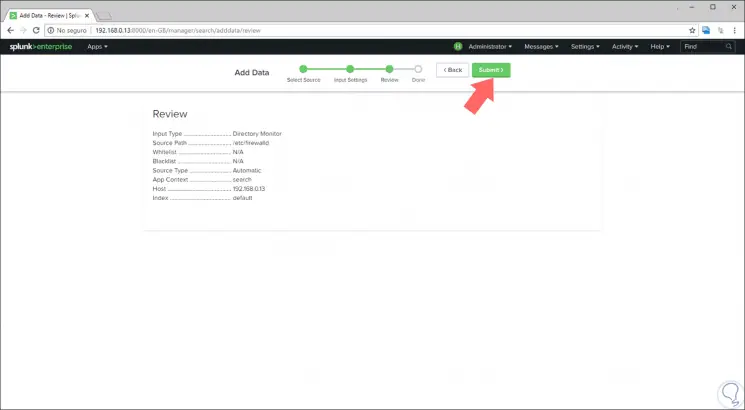
Step 10
Then we will see a summary of the process executed, click on "Submit" to load the configuration.
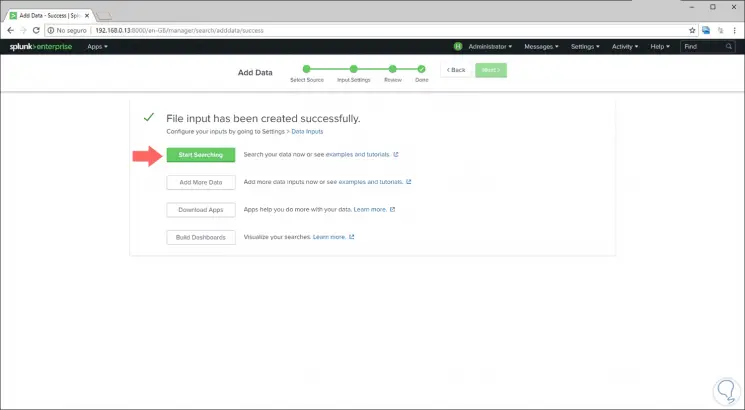
Step 11
The following will be displayed, to start the monitoring process, click on the "Start Searching" button.
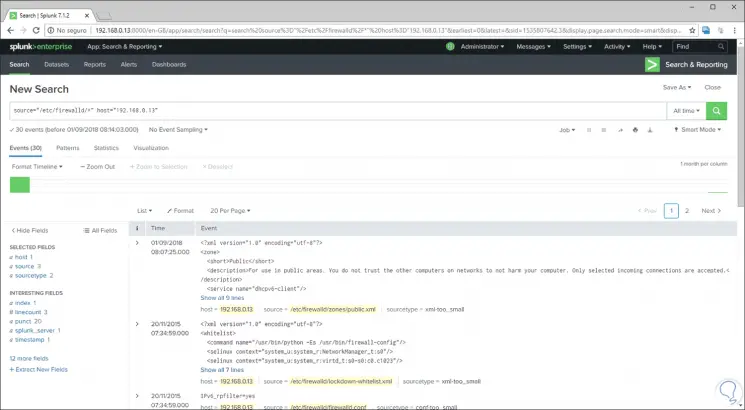
Step 12
The following will be displayed, there we can see each event by category with their respective information.
Step 13
To see all the data entries, we must go to:
Then we will click on the type of view to see, for example, "Files and Directories", "TCP", etc:
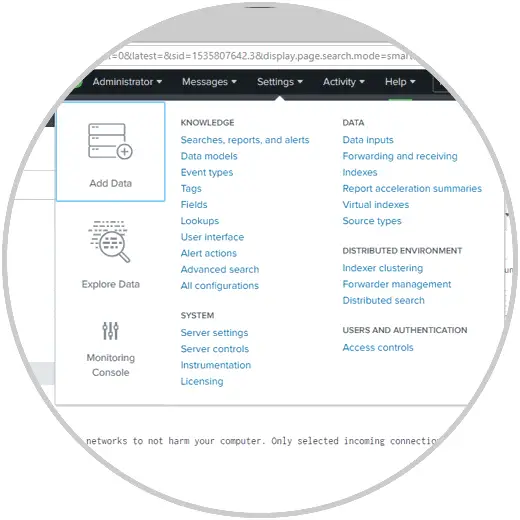
This will be the result:
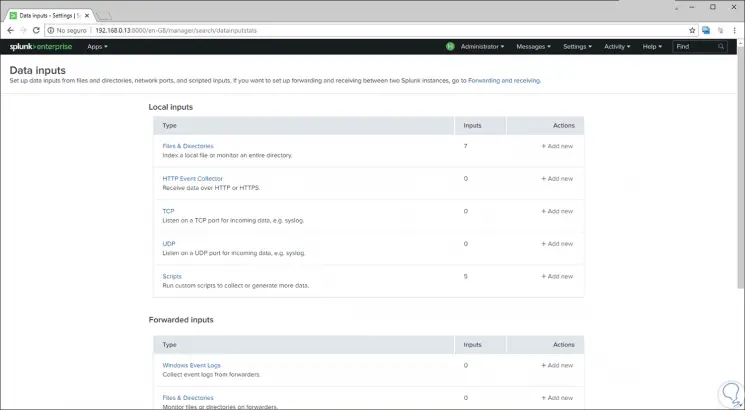
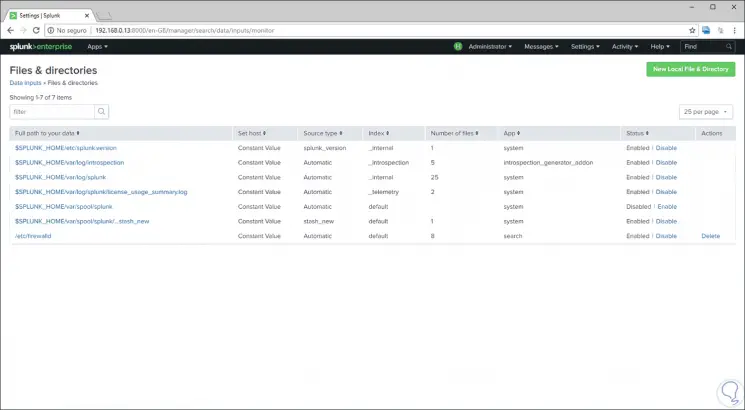
Step 14
By clicking on "Files & Directories" we will see the most summarized data:
From the "Settings" section we can go to the "Monitoring" category in order to see more precise details of the server:
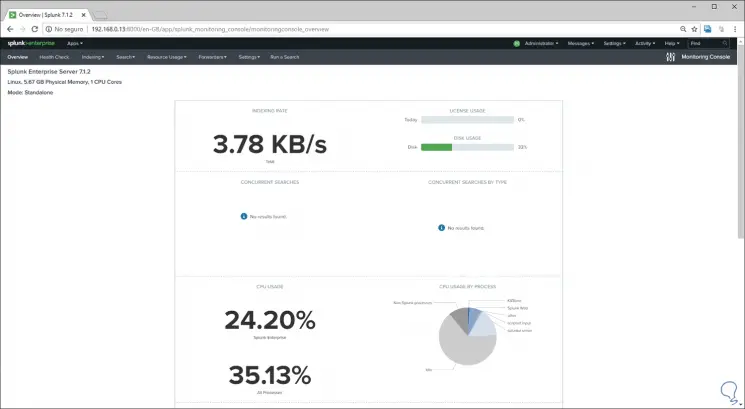
In this way, Splunk is an integral solution for monitoring various system elements in real time and with the best configuration features..