There are hundreds of monitoring tools that have been developed with the objective of simplifying the task of management , control and administration of an organization regardless of the operating system used..
In the case of Linux distributions , we have a greater advantage by having thousands of open source options which, apart from being free, allow us to scale their possibilities to much higher levels.
Such is the case of Grafana, and it is for this reason that TechnoWikis will make a complete analysis of what it is and how to use Grafana in CentOS 7.
In case of not having the distribution of CentOS 7 we can download it in the following link:
CentOS 7
What is Grafana
Grafana has been developed as an open source tool with which it will be possible to consult, visualize, alert and analyze the metrics in a much simpler way, no matter where they are stored.
Characteristics of Grafana
When using Grafana we will have the following advantages:
- Various display options: With Grafana it will be possible to access multiple types of graphics, panel add-ons and more options to display metrics and records.
- Alert system: With Grafana each metric will be evaluated in a defined period of time and, if any difference is found, we will be alerted to it.
- Notifications: When an alert changes its status, a notification is sent. It will be possible to receive notifications by email or through platforms such as Slack, PagerDuty, VictorOps, OpsGenie or webhook.
- Dynamic boards: With Grafana we can create dynamic and reusable dashboards with template variables which can contain drop-down menus at the top of the board.
- Mixed data sources: It will be possible to mix different types of data in a single graph.
- Annotations: We can add annotations to graphics with rich events through different data sources. With this, when passing the cursor over the events, the metadata and the labels of the entire event will be displayed.
- Ad-hoc filters: Ad-hoc filters allow us to create new filters by key or value without shutting down the system, and these will be automatically applied to all queries that make use of that data source.
Now we will see how to install and use Grafana in CentOS 7..
1. Add the Grafana repository in CentOS 7
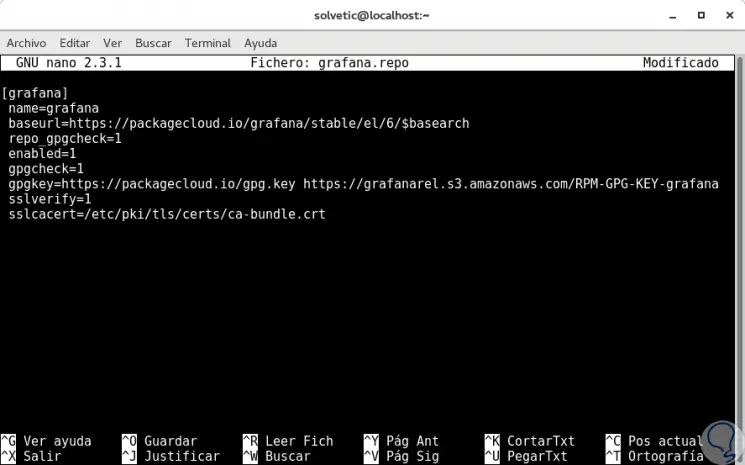
The first step to take is to add the Grafana repository in the yum.repos.d directory, for this we must create a new file which we will call “grafana.repoâ€.
Step 1
For this we can use some editor like vim or nano:
cd /etc/yum.repos.d/ (Directory access) nano grafana.repo (File creation)
Step 2
In the displayed window we will paste the following lines:
[grafana] name = grafana baseurl = https: //packagecloud.io/grafana/stable/el/6/$basearch repo_gpgcheck = 1 enabled = 1 gpgcheck = 1 gpgkey = https: //packagecloud.io/gpg.key https://grafanarel.s3.amazonaws.com/RPM-GPG-KEY-grafana sslverify = 1 sslcacert = / etc / pki / tls / certs / ca-bundle.crt
Step 3
We save the changes using the following key combination:
+ O Ctrl + O
We leave the editor using:
+ X Ctrl + X
Note
If we want to make use of a repository where we find the application in the testing phase or beta, we must add the following line:
baseurl = https: //packagecloud.io/grafana/testing/el/6/$basearch
2. Install Grafana in CentOS 7
Step 1
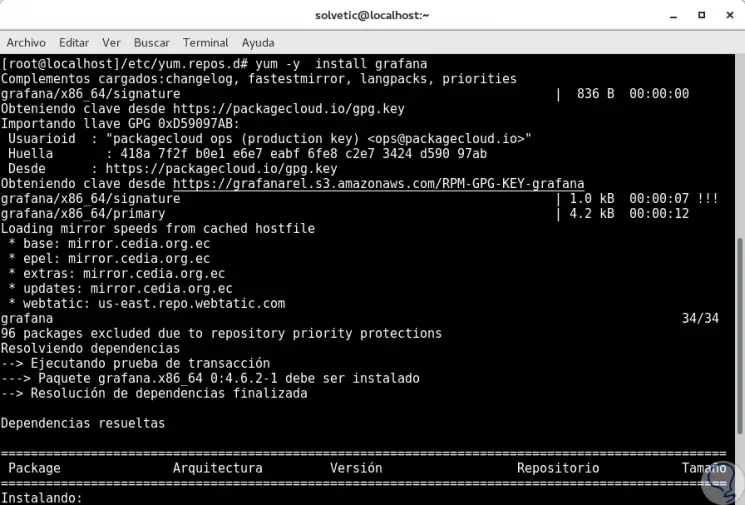
Once the repository is stored, we can use the following command for the installation of Grafana in the system:
yum -y install grafana
Step 2
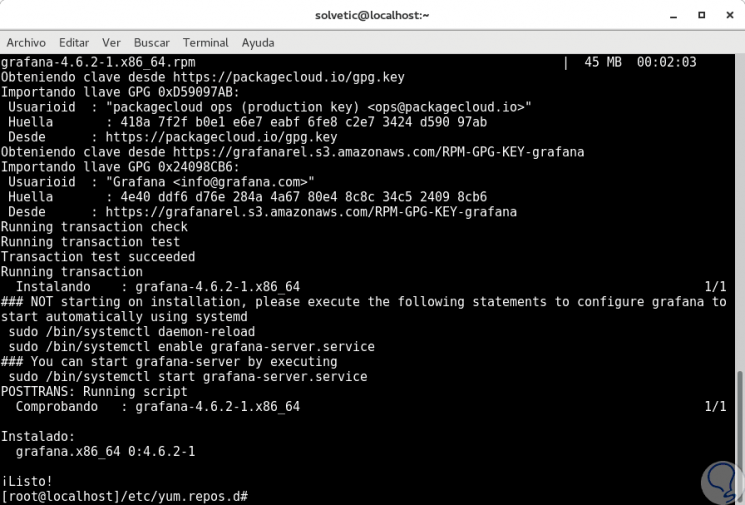
Once Grafana is installed in CentOS 7 we will see the following:
Step 3
Some other ways how we can install Grafana in CentOS 7 are:
Install the stable version using the Yum command directly
Install the stable version using RPM
3. Restarting Grafana services in CentOS 7
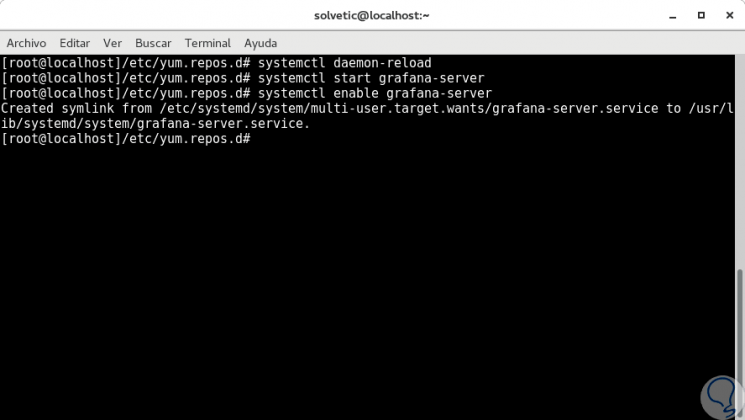
Once the installation is finished, we proceed to execute the following lines:
systemctl daemon-reload (Demon Restart)
systemctl start grafana-server (Start of the Grafana service)
systemctl enable grafana-server (Enabling the Grafana service at the start of CentOS 7)
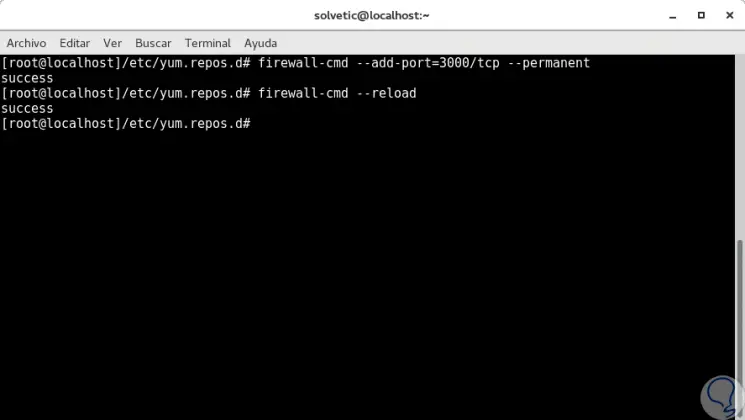
4. Enable the port for Grafana in CentOS 7
By default Grafana makes use of port 3000 for its communication, so it is important that we enable this port in the CentOS 7 firewall by executing the following. Up to this point we have installed Grafana in CentOS 7.
firewall-cmd --add-port = 3000 / tcp --permanent firewall-cmd --reload
5. Install Grafana on Ubuntu 17.10
Many users have Ubuntu as their work distribution and without a doubt Grafana is fully compatible with Ubuntu. We will see how to install it there.
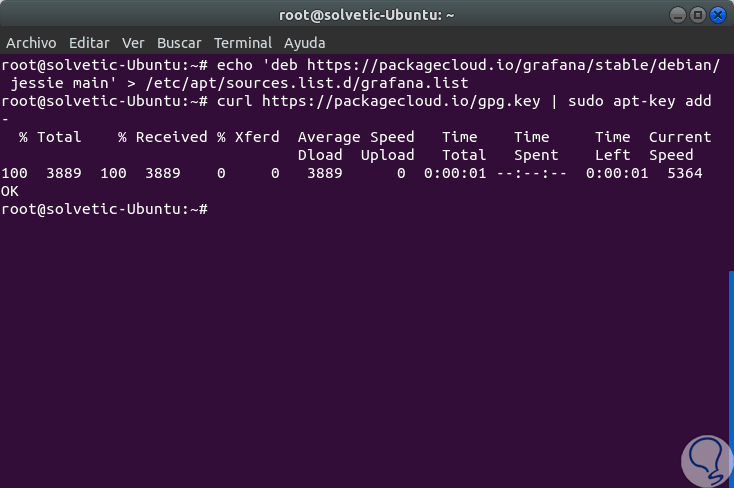
First, as in CentOS 7, we must add the repository for the correct installation of Grafana, this repository will go to the sources.list.d directory.
Step 1
To do this we execute the following:
sudo echo 'deb https://packagecloud.io/grafana/stable/debian/ jessie main'> /etc/apt/sources.list.d/grafana.list
Step 2
Now we will add the GPG key by executing the following:
curl https://packagecloud.io/gpg.key | sudo apt-key add -
Step 3
Now, we will update the repository by running:
sudo apt update
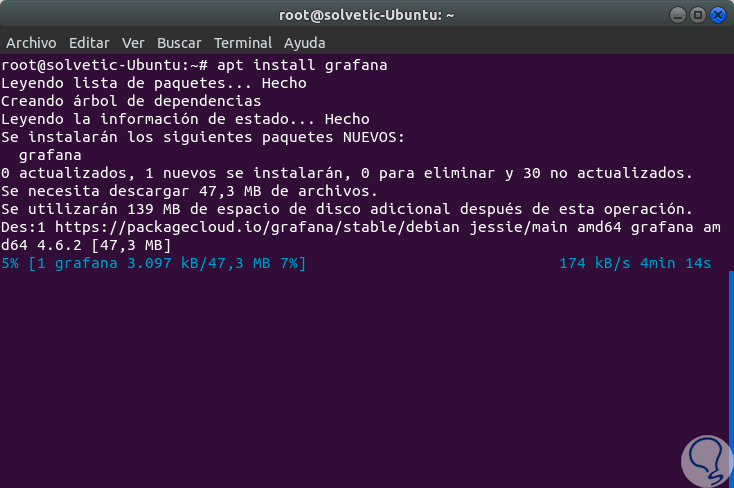
Step 4
We proceed to install Grafana by running the following line. There we expect packages to be downloaded and installed.
sudo apt install grafana
Alternative to install Grafana
6. Start Grafana services in Ubuntu 17.10
Step 1
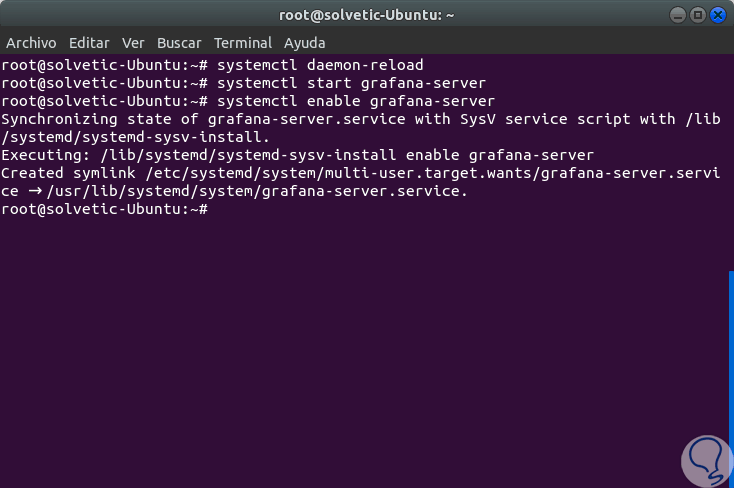
Because Ubuntu uses systemd as the init system, it will be necessary to run the following line to load the Grafana configuration:
systemctl daemon-reload
Step 2
Now, we will execute the following lines:
systemctl start grafana-server (Start the Grafana service)
systemctl enable grafana-server (enable the Grafana service on Ubuntu startup)
7. Enable Firewall in Ubuntu 17.10
Step 1
As in CentOS 7, Grafana makes use of port 3000 for its connection, so it will be necessary to enable it in the system, this can be verified by executing the following line:
netstat -plntu
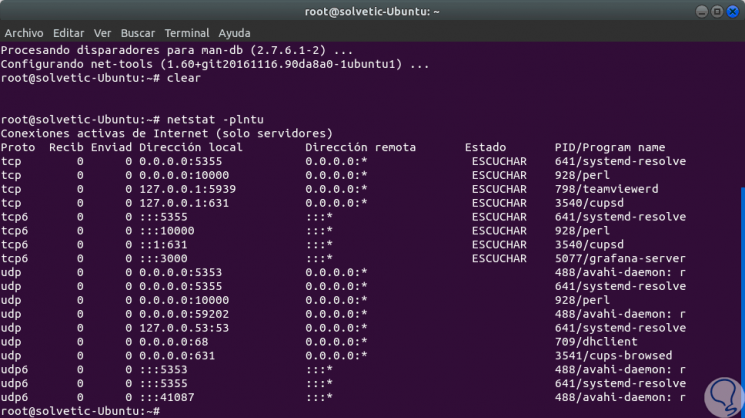
We can see that the Grafana service makes use of port 3000..
Note
In case of not having the netstat option, we can install by running the line
apt install net-tools.
Step 2
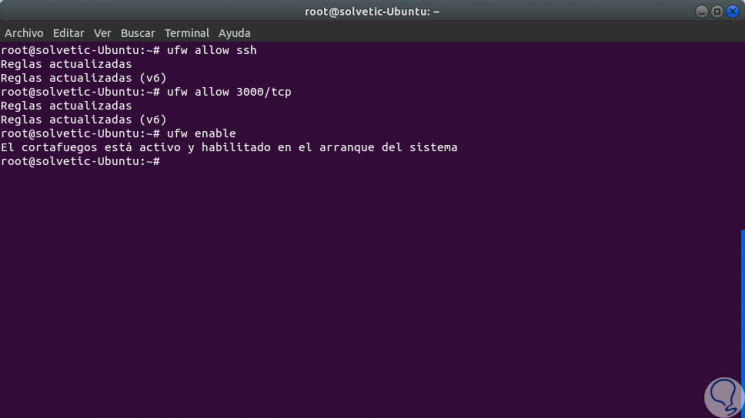
To enable this port in Ubuntu we will execute the following lines:
ufw allow ssh ufw allow 3000 / tcp ufw enable
Step 3
If we want to see the status of the firewall we can use the command:
ufw status
8. Use Grafana in Ubuntu 17.10
Step 1
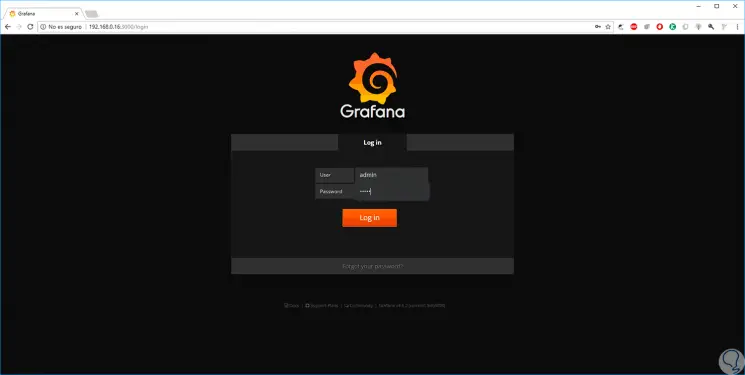
To access Grafana we must go to a browser and use the following syntax:
http: // IP_address: 3000
Step 2
At the time of access, we will use the following credentials:
Step 3
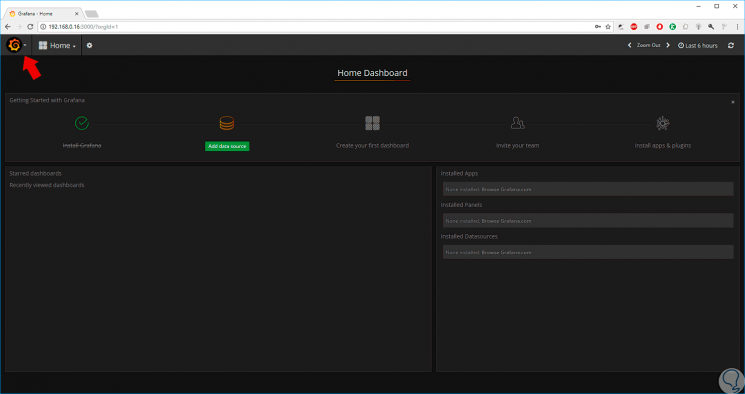
When accessing we will see the following:
Step 4
There we can start the Grafana management process. If we want to edit the username and password for security, click on the Grafana icon and go to the Admin / Global Users route:
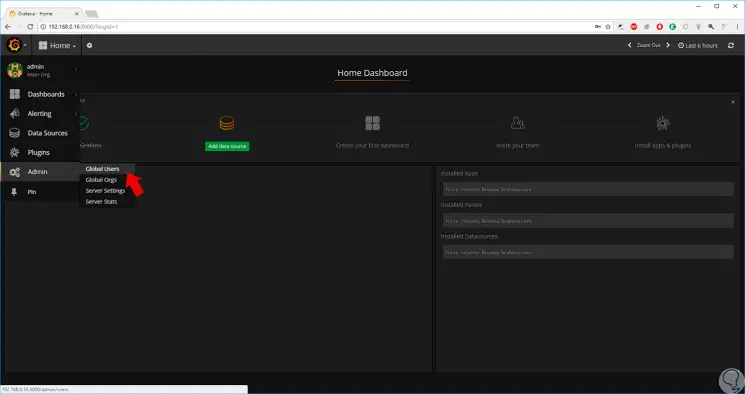
Step 5
There we will see the following window:
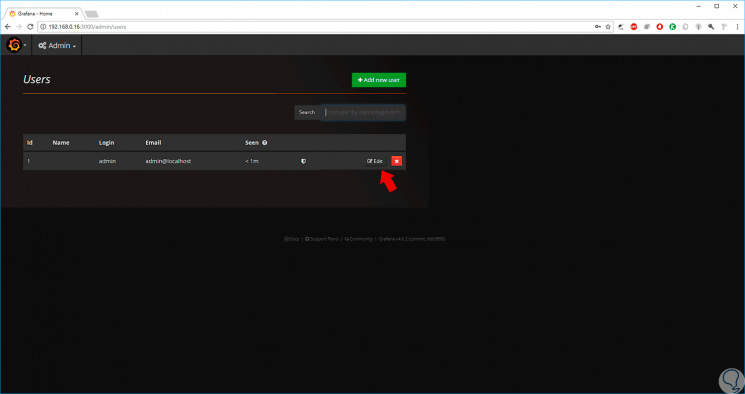
Step 6
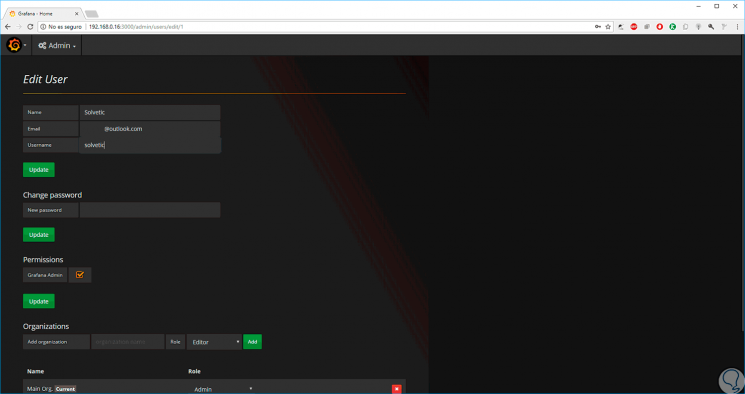
Click on the "Edit" button to make the necessary adjustments. Once done click on the "Update" button to apply the changes.
9. Install plugins in Grafana on Linux
Step 1
Grafana allows us to use three types of plugins in its interface, these are:
Panel plugins (Panel plugins)
This type of complements allow us to add a new visualization of the data in Grafana.
Data Source
In this complement you will find the source data of Grafana.
App (App)
Through this complement we can add new features to Grafana.
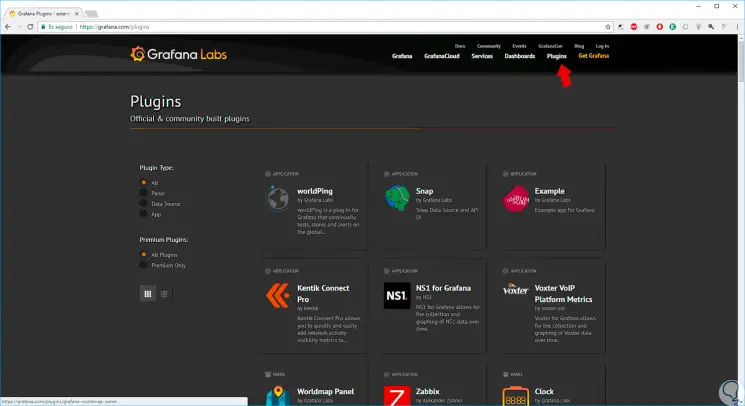
Step 2
These can be installed if we go to the Plugins section in the Grafana menu:
Step 3
But if we want to install them from the terminal, Grafana offers us the “grafana-cli†option for this operation:
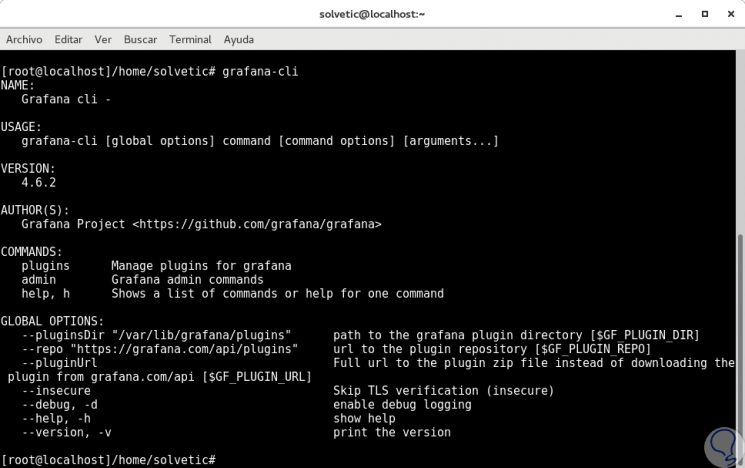
Step 4
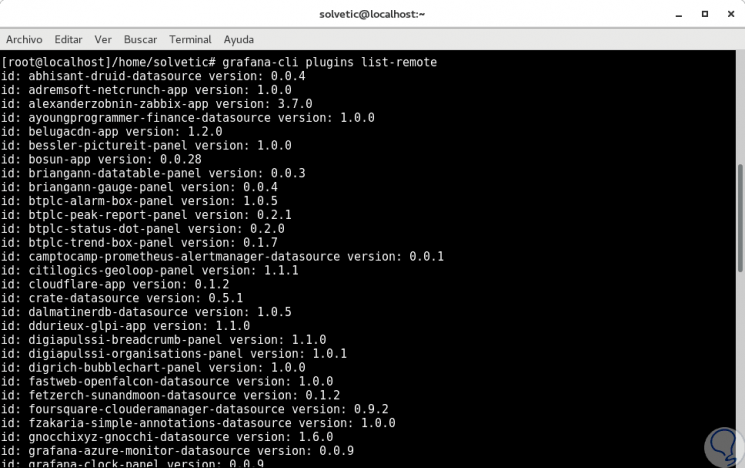
To list all the add-ons available in the repository we will use the following line:
grafana-cli plugins list-remote
Step 5
To install any plugin in Grafana we will use the “plugins install†parameter as follows:
grafana-cli plugins install grafana-clock-panel
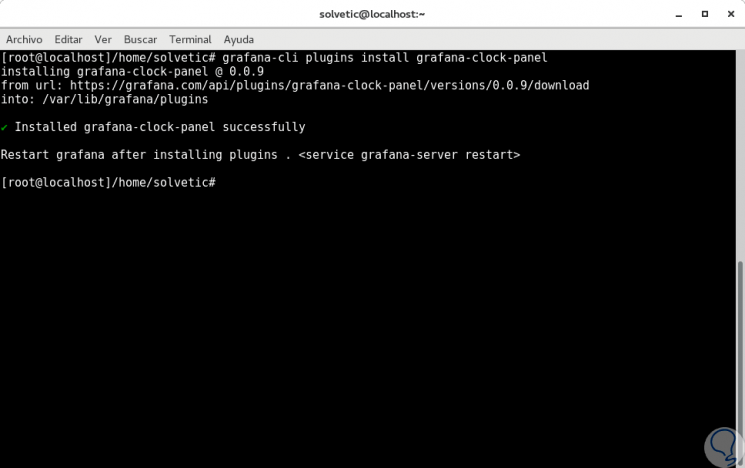
Step 6
We can see that it is necessary to restart the Grafana service to complete the process, for this we will execute the following:
systemctl restart grafana-server
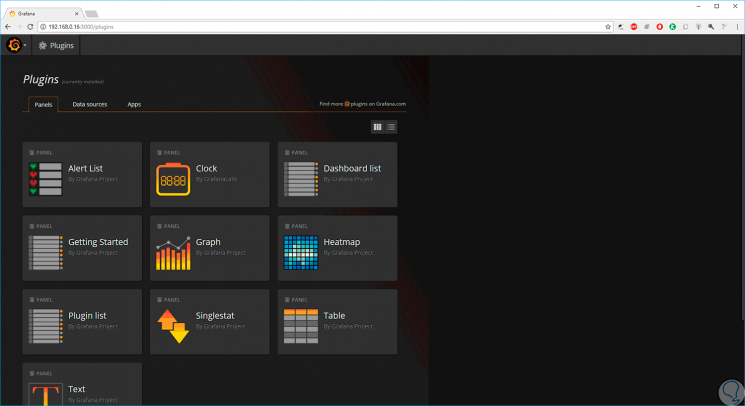
Step 7
Once restarted the service we can see the plugin installed in Grafana:
Step 8
To remove the installed plugin we execute the following:
grafana-cli plugins remove grafana-clock-panel
We see the various options offered by Grafana for the management and control of Linux operations.