As Linux system administrators , it is more than essential to be aware of any developments that the system or its associated services can register every day, since this is essential for stable and secure servers. Today we have hundreds of open source tools that allow us to access information in real time and this is a great help; but if for some reason you need to access events in a previous period of time we may have difficulties. To avoid these types of failures and to access previous events , we have the sysstat tool dedicated to this purpose..
For this reason TechnoWikis will explain what it is and how to install sysstat in two of the most used distributions in Linux: CentOS 7 and Ubuntu 18.
What is sysstat?
The Sysstat utility is a collection of tools that have been designed to collect information about the performance of a system on Linux and record them over time periods.
Among the tools available with sysstat we find:
Reports on CPU statistics and input and output statistics for block devices and partitions
Deliver statistics associated with the individual or combined processor.
Create a report on the statistics of Linux tasks (processes) such as I / O, CPU, memory and more.
Reports statistics on tape drives connected to the system
Deliver a report on CIFS statistics
Similarly, Sysstat contains tools that can be programmed through cron or systemd in order to collect performance and activity data, these are:
Collect, report and save system activity information
System activity data collector, and is used as a backend to sar
It collects and stores binary data in the daily system activity data file, as such it is an interface for sadc which can be run from cron or systemd
Write a summary report of daily activity and can be executed from cron or systemd
It shows the data collected by sar in multiple formats such as CSV, XML, JSON, and can be used to exchange data with other programs
One of the most practical tools for collecting system data is sar, it gives us details of information such as:
Information offered by sar
- Statistics of memory usage and exchange space, virtual memory, paging and fault statistics.
- Process creation activity.
- Input / output statistics and transfer rates either globally, by device, by partition or by network file system.
- CPU statistics including virtualization.
- Traffic statistics of the fiber channel.
- Network statistics with details of the network interface activity (number of packets and kB received and transmitted per second, etc.) network device failures, network traffic statistics for IP, TCP, ICMP and UDP based on SNMPv2 standards, support for IPv6 related protocols and more.
- NFS server and client activity.
- USB devices on the computer.
- Software processing statistics based on software (softnet) and many more.
Main features of Sysstat
- It works on both 32 and 64 bit architectures.
- Displays the average statistical values ​​at the end of the reports.
- Compatible with UP and SMP machines, integrating machines with multi-threaded or multi-threaded processors.
- Compatible with fast connection CPUs.
- System statistics that are generated by sar or sad can be exported in several different formats such as CSV, XML, JSON, SVG and more.
- Intelligent color output to improve statistics reading.
1. How to install and use Sysstat on CentOS 7 Linux
Step 1
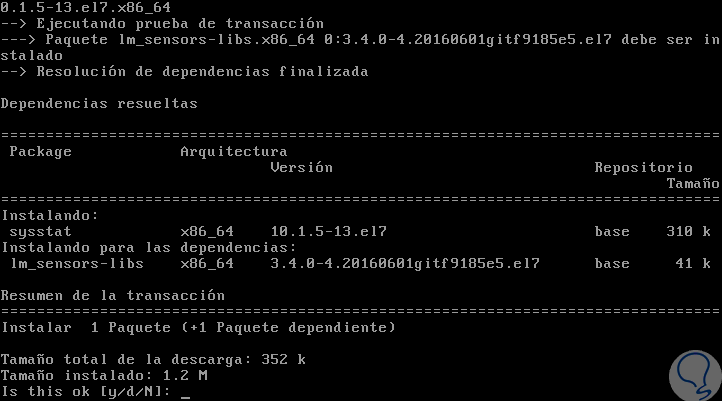
To install Sysstat on CentOS 7 we will execute the following command. There we enter the letter and to confirm the download and installation of Sysstat in CentOS 7.
yum install sysstat
Step 2
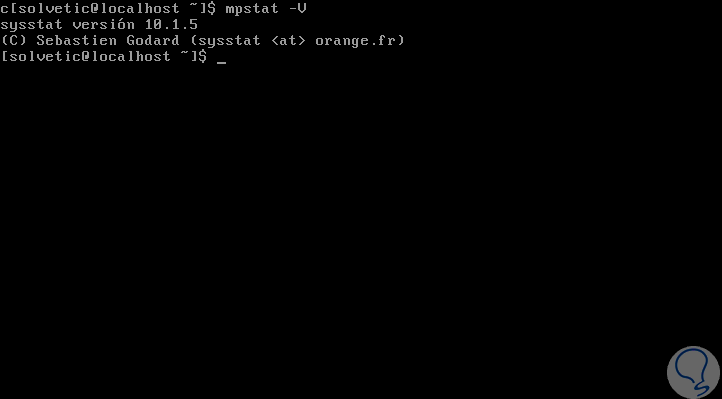
We can check, if we want, the version of Sysstat installed with the following command:
mpstat -V
Step 3
As we have indicated, Sysstat is a set of practical utilities such as:
Displays the activity of the CPU in the system
mpstat
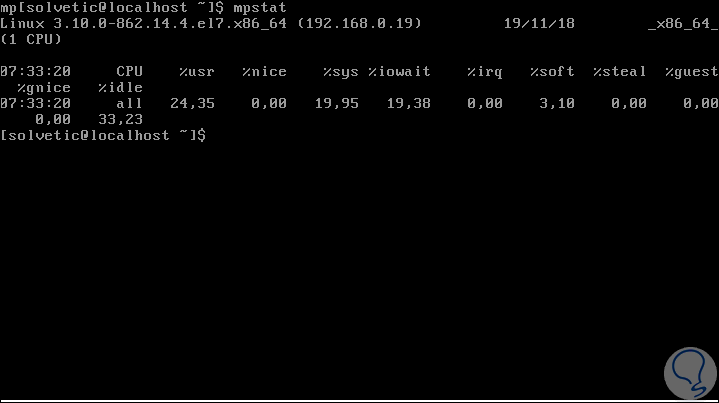
Note
We can run mpstat -P ALL to view each available processor.
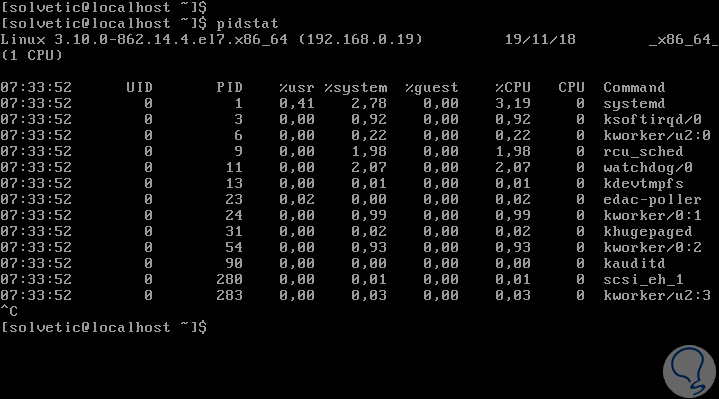
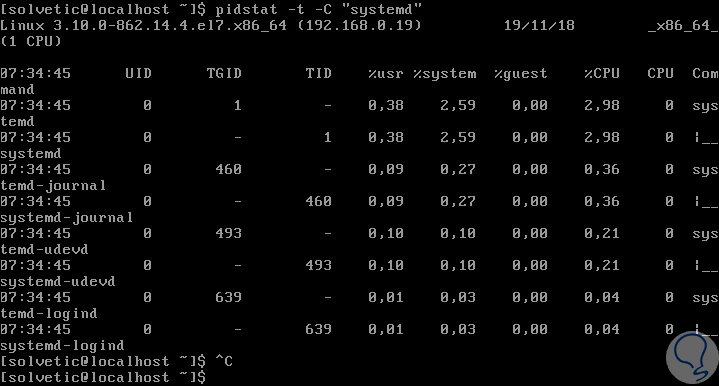
View the use of resources of a specific process
pidstat
Step 4
We can filter the results by process with the following syntax:
pidstat -t -C "Process"
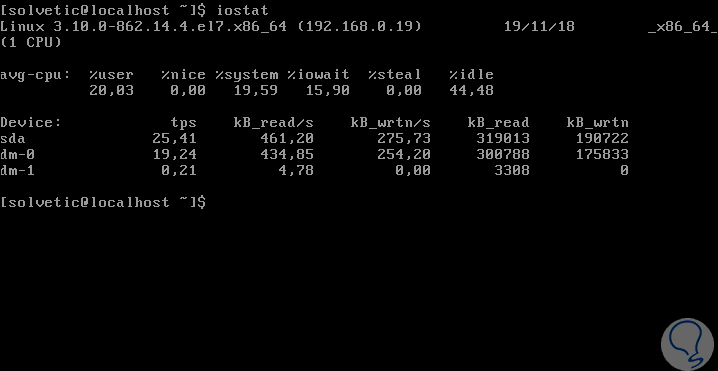
iostat
Which allows to see the use of the disk system:
Note
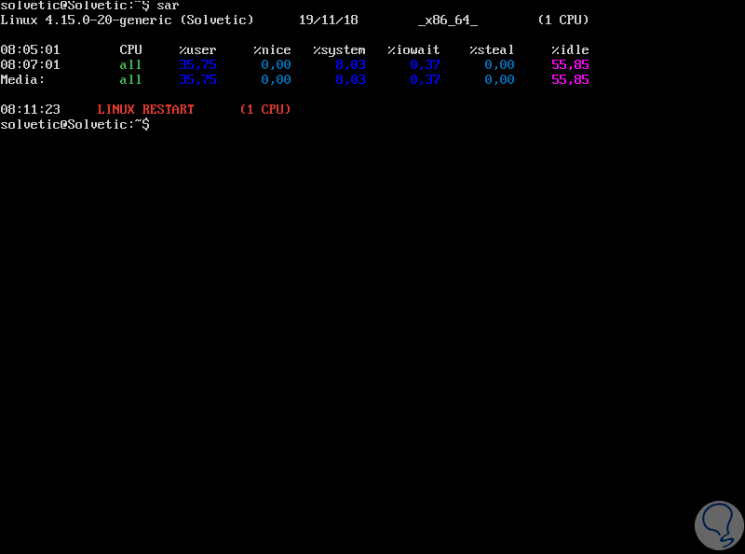
In the various results, we can see that% user,% nice,% system,% iowait and% idle describe the ways in which the CPU can be used in Linux, there,% user and% nice refers to software programs ,% system indicates the kernel's internal operation,% iowai refers to the input / output of data such as reading or writing a hard disk, etc.
Step 5
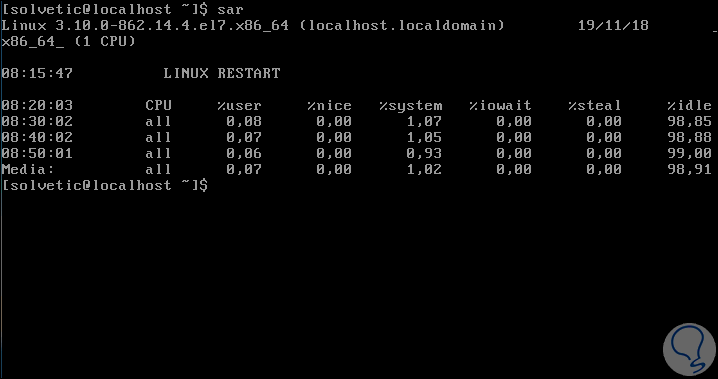
One of the most useful tools is the sar command, this allows you to see the general activity of using system resources and not only of a particular element:
2. How to configure Sysstat on CentOS 7 Linux
It is possible to program the sar command to run at regular intervals in order to collect the information as necessary. This is possible through cron.
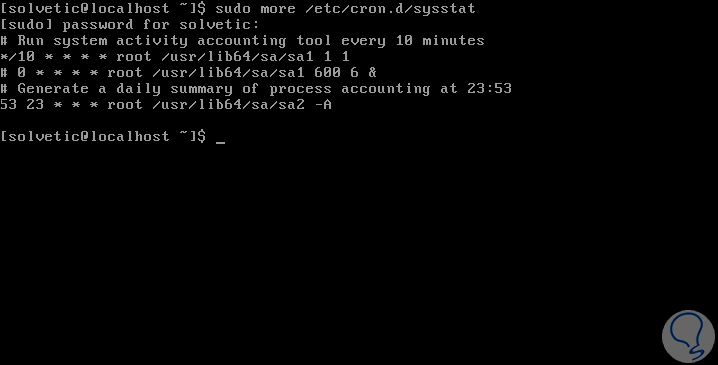
Step 1
To do this we must create a file called sysstat in /etc/cron.d, and from there tell cron to run every day at a specific time range, we execute the following:
sudo more /etc/cron.d/sysstat
Note
In line * / 10, reference is made to sar running every 10 minutes for data collection tasks.
Step 2
These reports are hosted in the var / log / sa directory, this can be seen as follows:
ls / var / log / sa
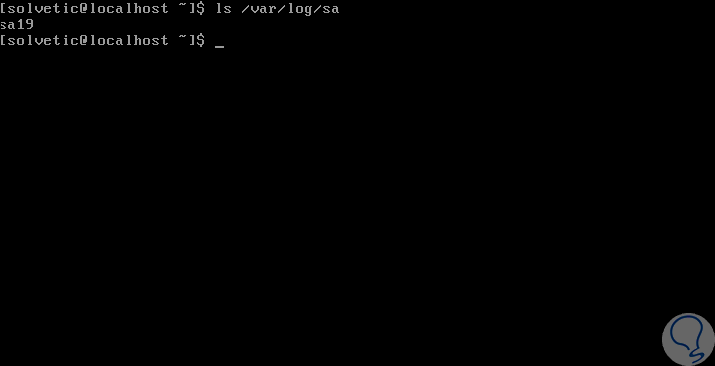
Note
The number 19 refers to the day on which the information was collected.
Step 3
The sar command can be used with some variables such as:
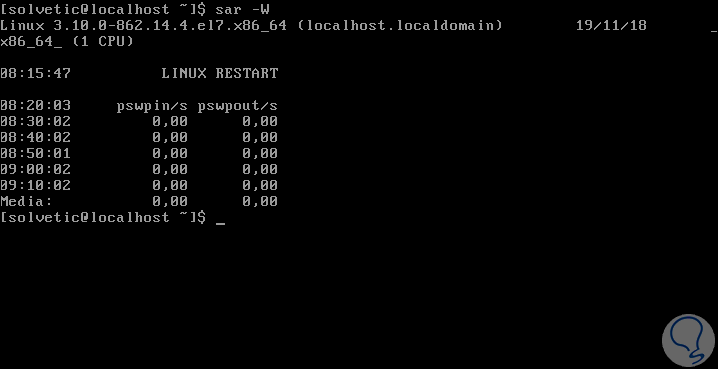
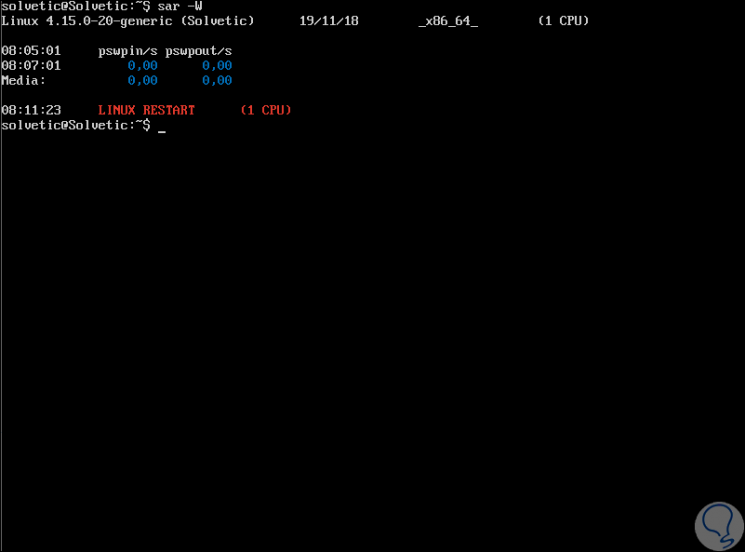
View the use of RAM memory including swap or swap memory
sar -W
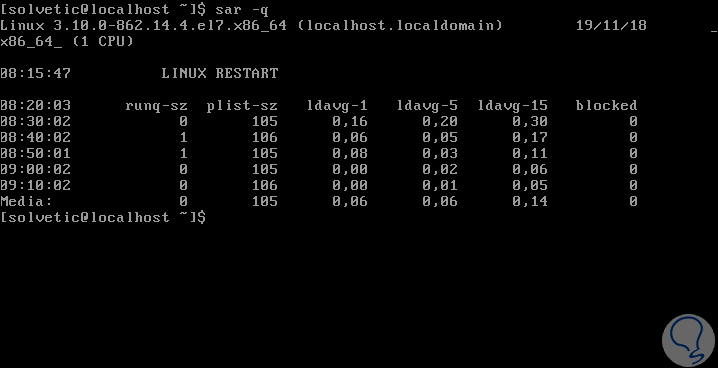
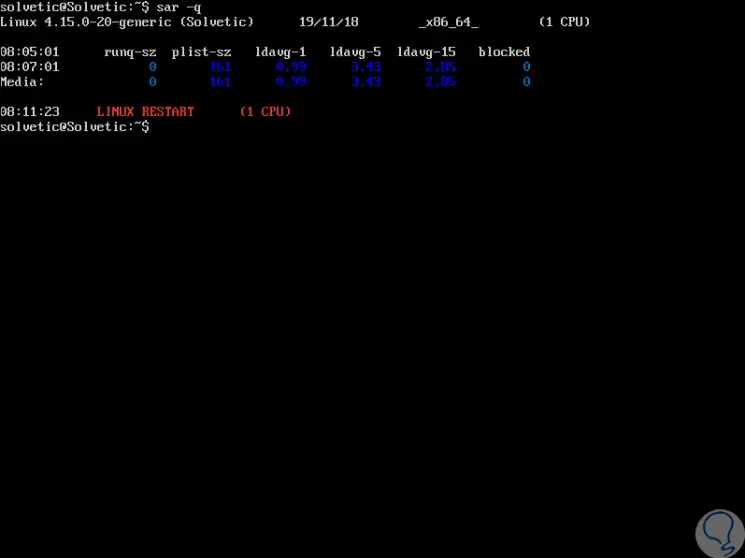
View the system load
sar -q
Step 4
Some other options are:
View details of network devices
3. How to install and use Sysstat on Ubuntu 18 Linux
Step 1
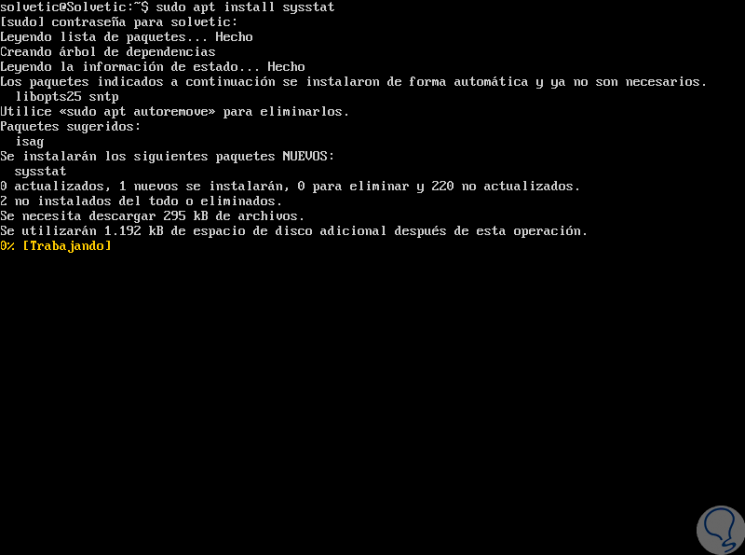
In the case of Ubuntu 18 we can install Sysstat with the following command:
sudo apt install sysstat
Step 2
Once installed it will be necessary to enable it by editing the file / etc / default / sysstat and there changing the ENABLED line from false to true:
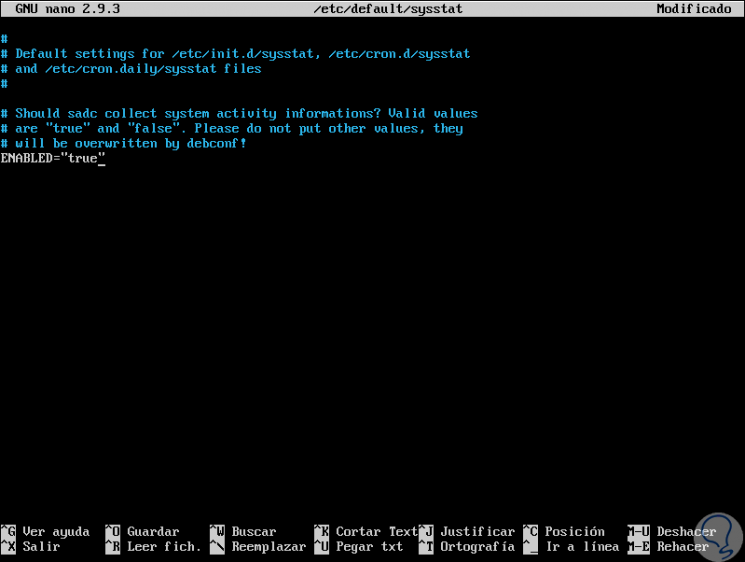
We save the changes with the keys:
+ O Ctrl + O
We leave it with the keys:
+ X Ctrl + X
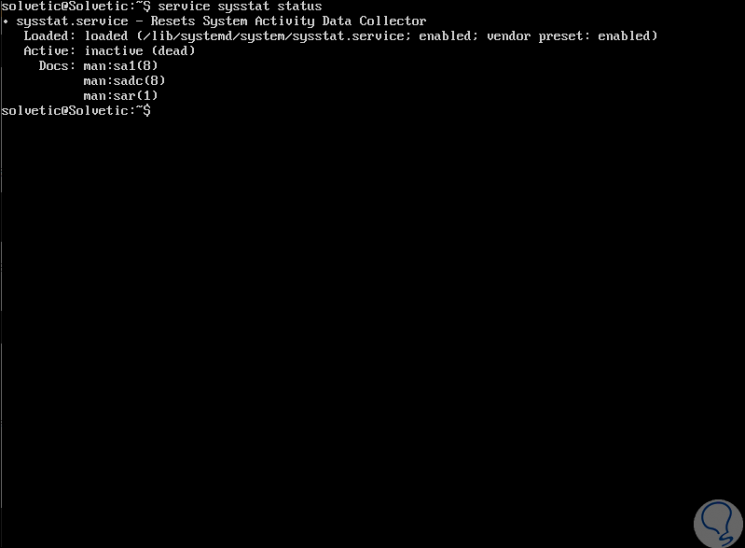
Step 3
After this we can verify the tasks with the following command:
service sysstat status
Step 4
By default Sysstat collects the data every 10 minutes, if we want to change this time frequency, we will edit the following file:
sudo nano /etc/cron.d/sysstat
Step 5
There we enter the number, in minutes, in which we want the collection to run, it is under the line
Activity reports every 10 minutes everyday
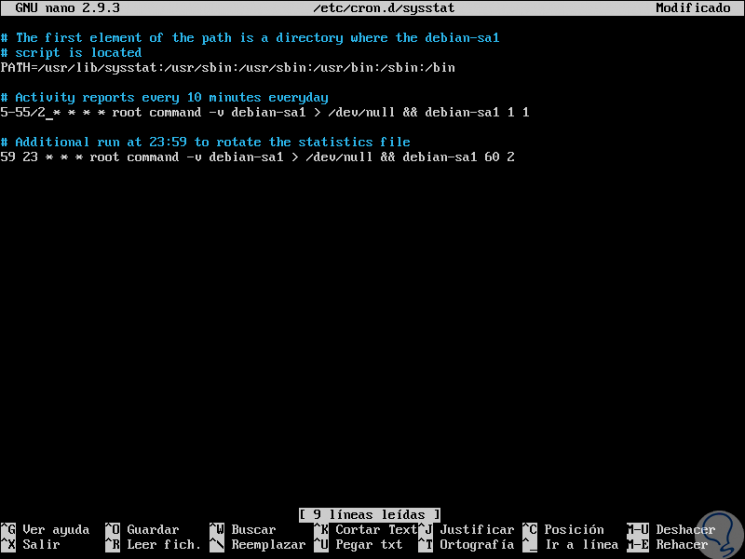
In this case we enter the number 2 to run every 2 minutes. We save the changes and leave the editor..
Step 6
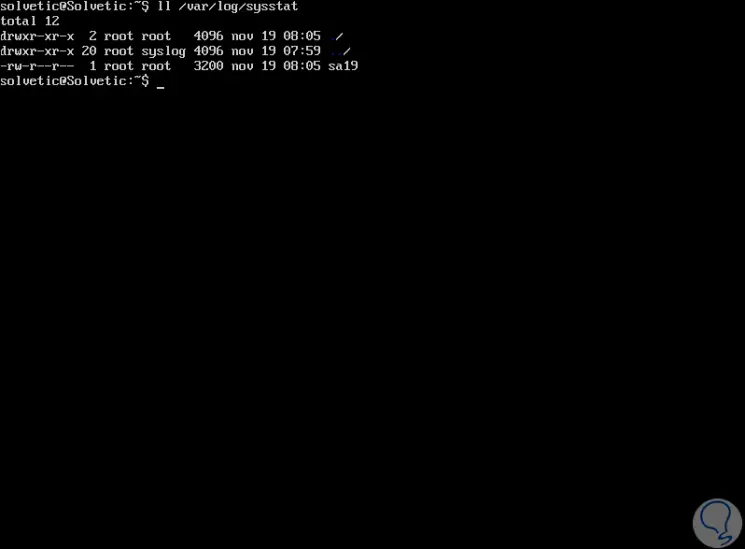
After a period of time, we can run the following line to see the data that has been collected in Ubuntu 18:
ll / var / log / sysstat
Step 7
We can also directly execute the sar command to see the collected results:
Step 8
As in CentOS 7, we have the options to see specific elements such as:
CPU
sar -W
System load
sar -q
Sysstat is a valuable tool for collecting and managing information not only in real time but in periods of time for Linux environments.