Among the most used operating systems we can find Windows 10 and macOS, but it is true that in this podiúm Linux has a deserved place due to features such as the security it offers, the flexibility margin when we want to install any of its distributions, its free character or the stability that it presents to us when we use it among other benefits. This means that it is among the most used and is increasingly chosen by more users..
Monitoring applications are one of the most comprehensive and functional ways we have as administrators or support group; and that work in order to carry out the best auditing , support and error prevention controls in any of these systems.
The objective of a monitoring tool is to provide the best alternatives both graphically and as a console for the generation of information that will be used for support and control purposes . One of these tools dedicated to this end is Prometheus ; which gives us the possibility to collect metrics of all installed applications and store them in a database, particularly in a database that is based on DB..
It is for this reason that in this tutorial TechnoWikis will explain what it is and how to use Prometheus in Linux Ubuntu 18.04 step by step.
What is Prometheus?
Prometheus has been developed as a set of specific tools for monitoring and alerting open source systems, which was created at the beginning of SoundCloud.
Prometheus is an independent open source project and for this it joined the Cloud Native Computing Foundation in 2016.
What solutions does Prometheus offer?
- Be a multidimensional data model that has time series data, which are identified by metric name and keys or value.
- Consolidate as a flexible query language to make the most of its dimensionality.
- Its single server nodes are autonomous.
- It has a collection of time series which are executed through an extraction model through HTTP.
- Your time series is supported through an intermediate gateway.
- Each of your metric goals is discovered through a service discovery or static configuration.
- It has multiple modes of graphic and dashboard support
Prometheus development components
- A main Prometheus server that analyzes and stores time series data.
- Various client libraries in order to implement application codes.
- It has a gateway to support short-term work.
- It has specific purpose exporters for services such as HAProxy, StatsD, Graphite, and more.
- Integrates an alert manager for the administration of alerts to administrators.
- It has several support tools
Prometheus removes metrics from instrumented jobs, either directly or through an insert gateway for short-term jobs. In addition, it stores all the samples locally and there it executes rules on the data in order to add and register new time series based on that data or in order to generate the alerts, then we can use third-party applications to view the information collected..
Each server with Prometheus is independent, so it does not depend on network storage or other remote services that can directly affect its stability and performance.
Prometheus global features
Storage enhancements
This is achieved thanks to the fact that Prometheus has a local time series database on the disk, but there is also the possibility of integrating it with remote storage systems.
Dimensional data
Prometheus is responsible for storing all data using the time series model, where the flows of values ​​with timestamps that belong to the same metric and the same set of dimensions are labeled. In addition, Prometheus is able to generate time-derived time series as a result of the queries executed by the administrator.
Better display options
This is achieved since Grafana is compatible with Prometheus queries. The Grafana data source for Prometheus is included since Grafana 2.5.0.
More efficient queries
Prometheus offers a functional expression language which gives the administrator the opportunity to select and add time series data in real time, then this result can be displayed as a graph, viewed as tabular data in the Prometheus expression browser or Access it through external systems through the HTTP API.
Simple operation
When using Prometheus it is configured through command line indicators and a configuration file. Thus, with the command line indicators you can configure system parameters such as storage locations, data to be saved on disk and memory, etc., in the configuration file everything related to job analysis and their respective instances is defined . If we want to see all available command line options, we must execute:
/ prometheus -h
Greater integration
One of the best Prometheus options is that we have a number of libraries and servers available to export existing third-party system metrics as Prometheus metrics. Thus we have better options to see the data generated by Prometheus, some of these options are:
- Storage (Ceph exporter, Ceph RADOSGW exporter, Gluster exporter, Hadoop HDFS FSImage exporter, Luster exporter, ScaleIO exporter)
- Database (OpenTSDB Exporter, Oracle DB Exporter, PgBouncer exporter, PostgreSQL exporter, ProxySQL exporter)
- Hardware (IBM Z HMC exporter, IoT Edison exporter, IPMI exporter, knxd exporter, Node / system metrics exporter, NVIDIA GPU exporter)
- Messaging systems (Gearman exporter, Kafka exporter, NATS exporter, NSQ exporter)
- HTTP (Apache exporter, HAProxy exporter, Nginx metric library, Nginx VTS, exporter, Passenger exporter)
Multiple client libraries
Prometheus offers us the option of using various libraries in order to define and expose internal metrics through an HTTP endpoint. Within the official libraries we have Go, Java or Scala, Python and Ruby, within the unofficial ones we find libraries such as Bash, C ++, Common Lisp, Elixir, Erlang, Haskell, Lua for Nginx, Lua for Tarantool, .NET / C #, Node.js and PHP.
Now we will see how to install Prometheus on Ubuntu 18.04.
1. How to install Prometheus repositories on Ubuntu 18.04 Linux
By default, Prometheus is not available in the default Ubuntu 18.04 LTS (Beaver Bionic) repository, for this reason, we must add the repository.
For this purpose we execute the following line in which we will also add the GPG key:
wget https://s3-eu-west-1.amazonaws.com/deb.robustperception.io/41EFC99D.gpg | sudo apt-key add -
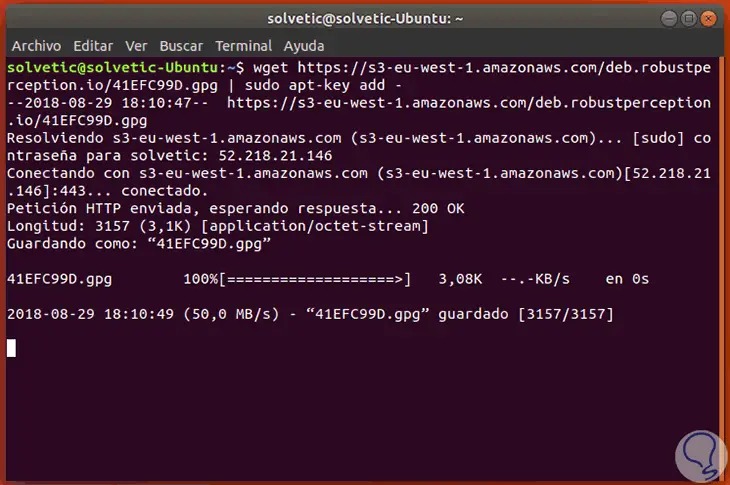
We proceed to update the repository:
sudo apt-get update -y
With this command we will have updated the repository.
2. Prometheus installation on Ubuntu 18.94 Linux
Step 1
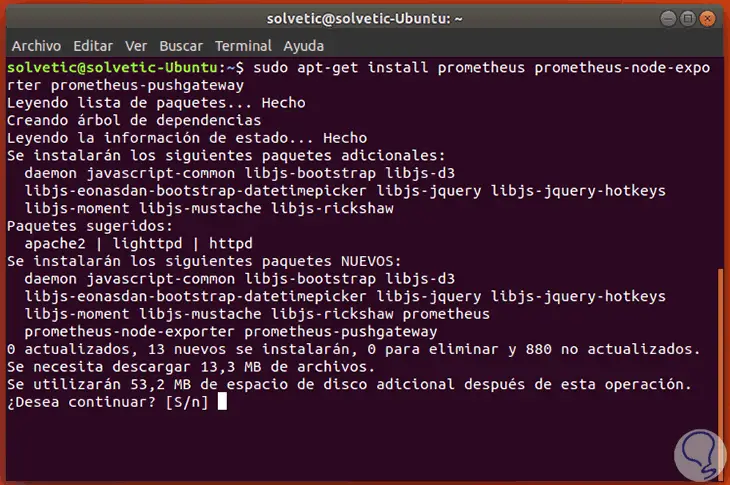
Now we are going to install Prometheus by running the following line:
sudo apt-get install prometheus prometheus-node-exporter prometheus-pushgateway
Enter the letter S to confirm the download and installation of Prometheus in Ubuntu 18.04.
Step 2
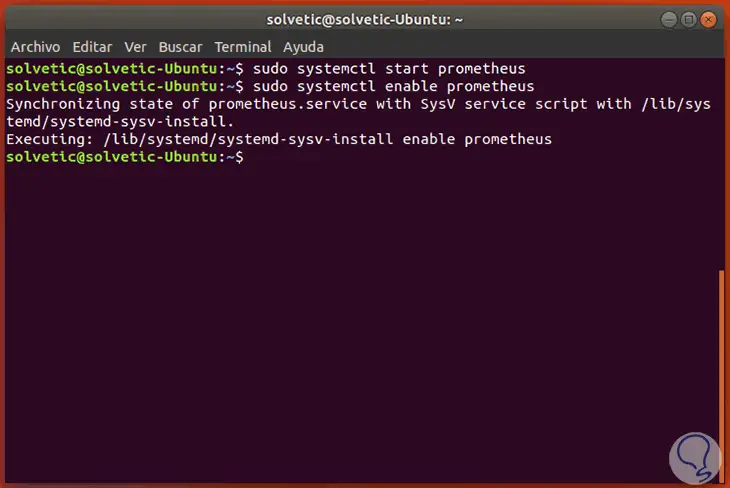
Once installed, we will enable the service and configure it to run on system startup:
sudo systemctl start prometheus sudo systemctl enable prometheus
Step 3
Finally, we validate the status of Prometheus by executing the following command:
sudo systemctl status prometheus
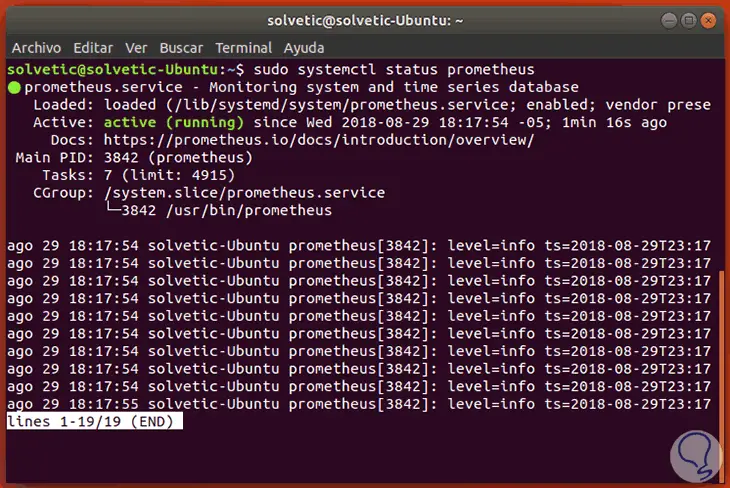
Once we validate that your status is active we will be ready to access Prometheus.
3. How to access Prometheus in Ubuntu 18.04 Linux
Step 1
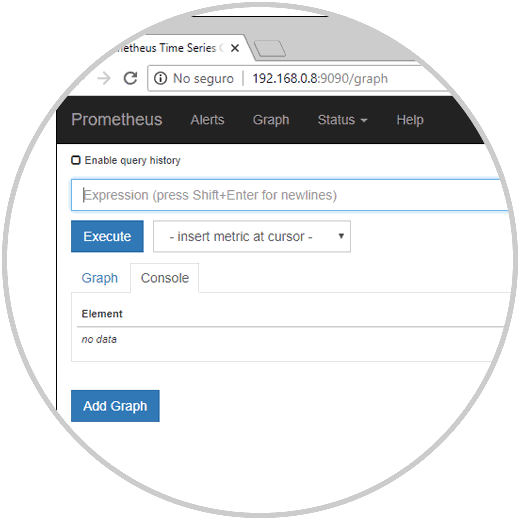
Prometheus is installed and listening on port 9090, so we will use the following syntax for access from a browser:
http: // Server_IP: 9090
The initial environment will be as follows:
Step 2
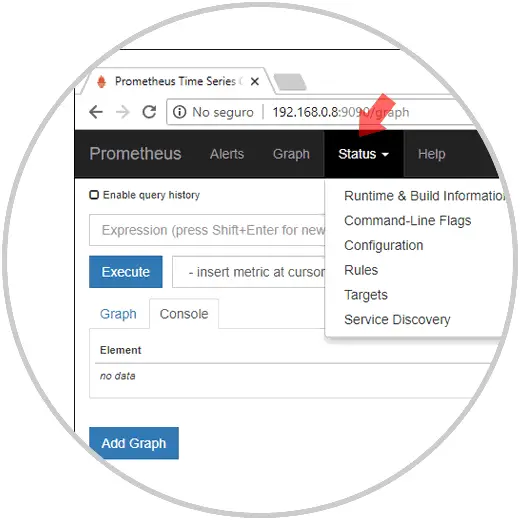
As we see there we have a series of options for both alerts and graphics, by clicking on the "Status" section it will be possible to perform actions such as:
- Access the command line options
Step 3
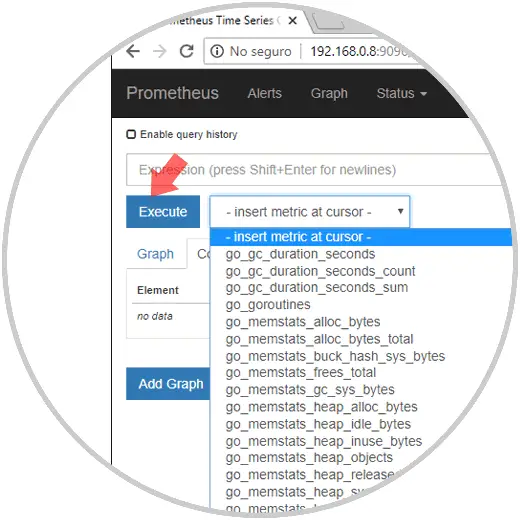
In the graphics section we will have a wide range of options to use for the representation of the graphics to be used. Select the most appropriate option click on the Execute button
Step 4
We will have the results in two different ways:
In this way Prometheus is a practical and complete alternative to monitor and carry out the monitoring of our applications in Ubuntu 18.04 .