Excel is a spreadsheet tool found within the Microsoft Office suite and suite. Excel is a program that is used to store information, to be able to save the information, organize it in sheets and tables, keep track of and monitor the data, to perform calculations with the data that help us to carry out reports and analysis. With Microsoft Excel we can shape our data, which we will organize in tables, where we can add more information by performing calculations, combining the data and providing visualizations, which we call graphics, which will help us in the more analytical section..
The fact that Excel is among the "basic" office applications is no coincidence. Excel is probably the best known calculation tool and also the most used. Within the Office suite there is a basic package of applications and programs that are very useful to be able to carry out office work productively. It is a kit of programs with which we can carry out the essential and necessary functions when we work in front of a computer, such as sending an email (Microsoft Outlook), making a presentation (Power Point), creating and manipulating a database. data (Access), or writing for different purposes (Word).
Within the Microsoft office suite there is also Excel , the program with which we will process data and text information, and use to organize, keep track of, perform calculations, and analyze and report information .
1 What is Excel used for, what can I do with a calculation tool?
Next, we are going to see how Excel is used, how to take advantage of an Excel sheet. In what sense, and what objectives can we ask of the Microsoft spreadsheet tool:
Organize the information: We can organize the information in several Excel files. Within the same file, we can have several sheets, and within each sheet, the information is organized in cells, where we will usually find numerical data in various formats, such as a value, a price, a date or a percentage, but also we can find text in the cells that is associated with numerical values to make sense of the information..
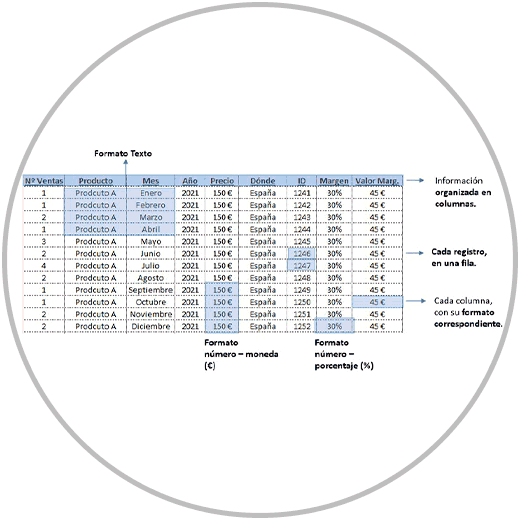
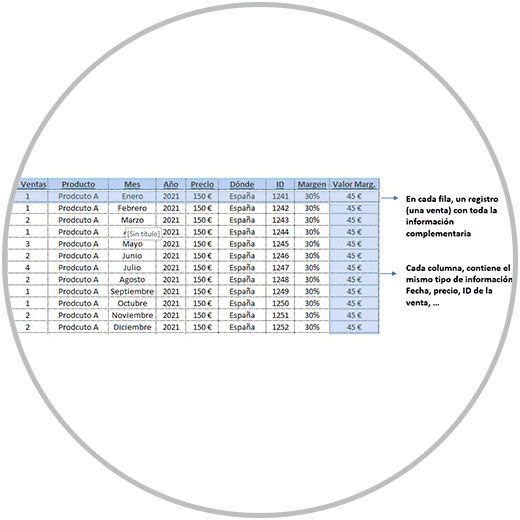
Information in Excel is collected at the cell level, and is arranged in rows and columns. Normally in the columns we have a header, with the concept of the information that we are going to see in the column. And in the row the records are added.
What is a cell in Excel?
A cell in Excel is the rectangular space where we can write text, numbers, or perform a formula. Cells in Excel have coordinates that are used when referencing in formulas. When we talk about "referencing" in Excel, it is precisely the action of using these coordinates that uniquely identify a cell or a range of cells in a formula, function or operation.
References or coordinates are usually used in formulas and in functions to be able to tell Excel the cells or range of cells that we want to include in the operation that we are going to perform.
In practice, this is much easier than it seems, since we can directly use the mouse of our computer (or even the keyboard) to select the cells or range of cells that we are going to use when doing the analysis. calculation. You don't have to worry about having to look at the coordinate of a cell every time we perform a formula or function..
If at any time we want to see what references a formula has, it would be enough to double click on the cell where the formula is, or press the F2 key on our keyboard. Thus we will see highlighted with another color the cell, cells or range that we are using to make the calculation or operation.
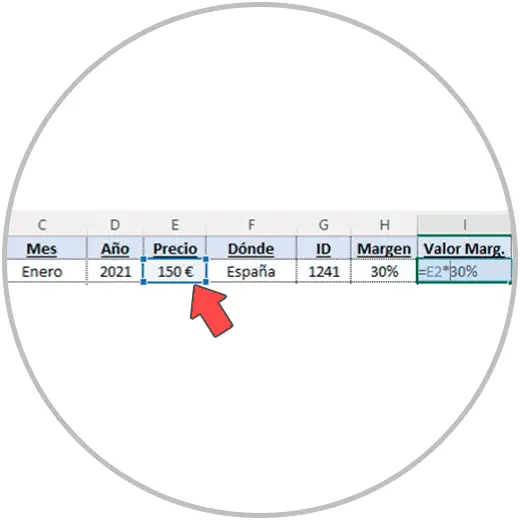
These coordinates or references have a row number and a letter in the columns, as in the example you can see in the image.
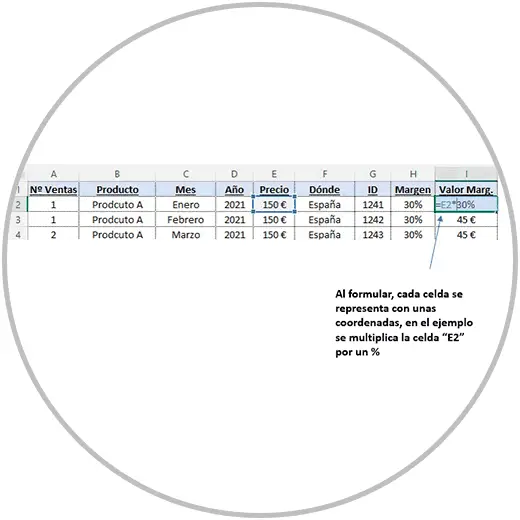
As you can see in the image above in column "I", we multiply cell "E2" by a percentage. In this way, we can make formulas using any cell in the document, even with cells that are in other documents.
In a cell of an Excel sheet, we can write letters, numbers and dates; We can apply a style, assigning a certain color to the cell, or highlight it by assigning a color to the letters or numbers. Cells in Excel are "bricks" that we use to create our tables and generally organize the information that we are handling.
Depending on the information contained in each cell, we can apply different formats; We must always think that, although we can apply an individual format to each cell, when we are creating a table we will generally apply a certain format to an entire column, except for the headers that will usually be text.
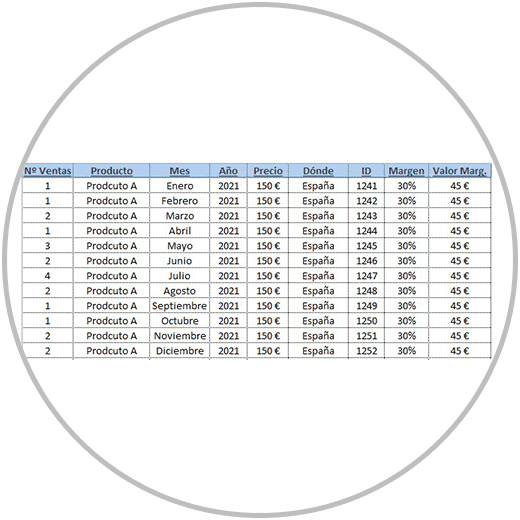
For example, if we have an Excel where the sales that a company has made are reflected, we can find columns like:
- The number of sales made by the company: The appropriate format would be number, an integer value without decimals.
- Another column with the name or concept of the product sold: In this case, the cell and column must have a text format.
- A column with the price of the product: The format of this column, which we should apply, would be that of number-currency.
- We could also find a column with the date when the sale was made. In this case we would apply a date format to the cells.
- We could see in the Excel file the profit margin of each product, which could be reflected in a percentage value, with or without decimals.
In the image below, we can see how in the same Excel table, we can have the information organized in several columns, applying the appropriate format in each column: A percentage, a number and currency format, dates, text, etc.
Important:
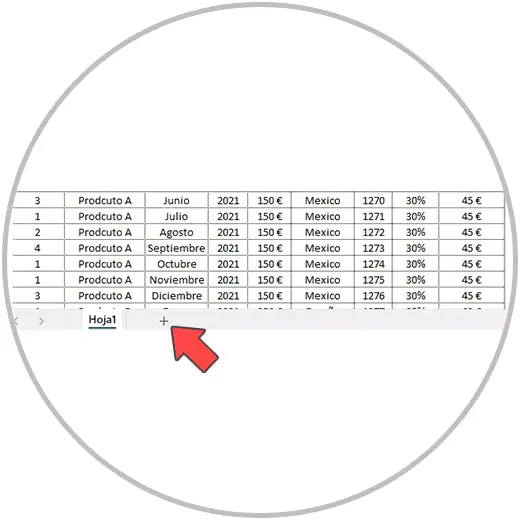
When we open Excel, we will see below that we are working on Sheet 1 by default, but that we can add sheets to the document according to the need and organization that we want to carry, in order to add information to the document more independently. If we have information, for example, of a different nature that we want to add to the same document, but separately, we can add new sheets to the document.
As we will see later, we can then perform operations using cells that are in other sheets and in other documents in the formula. A factor to take into account, if we prefer to separate the information in different sheets. Knowing that we can reference cells from other sheets will not limit us when it comes to organizing our data as we want.
In Excel, we can save data and information in an orderly way: The work we do can be saved in a file or in several files that we can open at any time, when we need them. Excel is commonly used on a personal and professional level as a reporting tool, where every day, week or month, we can open and save the document, updating the data and changing the name with the date on which we update the report. In this way, we are creating a record where we will be able to open the document that is updated every week. We can also create one or several folders in Windows to save our Excel files in the order we need.
Edit the information: perform calculations, create tables, graphs . Excel is an excellent tool to be able to process data, to be able to shape the information in tables (with columns and rows, as we explained previously). Also to be able to add new columns, new records or rows, to be able to obtain new data by performing calculations and operations, which we can obtain through the use of formulas and the functions that are at our disposal.
Important:
In Excel we can work from files already created by us or by other people to edit them or treat the information by creating new calculations, adding more information to new sheets, etc. But we can also open a "blank book" and start creating our tables, graphs and save the information
.
On many occasions, Excel is used as a tool to carry out simple and specific calculations, or we can also use Excel to make a data table, graphs, etc. It must be said and known that Exel is a tool that has a lot of baggage, and in its multiple versions, new functions have been incorporated that have improved usability, tools and functions to be a more practical tool.
We are going to see below what tasks we can carry out in Excel, to know when we can use Excel, when we should use Excel, to definitely know the potential of Excel and to be able to use it when we are in a situation where Excel can save us a lot of time.
2 Tasks that we can perform in Excel
Next, we are going to see some of the most common tasks that we can carry out in Excel.
- We can create new spreadsheets: As we have seen, Excel is a powerful tool when it comes to creating new spreadsheets, with the information organized in tables, in rows and columns. We can also add new sheets to the document, and make new tables, enter data, and do calculations between cells, even between cells that are not on the same sheet.
- Enter new data: in Excel, when we are working on a sheet of a file, we can write or paste data from other sources into the cells. We can open a blank data sheet, or we can work on an existing Excel document. We can import data from other tools as it is a very common tool.
- In Excel we can edit the information of a sheet . We can from changing the data entered, to adding new information in new rows and columns.
- Shape the data: As we have seen, the way to organize the information in Excel is by creating tables that are organized in rows and columns. We can format a specific cell, a set of cells, an entire column, a table, or even an entire Excel sheet. The most important thing is to keep in mind that we can and should format our cells and columns. In this way, each value, or information that a cell or column contains, is represented in the way that is best understood. If it is a column, for example, where we are entering product prices, we must apply a number and currency format, and add decimals if necessary, so that the information is correct, and can be read and interpreted properly. If we are talking about €,
- We can also apply a layout format to a data set, to a table, or even to a cell . Depending on the objective, the important data that we want to highlight in the information, to differentiate the totals of a table, for example, the headers, or highlight columns that are important within a table. We can apply a different color to the cells, we can make text bold, for example. In terms of design and aesthetics, it will help us organize the information in tables, apply the appropriate format to the cells according to the value that we are representing, and give that table a design that makes it easier to read.
- We can also perform calculations and formulas in Excel . One of the most recurring uses in Excel as it is a spreadsheet. In Excel we can carry out a very wide variety of operations and calculations; We can do simple operations of addition, subtraction, multiplication, etc. But we can also do more complex calculations using Excel functions. For example, to be able to create a conditional formula, and obtain a personalized data that is important for the subsequent analysis.
- When making calculations, or doing operations, we can use all the cells of a document , even if they are on different sheets. In short, we can refer to any cell in the document. To simply bring us a value that is on another sheet of a document, or that is even directly found in another document, or to perform an operation where we are, for example, adding cell values that are on different sheets, and even different files
- Data analysis: In Excel, as we have already seen, we can create formulas and use functions to obtain useful values that help us better interpret the results. An example would be making a summation of a column to know the total value of sales made in a month, and to be able to compare them with the sales of the previous month, and of the same month of last year. When analyzing the data, one of the most used, necessary and practical functions, which we are going to use yes or yes, are the graphs . By making graphs in Excel we can put into perspective the evolution of the data in a certain time to know the trend, and locate and analyze falls. The graphs also help us to be able to compare a metric, at different moments in time, or directly face important metrics or values in the same graph. When it comes to analyzing, graphics turn out to be a very powerful tool due to their visual contribution as they represent a set of data that facilitates analysis and helps in decision making.
- There are Excel functions that are more advanced, such as pivot tables and macros : these types of tools present in Excel provide advanced options when it comes to automating reports, help a lot in analysis, and allow us to create tables and graphs to be able to group, represent, and calculate data.
- Reporting: With Excel we can create simple reports or more advanced and complete reports such as Dashboards or scorecards; We can also make these reports interactive, so that the person viewing it can filter the information in a personalized way. These reports, whether simple or more advanced, can be shared so that other people can review the work done, or can make decisions based on the reports created. It is a very common tool that companies usually use to share data, or report results, with other people in the same organization, and with "external" people who play an important role in the business, such as customers or suppliers.
In summary:
One of the most important aspects when getting started in Excel is to keep in mind that knowing
Excel is synonymous with saving time, productivity, and organization . There are tools that complement the basic functions of Excel, such as pivot tables, and other tools outside the office environment, such as Power BI, that perfectly complement Excel to be able to model data, perform complex calculations, and create advanced reports.
But first, we must learn how to organize data, squeeze Excel functions; Start at the base, learn from the multiple functions that Excel has to help us on a day-to-day basis, and above all to be able to start organizing the data. Create a logical structure, creating data tables, with columns and rows, formatting the cells and columns of our tables, and learning to perform simple and complex calculations, in easy ways to be able to represent the data in graphs that help us in the readings, data interpretation
.