There are several utilities that have been developed to help us maintain central control over services, values, applications and other elements that are installed in our Linux operating systems and this is useful for administration, auditing, support and general management tasks as it generates data in real time and with the correct values. One of these applications is Grafana which was designed with the best performance of metrics in mind and therefore TechnoWikis will explain in detail how to install and use Grafana in Ubuntu 18.04 ..
What is Grafana
Grafana is a free and open source tool focused on monitoring and visualization of data at the enterprise level with support for Graphite, InfluxDB, Prometheus, Elasticsearch and many more databases available in the market.
With Grafana it will be possible to consult, visualize, alert and understand the metrics regardless of where they are stored which gives us a higher degree of administration.
Features
Among its characteristics we find:
- Multiple display options as we will have access to multiple types of graphics, panel add-ons and many more options to display metrics and records.
- It has an alert system where each metric will be under an evaluation process for a defined period of time and, if any difference is found, an alert will be generated from this situation.
- Extensive notification options, these are given when an alert modifies its status and it will be possible to receive notifications by email or through platforms such as Slack, PagerDuty, VictorOps, OpsGenie or webhook.
- It has dynamic dashboards with which we can create dynamic and reusable dashboards using various template variables in which drop-down menus and more actions can be added.
- Mixed data sources which allow to mix different types of data in a single graph to have a better concept of information.
- We have annotations which can be added to the graphics with events through different data sources, thus, when hovering over the events, the metadata and event tags will be displayed in a much more detailed way.
- Ad-hoc filters that allow you to create new filters by key or value without having to turn off the system, and these filters will be automatically applied to all queries from that data source.
- It has a dark theme in case we want to create a new visualization impact.
1. How to install Grafana on Ubuntu 18.04
To install Grafana on Ubuntu 18 we have two alternatives.
Option 1
The first option is to add the Grafana repository to the system, for this, we will use the following command:
sudo nano /etc/apt/sources.list
There we enter the following:
deb https://packagecloud.io/grafana/stable/debian/ stretch main
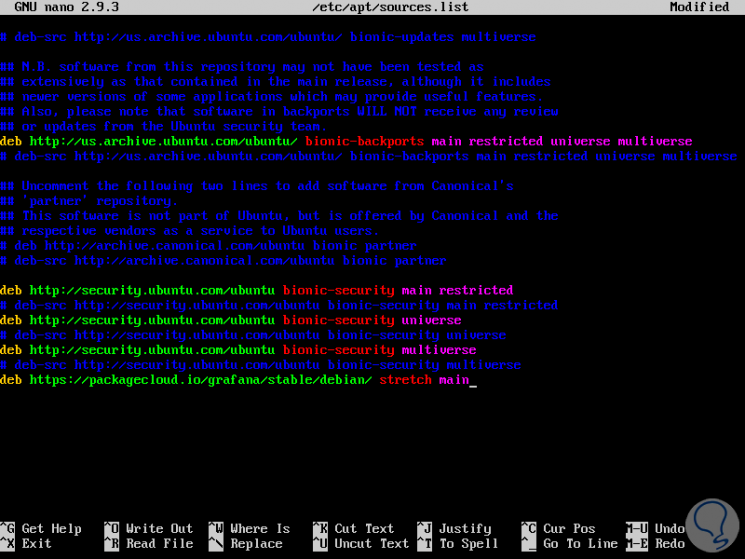
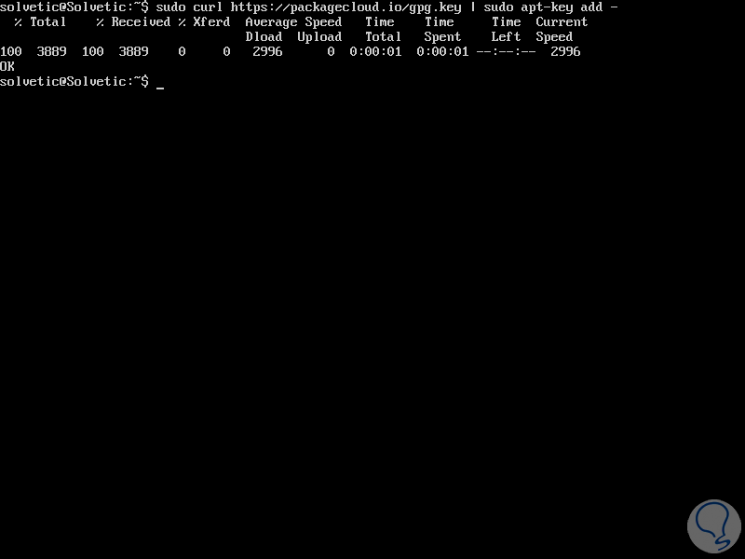
We save the changes using the Ctrl + O keys and exit the editor using Ctrl + X. Then we will add the GOG key using the following line:
sudo curl https://packagecloud.io/gpg.key | sudo apt-key add -
Subsequently, we update the repository packages:
sudo apt-get update -y
We install Grafana by running:
sudo apt-get install grafana -y
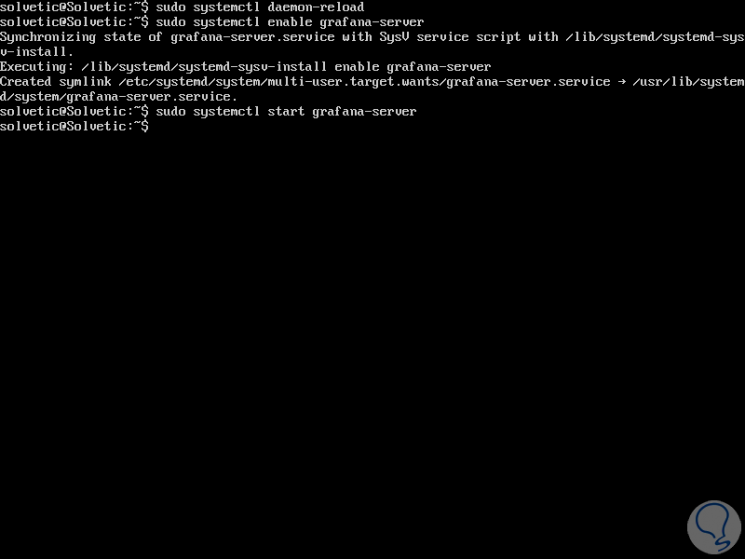
With Grafana installed on Ubuntu 18.04, we proceed to start the service and enable it for startup at startup by running the following lines:
sudo systemctl daemon-reload sudo systemctl enable grafana-server sudo systemctl start grafana-server
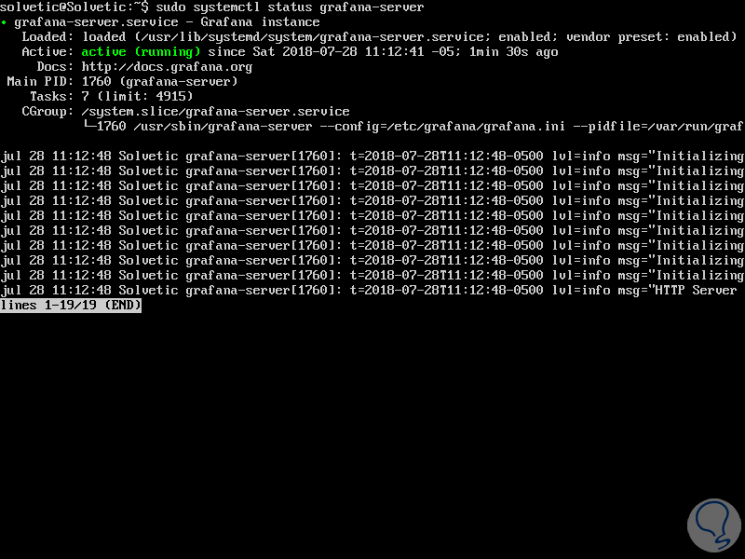
We proceed to check the status of Grafana by executing the following line. We can verify that the state is active.
sudo systemctl status grafana-server
2. How to access Grafana in Ubuntu 18.04
Step 1
To access Grafana, we will go to a browser and there we enter the following syntax:
http: // IP_address: 3000
There we enter the following credentials:
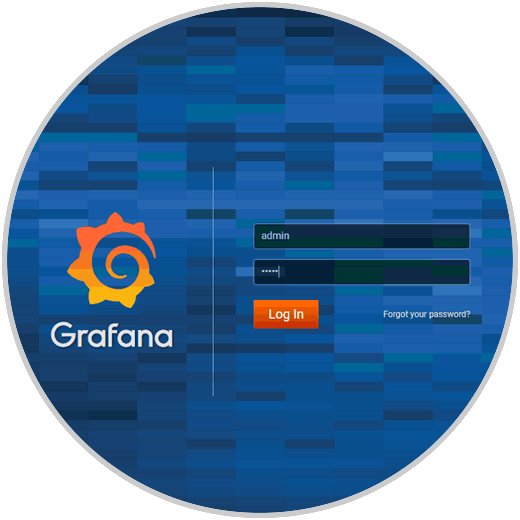
Step 2
Click on the Log in button and it will be necessary to change the access password:

Step 3
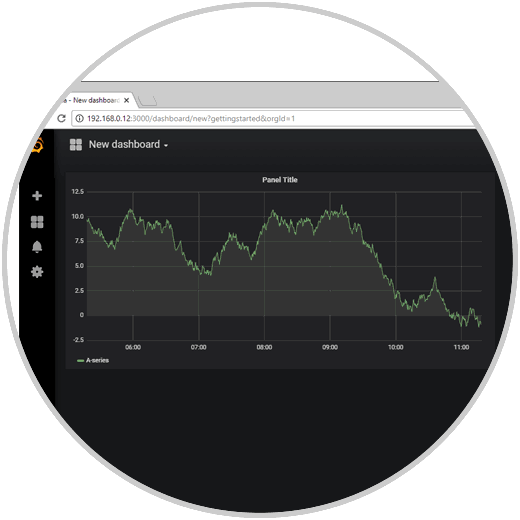
When accessing Grafana this will be your environment:
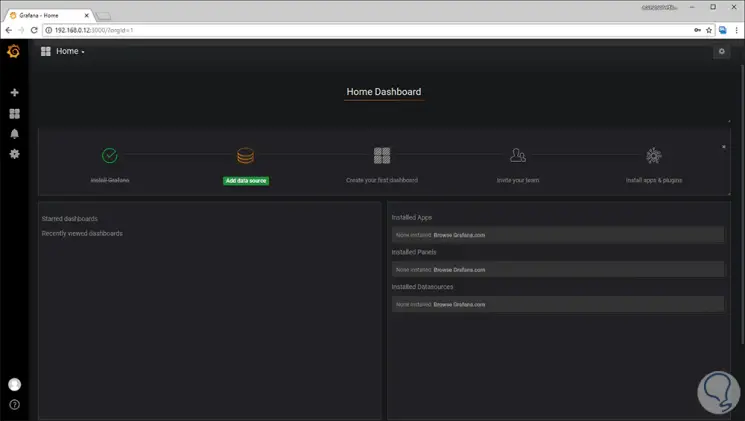
Step 4
From there it will be possible to access the various options to add new boards, apps, etc:
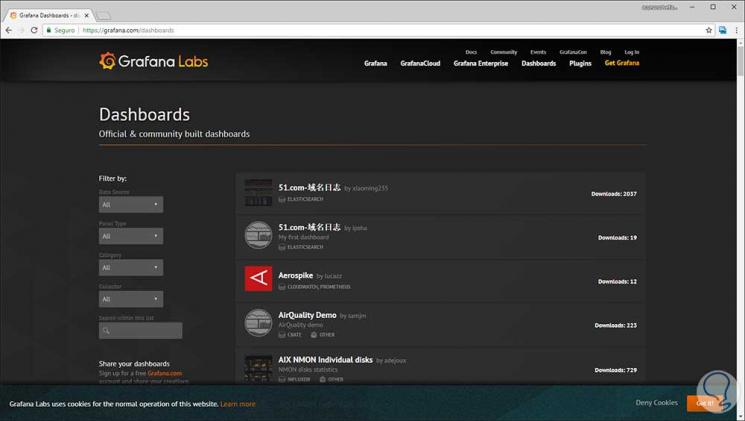
Step 5
It will also be possible to create our own graphics:
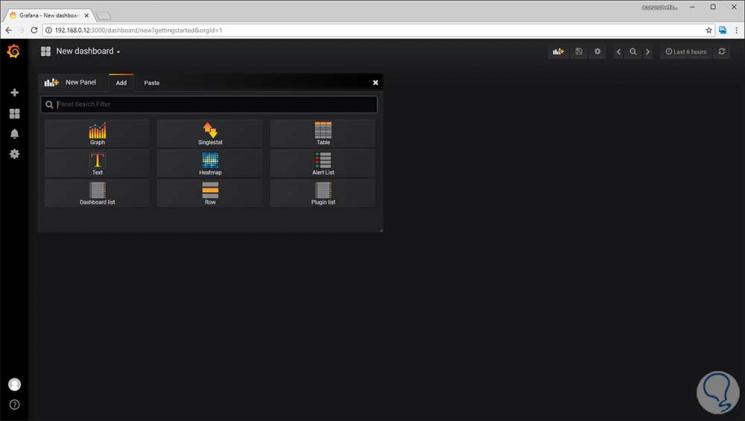
Step 6
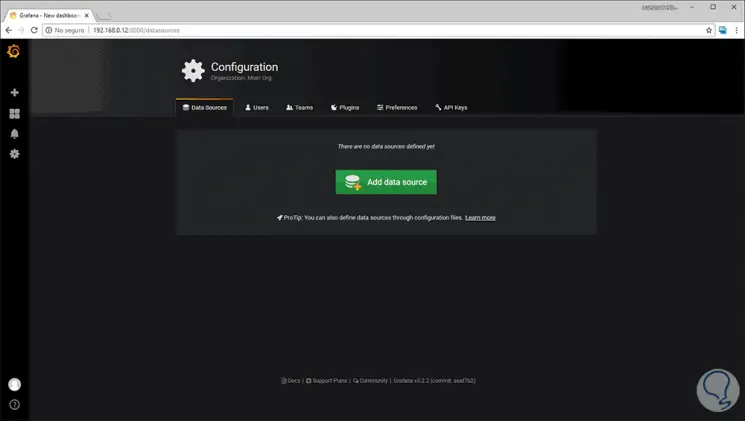
Based on the desired style we can add the data source:
Step 7
We have a special section to add the data source:
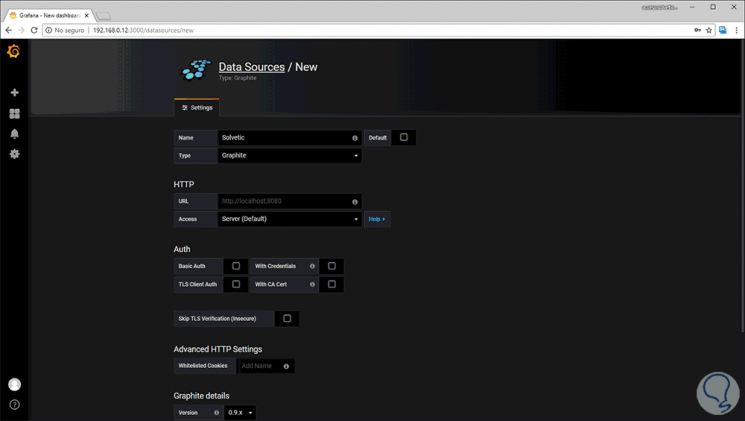
Step 8
From there we assign the desired name and the values ​​to be configured:
Thus, Grafana is an integral solution to manage metrics in Linux..