To stay up to date, remember to subscribe to our YouTube channel!
SUBSCRIBE ON YOUTUBE
There are countless commands that we can use in Linux environments for numerous administrative tasks and at the network level, one of the most common but at the same time one of the most important is the netstat command. Netstat (Network Status), is a command with which it is possible to have access to complete information on network connections and network statistics. Thanks to netstat we can see open ports, active connections and other network statistics that are ideal for support tasks..
Characteristics
Among the characteristics of this command we find:
- We will have access to the list of ports listening
- You can view network routes
- Have access to active connections and the IP addresses and ports associated with these connections
Parameters
Netstat offers us a wide set of parameters such as:
- -r, --route: View the routing table
- -i, --interfaces: display the interface table
- -s, --statistics: generate network statistics
- -g, --groups: display multicast group membership
- -M, --masquerade: allows us to see the masked connections
- -v, --verbose: Provides a detailed description
- -n, --numeric: address names will not be resolved
- --numeric-hosts: does not resolve host names
- --numeric-users: does not resolve by usernames
- -e, --extend: show more information than the basic one
- -p, --programs: display the PID name of the sockets
- -l, --listening: Allows you to see the sockets listening to servers
- -a, --all: deploy all sockets
TechnoWikis will explain how to use this netstat command in Linux to access this network information.
How to use netstat on Linux
Step 1
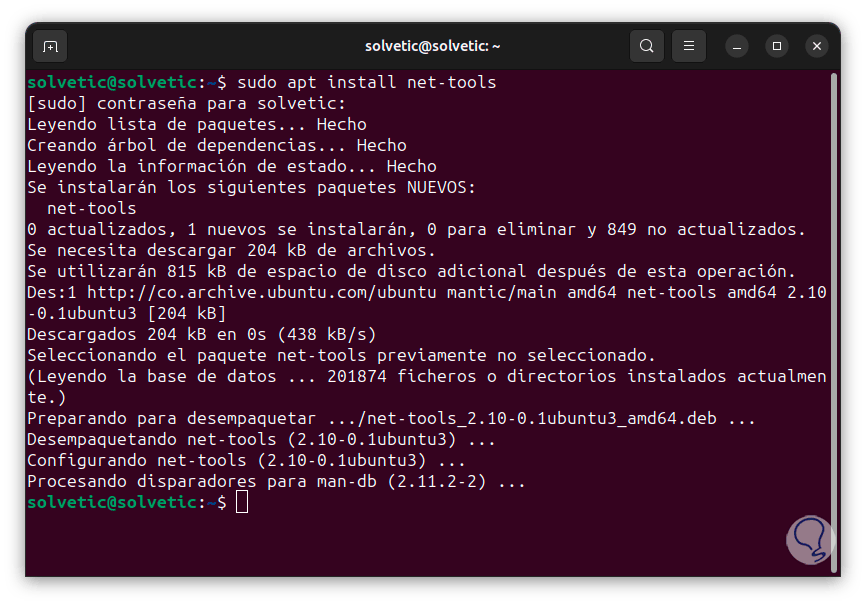
Before starting, if we do not have Netstat, we can install it by executing the following command:
sudo apt install net-tools
Step 2
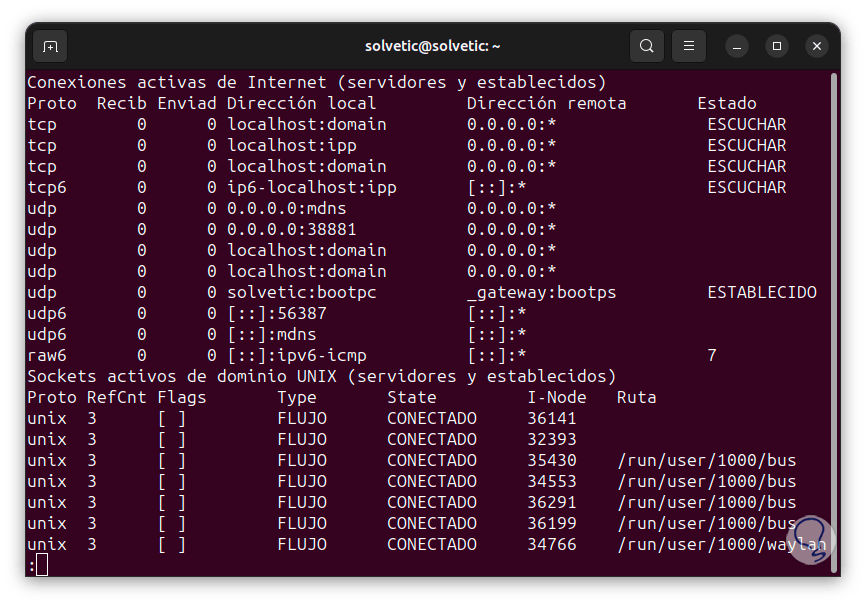
First of all, we are going to see all the sockets connected and waiting, to do this we will use the -a parameter as follows:
netstat -a | them
Step 3
We can see various columns with information about our sockets, we find two sections that are:
- Active Internet Connections: Refers to connected external connections and local sockets that can listen for remote connection requests.
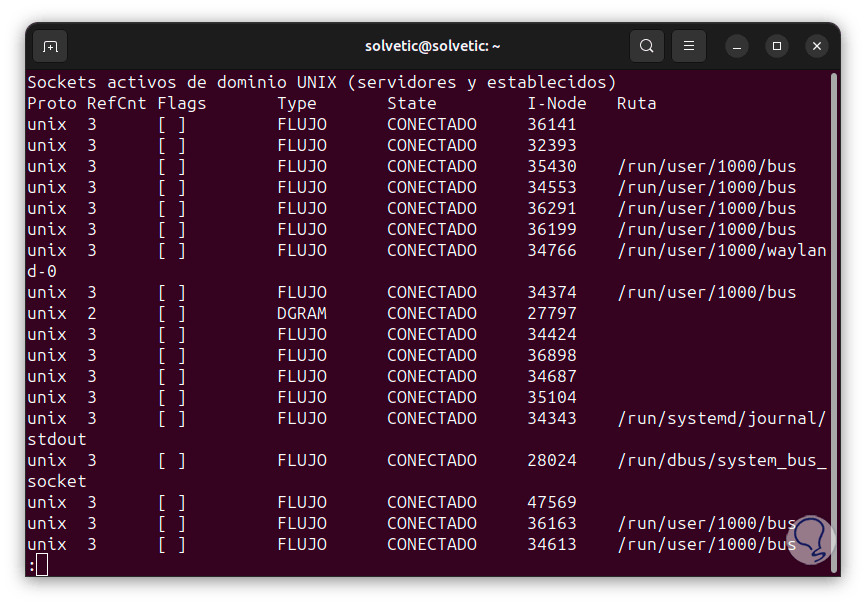
- UNIX Domain Active Sockets: View internal connected and listening connections.
In the Active Connections section we find some columns such as:
- Proto: is the protocol used in that socket
- Receive: These are the incoming bytes received and stored in the buffer.
- Send: these are the bytes ready to be sent from the send queue.
- Local address: it is the address of the local end of the connection, by default we will see the local host name in the address and the service name in the port.
- Remote address: is the address and port of the remote end of the connection.
- Status: Indicates the status of the local socket.
In the case of UNIX sockets we find extra columns such as:
- RefCnt: Indicates the number of attached processes connected to this particular socket.
- Flags: There are some values like ACC (SO_ACCEPTON), SO_WAITDATA, SO_NOSPACE, etc.
- State: is the state of the socket, the options are FREE, LISTENING, CONNECTING, CONNECTED, DISCONNECTING.
- I-Node: is the file system inode for that socket.
- Path: is the system path of that socket.
Note
We can press the Enter key to continue seeing results.
Step 4
Now, it is possible to see only the sockets associated with TCP, in this case we execute the following: We see the details of each of them.
netstat -at | them
step 5
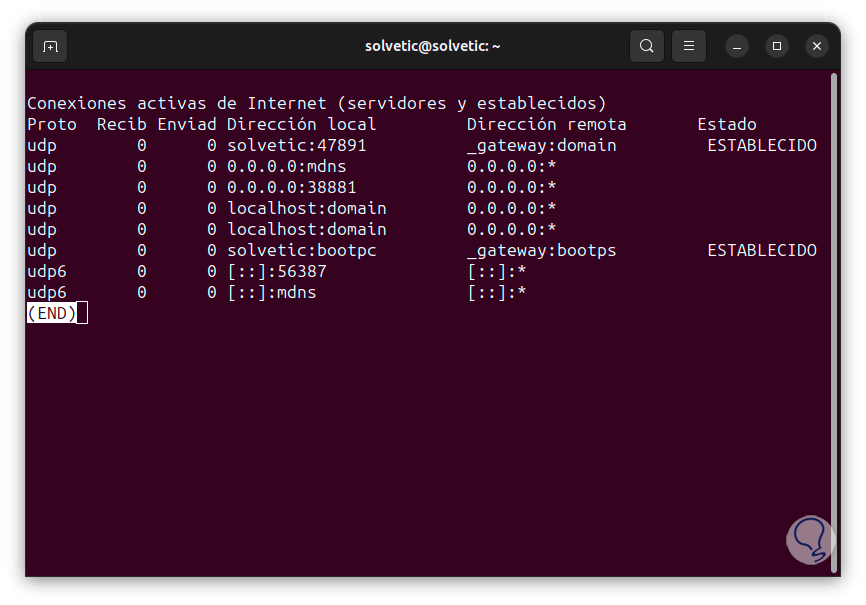
In the case of UDP, we are going to execute the following:
netstat -au | them
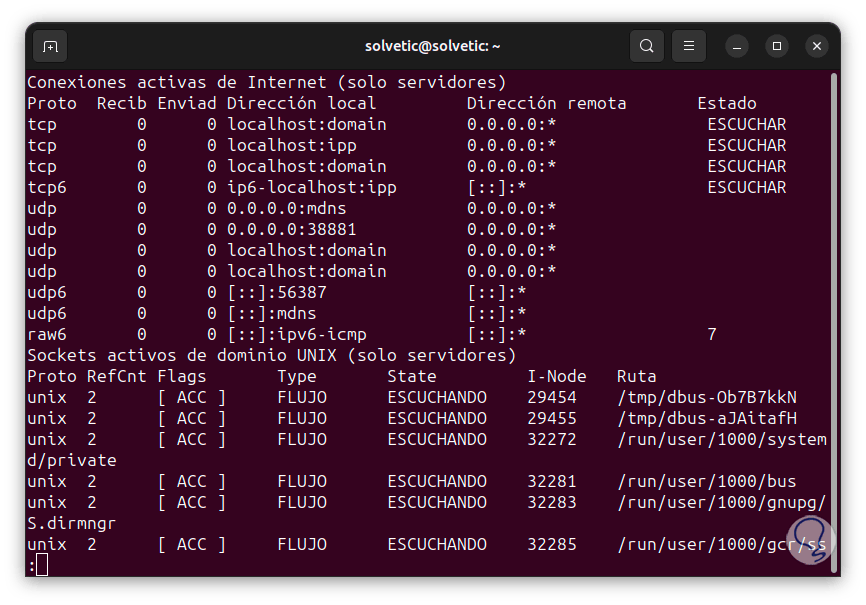
step 6
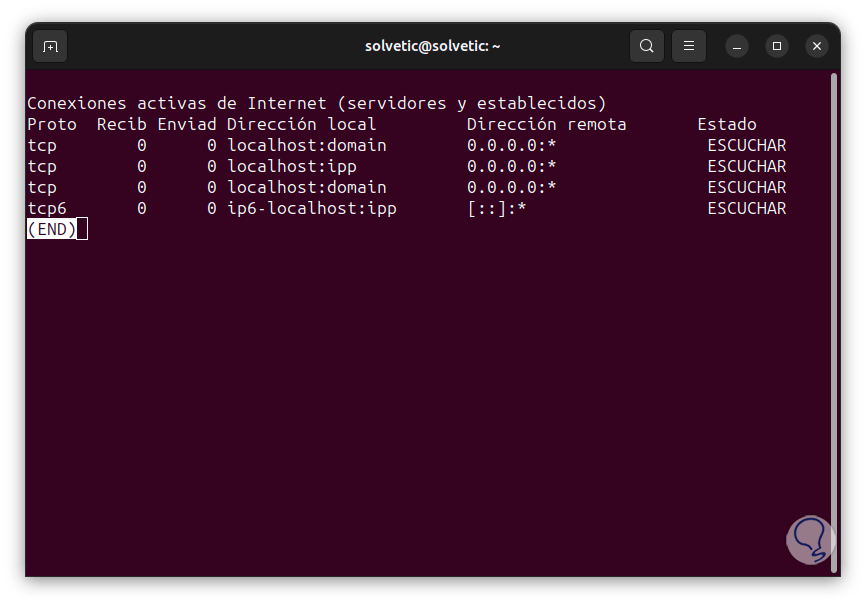
To see the sockets that are listening on Linux, let's run the following:
netstat -l | them
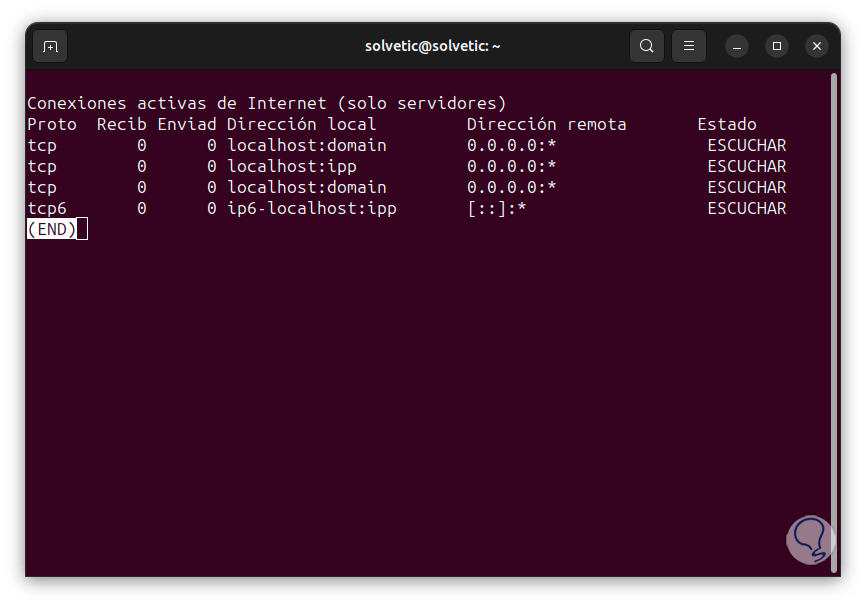
Step 7
For this case we can use combinations and search for TCP or UDP sockets, for example, in the case of TCP we execute:
netstat -lt | them
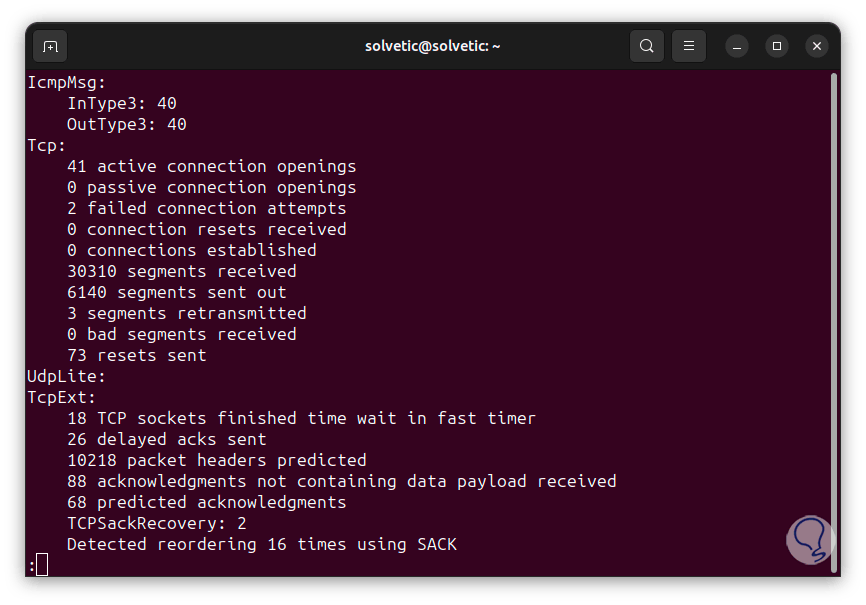
Step 8
An essential option of Netstat is the possibility of generating statistics based on the protocol, for this we are going to execute the following command. We see the details of each protocol comprehensively.
netstat -st | them
Step 9
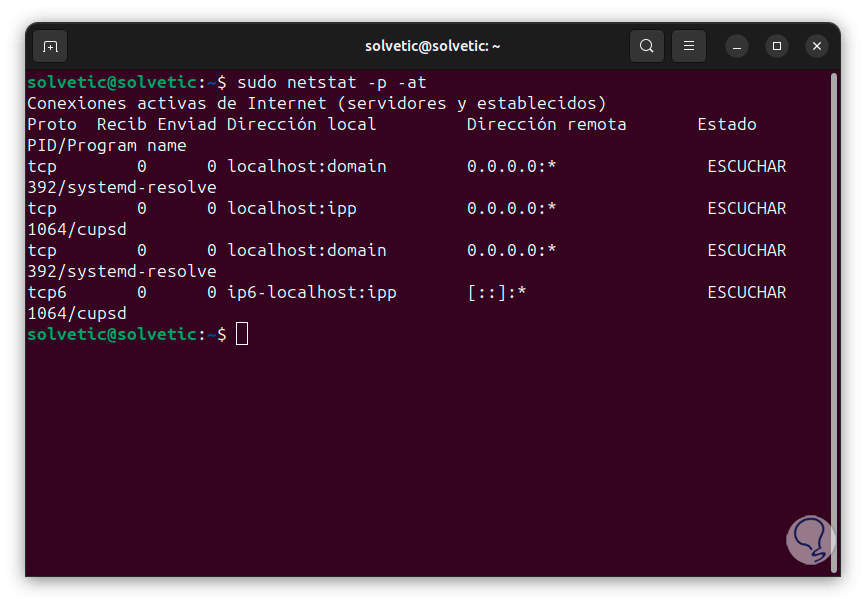
To access the PID of the process, we are going to use the following command:
sudo netstat -p -at
Step 10
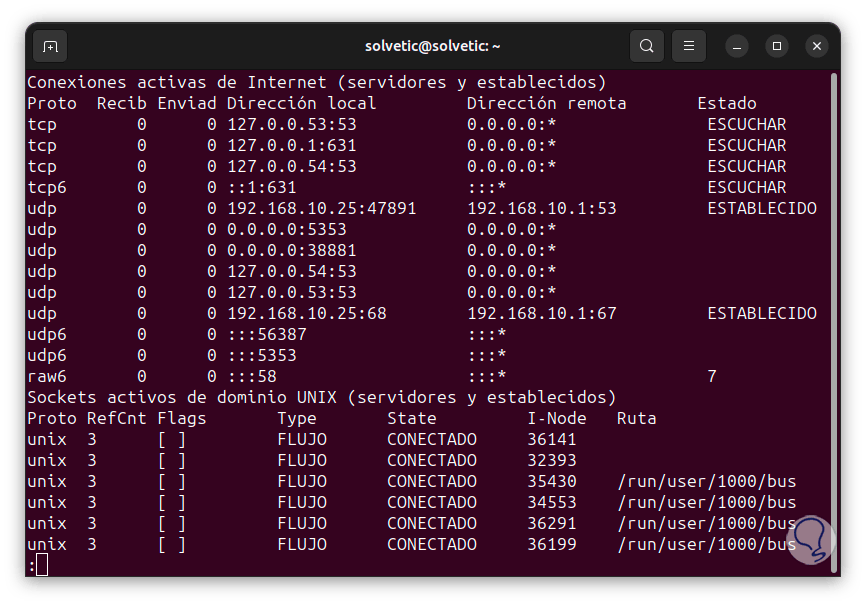
It is possible to see the local and remote addresses as IP addresses but not as domains and resolved host names. To achieve this we will use the following command:
sudo netstat -an | them
Step 11
Some of the most used ports are:
- 22: is the Secure Shell (SSH) listening port.
- 25: is the SMTP protocol listening port)
- 53: is the Domain Name System (DNS) listening port
- 68 – is the Dynamic Host Configuration Protocol (DHCP) listening port
- 631: is the listening port of the Common UNIX Printing System (CUPS)
Step 12
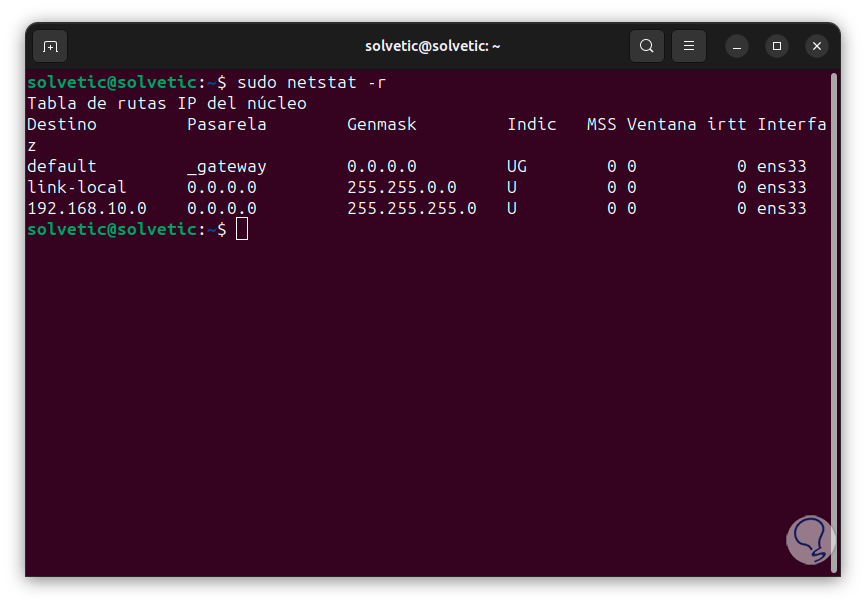
To view the Linux routing table, let's run the following:
sudo netstat -r
Step 13
There we find columns like:
- Destination: is the destination network or the destination host device
- Gateway: is the address of the gateway
- Genmask: is the subnet mask
- Indic: they are flags that allow us to better identify the socket, some values are U (the route is active), G (uses a Gateway), H (the target is a host), M (modified by the routing daemon) and more
- MSS: (Maximum Segment Size), it is the largest amount of data that can be received in a TCP segment in Linux
- Window – Indicates the default window size for TCP connections on the route
- Interface: is the interface used
Step 14
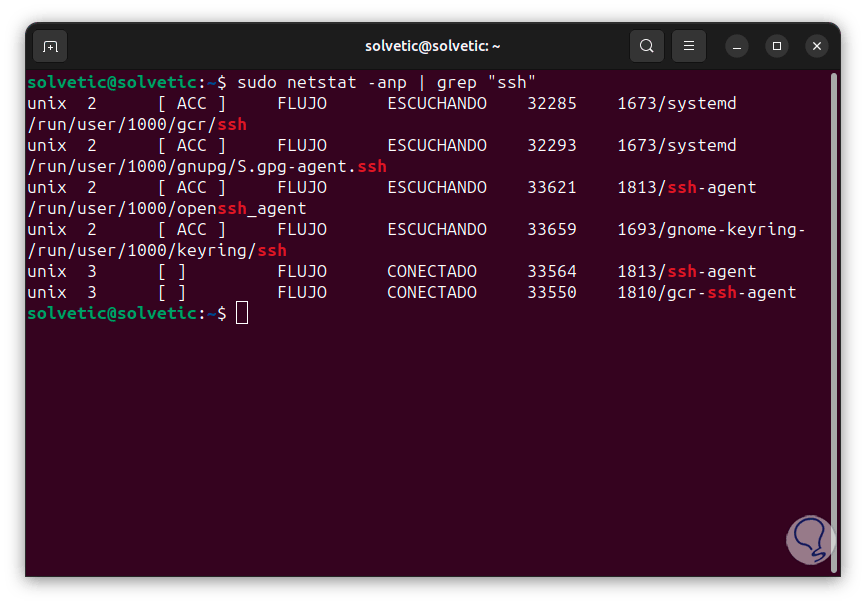
It is possible to search directly by the protocol name, in this case we will use the following syntax:
sudo netstat -anp | grep "protocol"
Step 15
We can also search by port number:
sudo netstat -anp | grep ":port"
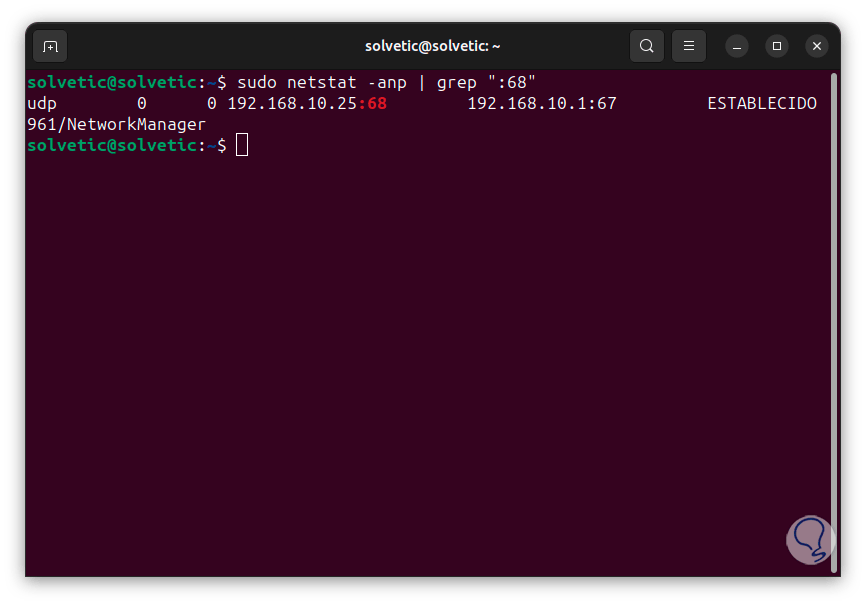
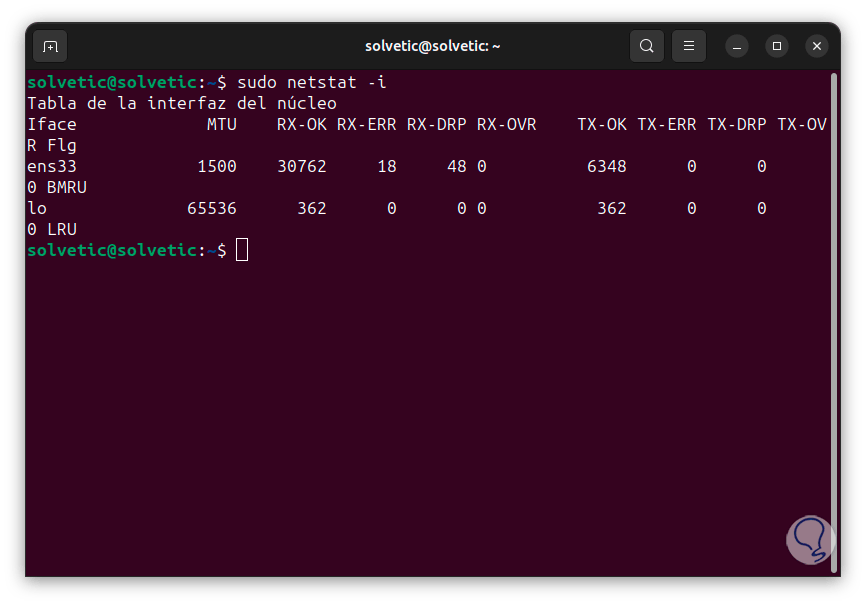
Step 16
To list the interfaces we execute the following:
sudo netstat -i
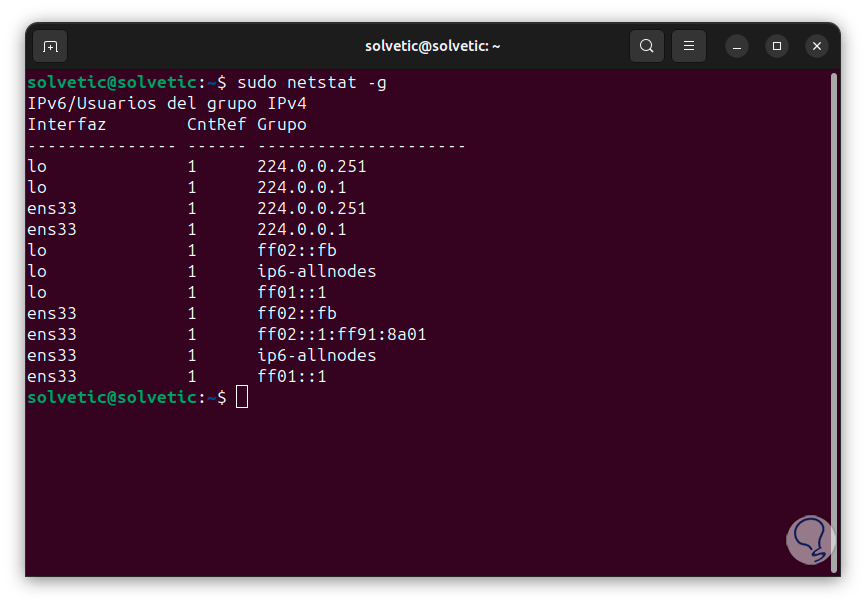
Step 17
Finally, we can see the members of the multicast broadcast with the command:
sudo netstat -g
These are some of the ways in which nestat is a great ally for managing various tasks in Linux..