To stay up to date, remember to subscribe to our YouTube channel!
SUBSCRIBE ON YOUTUBE
Working with a network in Linux can be a simple or complex task depending on the use of commands and utilities that you have to see relevant aspects of it, the network works with hundreds of aspects both physically and logically and because of this Linux offers us the netstat command to help us in network administration. Netstat (Network status) is a command developed to display different network statistics in real time, focusing on aspects such as network protocol statistics, active network connections, open ports, routing tables and more..
Tasks
Some of its tasks at a general level are:
- View IPv4 statistics (on IP, ICMP, TCP, and UDP protocols).
- View Ethernet statistics.
- Access IPv6 statistics (in IPv6, ICMPv6, TCP over IPv6 protocols).
- View active TCP connections.
Syntax
The usage syntax is as follows:
netstat [-a] [-b] [-e] [-n] [-o] [-p <Protocol>] [-r] [-s] [<interval>]
Options
The options or parameters available to netstat are:
- -a: It will show all the TCP connections that are active and also the TCP and UDP ports listening on the computer.
- -b: allows us to see the executable that enables the connection or listening port.
- -e – Displays Ethernet statistics with details such as number of bytes and packets sent and received.
- -n: display active TCP connections.
- -o: shows us the active TCP connections by adding the process ID (PID) of each connection.
- -p <Protocol>: allows you to see the connections for the protocol that we indicate, there we can use protocols such as tcp, udp, icmp, ip, tcpv6, udpv6, icmpv6 or ipv6.
- -s: shows the statistics by protocol, by default the statistics displayed will be for the TCP, UDP, ICMP and IP protocols.
- -r: allows us to see the contents of the Linux IP routing table.
- <interval> – Create a new view of the details at the specified interval of seconds.
- -c : prints the routing information from the cache.
- -i, --interfaces: Display the interface table.
- -g, --groups: shows us the membership of multicast groups.
- -M, --masquerade: display masquerade connections.
- -v, --verbose: indicates a more complete description of the command.
- --numeric-hosts: Do not resolve hostnames.
- --numeric-ports: Do not resolve by port names.
- --numeric-users: Do not resolve to usernames.
TechnoWikis will now explain how to use this command in Linux to have a better perspective of network aspects.
How to use netstat on Linux
Step 1
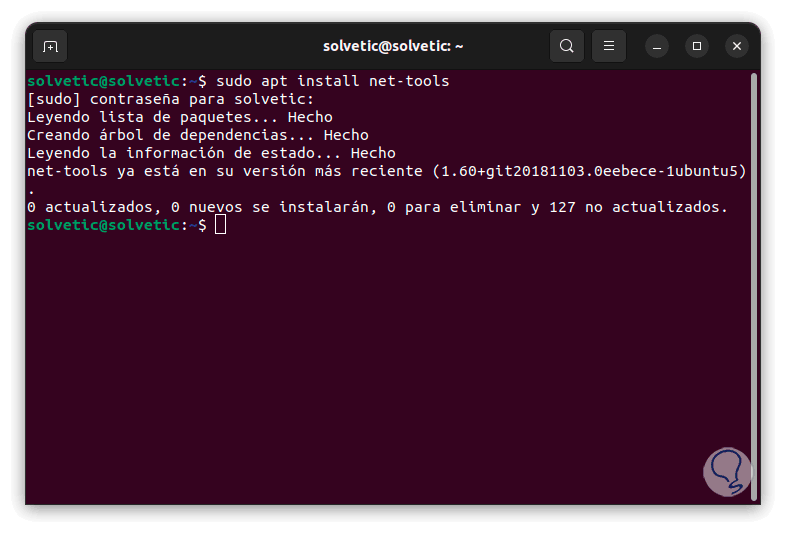
We open the terminal, first of all we are going to execute the following command to install the utility (if we do not already have it):
sudo apt install net-tools
Step 2
We must enter the password.
Step 3
This command applies to Debian and Ubuntu, for other distributions execute:
sudo yum install net-tools (RHEL/CentOS/Fedora) sudo emerge -a sys-apps/net-tools (Gentoo) sudo zypper install net-tools (OpenSUSE)
Step 4
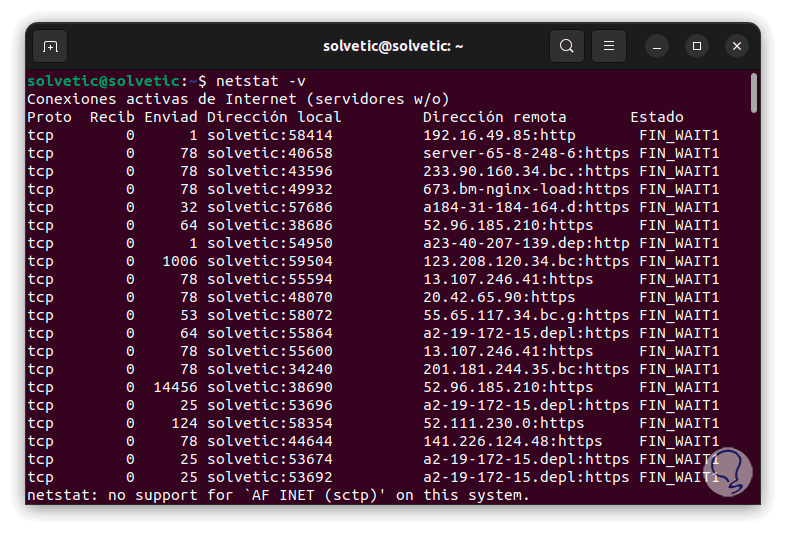
Now we are going to use the following command to have detailed information:
netstat -v
step 5
The columns handle an identifier, these are:
- Proto: is the name of the protocol (TCP or UDP)
- Local address: it is the IP address of the local computer and the port number that is in use, in case the port has not been set, the port number will be seen as an asterisk (*)
- Remote address: is the IP address and port number of the remote computer where the socket is connected
- Status: is the status of the TCP protocol; these options are CLOSE_WAIT, CLOSED, ESTABLISHED, FIN_WAIT_1, FIN_WAIT_2, LAST_ACK, LISTEN, SYN_RECEIVED, SYN_SEND, TIMED_WAIT, UNKNOW
step 6
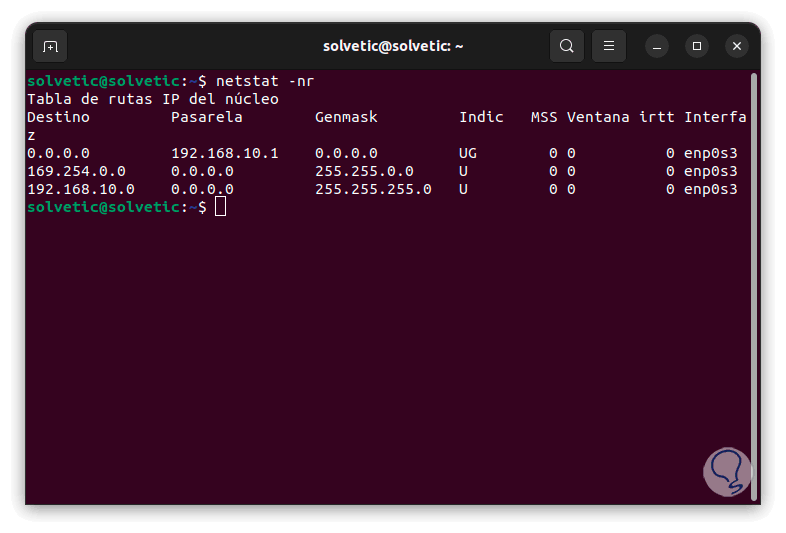
If we want to see the routing table we will execute the following command:
netstat -nr
step 7
In this case we find the following values:
- Destination: Indicates the destination of the network (IP address or CIDR notation).
- Gateway: It is the IP address of the gateway for the destination network, if we can directly access the destination in the local network, the gateway will be shown as address 0.0.0.0.
- Genmask: is the network mask where the network portion of the destination is specified.
- Indic: are the routing indicators where we can see additional information about the route, 'U' indicates that the route is active and 'G' indicates that the route is to a gateway directly.
- MSS: is the maximum segment size for TCP connections in the route.
- Window – Indicates the maximum window size for TCP connections on this route.
- irtt: is the initial RTT (Round Trip Time) value for assigned TCP connections.
- Interface: is the network interface associated with the route.
step 8
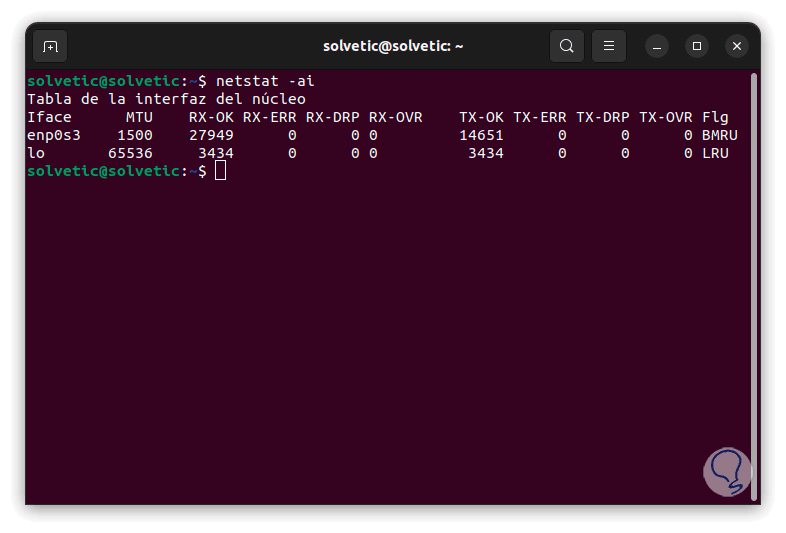
With the following command we can see the statistics of the network adapter:
netstat -ai
step 9
There we find values like:
Options
- Iface: is the name of the network interface
- MTU: is the maximum transmission unit, it refers to the maximum size of a data packet to be transmitted through the interface
- RX-OK: is the number of packets received without errors
- RX-ERR: is the number of packets received with errors
- RX-DRP: indicates the number of received packets that have been discarded
- RX-OVR: is the number of received packets that were overflowed (lost data)
- TX-OK: is the number of successfully transmitted packets
- TX-ERR: shows us the number of packets that could not be transmitted due to errors
- TX-DRP: is the number of discarded transmitted packets.
- TX-OVR: is the number of transmitted packets that were overflowed
- Flg: they are flags associated to the interface, their values are 'B' for transmission, 'M' for multicast, 'R' for execution, 'U' for up, 'L' for loopback
step 10
If we need to see the RAW, UDP, TCP, or UNIX connections we are going to execute the following:
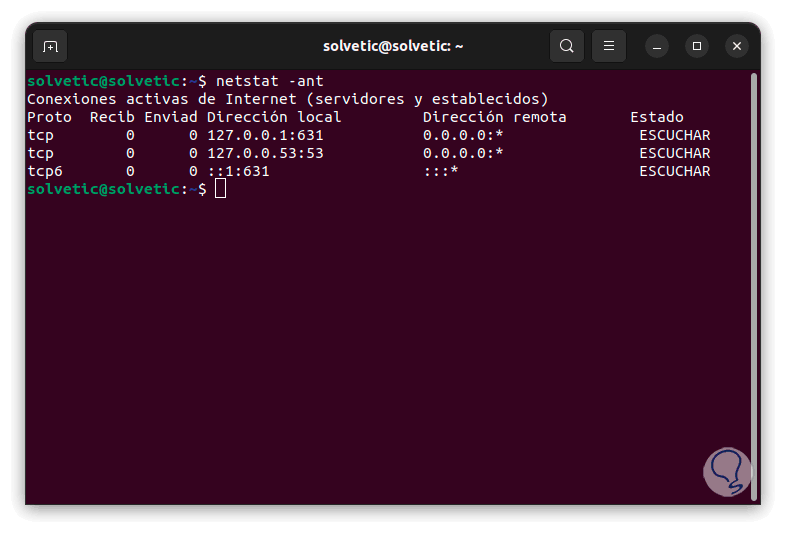
netstat -ant
step 11
There we see the protocol used, the number of packets sent and received, the source and destination addresses, and the status of the protocol.
step 12
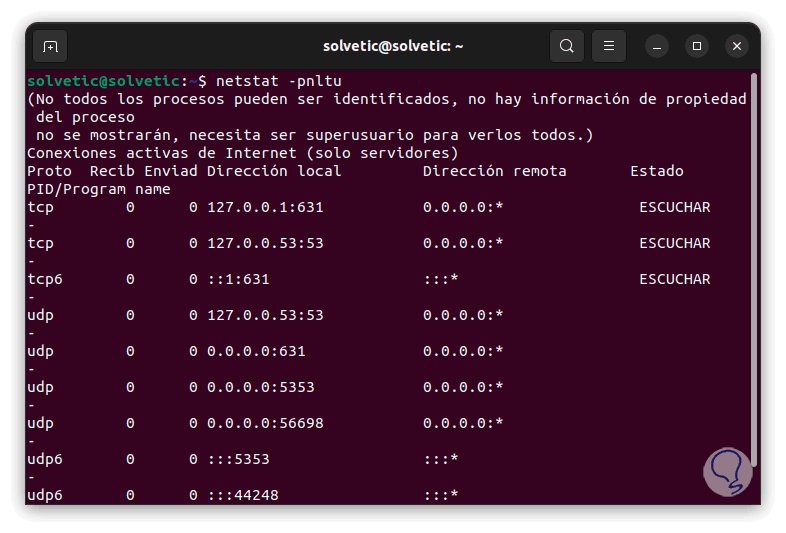
If the objective is to see the services used, we will execute the following command. We see the same details by adding the PID.
netstat -pnltu
With netstat we will be able to carry out a complete administration of the network and know how its status is to take action or not..