Without a doubt one of the most important, or perhaps the most important, hardware elements is the processor or CPU . This is because this part of our equipment fulfills important tasks such as redirecting all system tasks, services, processes and orders to be executed on the equipment..
Its evolution is undoubtedly surprising, since today the processors have taken giant steps in terms of technology, versatility, speed, frequency range and many more functions that make our equipment something like PC-shaped rockets and work optimally.
If we are not very expert in the whole process of processors , we can be deceived in a simple way when acquiring a team, so it is very important to learn about this topic and know and have tools that allow us to know fully and completely Everything that happens with our processor. In this case we will focus on a prestigious and recognized brand of processors: Intel . This is one of the most recognized processor developers and has relatively recently created a utility called Intel® Processor Diagnostic Tool, which analyzes in detail and in depth how the processor behaves in our system..
Knowing, knowing what it is for and how to use this tool is essential to understand and know how the operation of our processor of this brand is developing and that is why today TechnoWikis will explain how to download and use it correctly step by step in this tutorial
What is the Intel Processor Diagnostic utility?
This free Intel tool aims to verify the functionality of an Intel microprocessor in a detailed way to know in concerted each action within the equipment, when using this diagnostic tool the identification of the brand is verified in order to verify its originality, verify processor frequency, detail specific characteristics of the processor and perform a stress test on the processor to check its response level.
Currently, version 4.1.0.27 of the Intel® Processor Diagnostic Tool is available, which is compatible with multiprocessor systems.
This tool can be installed on the following operating systems
Some of the processors compatible with the tests and analysis of the tool are
- 64-bit Intel Xeon Processor 2.80 GHz, 1M Cache, 800 MHz FSB
- 64-bit Intel Xeon Processor 2.80 GHz, 2M Cache, 800 MHz FSB
- 64-bit Intel Xeon Processor 2.80D GHz, 1M Cache, 800 MHz FSB
- 64-bit Intel Xeon Processor 2.80E GHz, 2M Cache, 800 MHz FSB
- 64-bit Intel Xeon Processor 2.83 GHz, 4M Cache, 667 MHz FSB
- 64-bit Intel Xeon Processor 3.00 GHz, 1M Cache, 667 MHz FSB
- 64-bit Intel Xeon Processor 3.00 GHz, 1M Cache, 800 MHz FSB
- Intel Atom Processor 230 (512K Cache, 1.60 GHz, 533 MHz FSB)
- Intel Atom Processor 330 (1M Cache, 1.60 GHz, 533 MHz FSB)
- Intel Atom Processor D2500 (1M Cache, 1.86 GHz)
- Intel Atom Processor D2550 (1M Cache, 1.86 GHz)
- Intel Atom Processor D2560 (1M Cache, 2.00 GHz)
- Intel Atom Processor D2700 (1M Cache, 2.13 GHz)
- Intel Core i3-2130 Processor (3M Cache, 3.40 GHz)
- Intel Core i3-2310E Processor (3M Cache, 2.10 GHz)
- Intel Core i3-2310M Processor (3M Cache, 2.10 GHz)
- Intel Core i3-2312M Processor (3M Cache, 2.10 GHz)
- Intel Core i3-2328M Processor (3M Cache, 2.20 GHz)
- Intel Core i5-2320 Processor (6M Cache, up to 3.30 GHz)
- Intel Core i5-2380P Processor (6M Cache, up to 3.40 GHz)
- Intel Core i5-2390T Processor (3M Cache, up to 3.50 GHz)
- Intel Core i5-2400 Processor (6M Cache, up to 3.40 GHz)
- Intel Core i5-2400S Processor (6M Cache, up to 3.30 GHz)
- Intel Core i5-2405S Processor (6M Cache, up to 3.30 GHz) and many more.
[/color] [color = rgb (51,51,51)] For the correct use of the tool the following is required: [/ color]
Windows Installer 3.1 Redistributable (v2)
Microsoft .NET Framework Version 4.5 Redistributable Package (x86_x64)
Microsoft Visual C ++ 2010 SP1 (x86) Runtime Libraries
Microsoft Visual C ++ 2015 (x86) Runtime Libraries
Step 1
To download this tool for free we must go to the following link:
Intel Processor Diagnostic
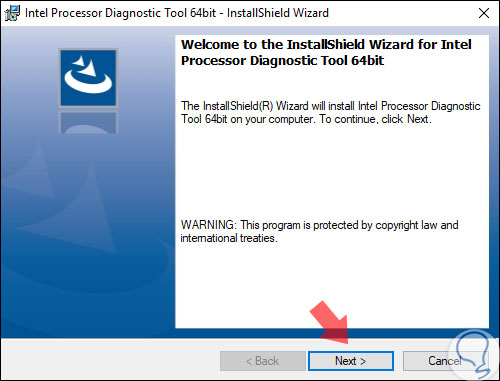
Once downloaded, (available for 32 and 64 bits), click on the executable and the following will be displayed, click on "Next"
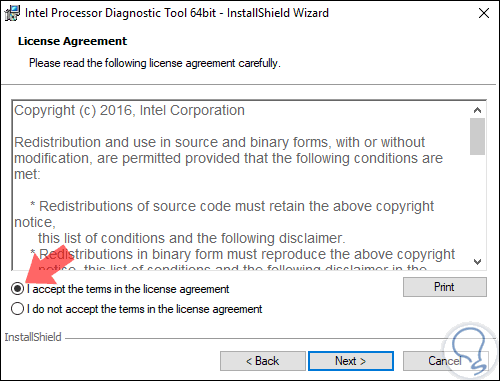
We accept the terms of the license, once accepted, click on "Next" again
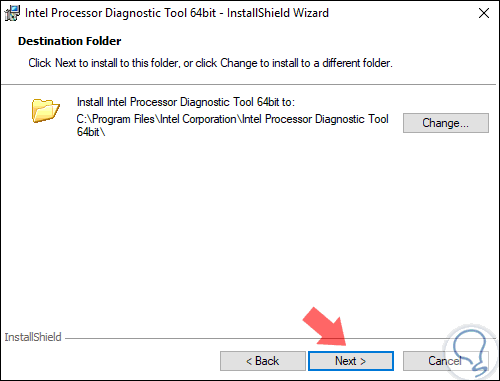
Step 2
Now we define the path where the tool will be installed. Click on "Next"
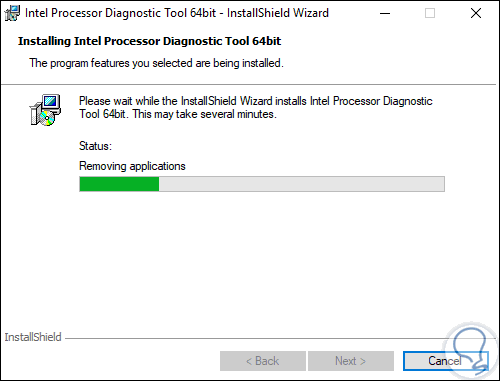
Step 3
This will start the installation process:
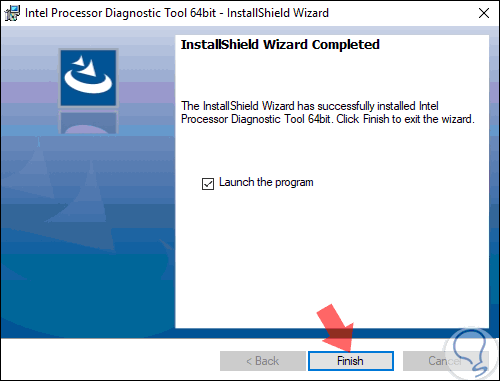
Step 4
Once finished we will see the following message. We can run the application from there:
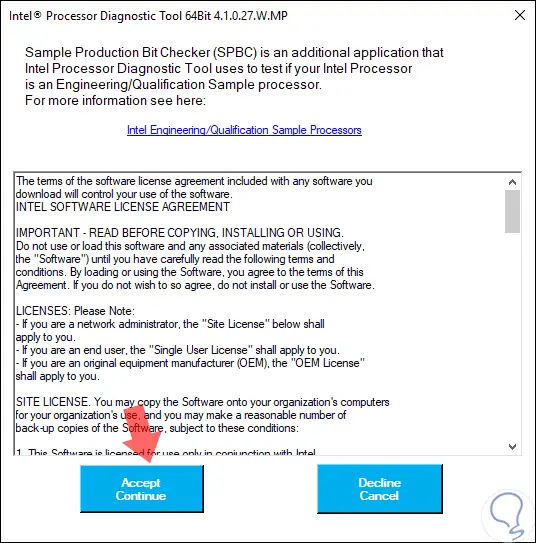
Step 5
Once we access the following will be displayed. Click on the "Accept Continue" button
Step 6
First, it will start with a stress or stress test directly to the Intel processor:
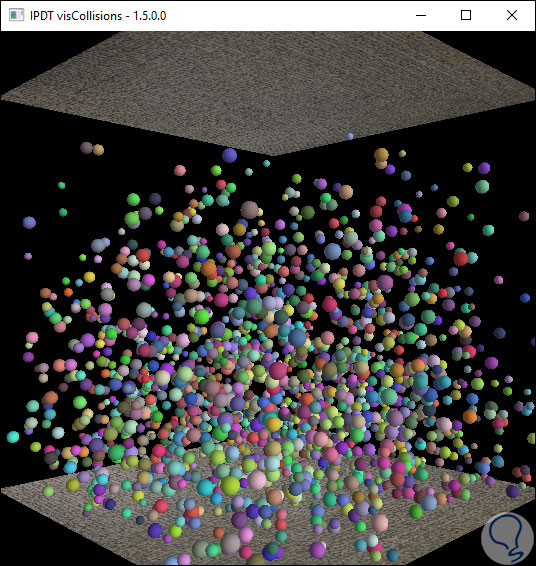
Step 7
During this test we will see the process carried out graphically in pop-up windows:
Step 8
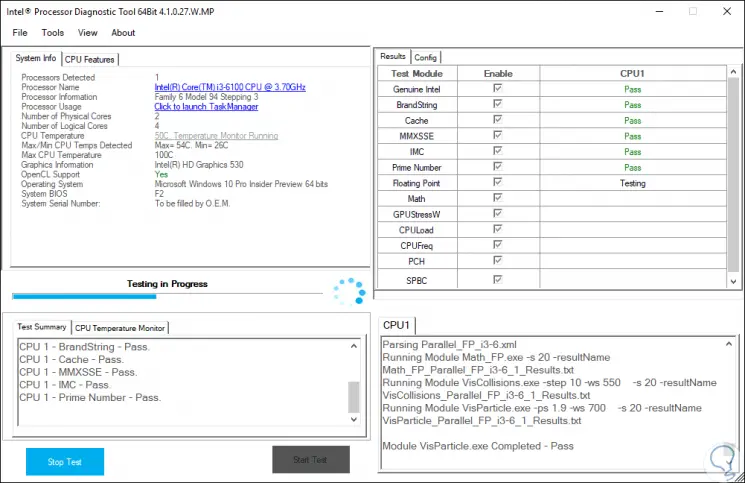
Once the test is finished we will see the following:
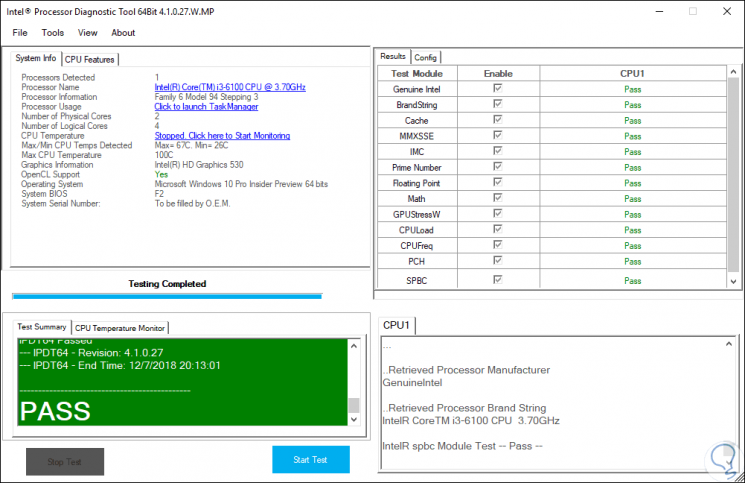
First, we have the System Info tab where we access details such as
- Number of active processors
- Name and model of the processor
- Number of physical and logical cores
In the lower part we check the test result which if passed will say "Pass", otherwise it will say "Failed".
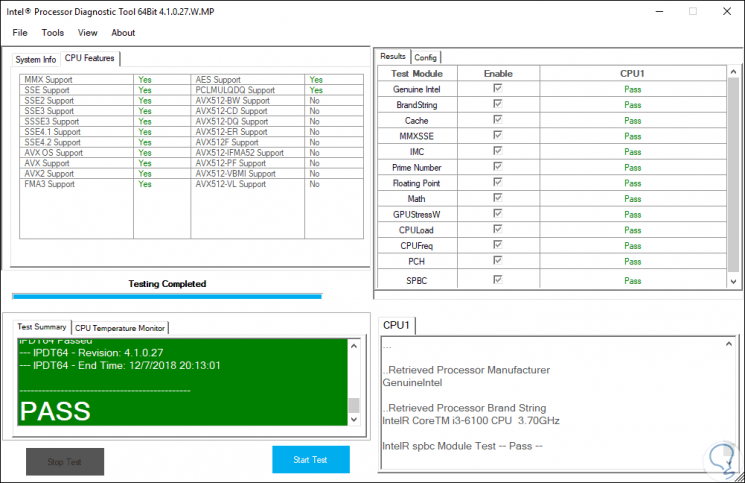
Now, from the CPU Features tab, we will have a complete summary about the functions supported by the analyzed processor:
Step 9
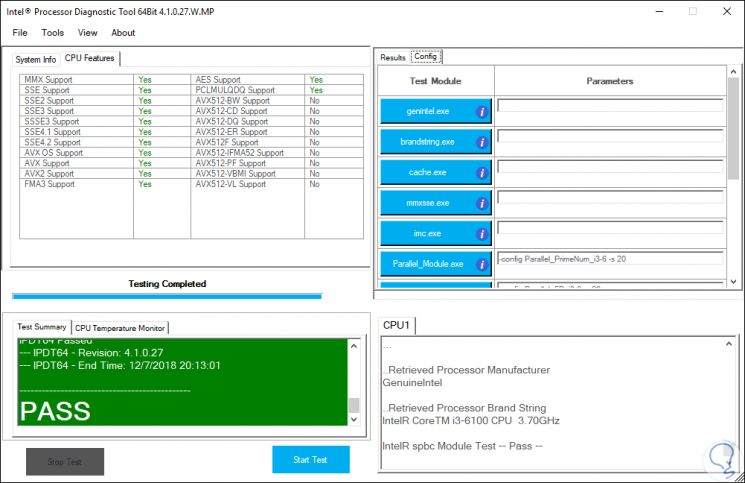
On the right side of the application we have two tabs that are:
Results
Where all the results are displayed, by category, which have been generated after the initial processor test.
Config
There it will be possible to know the purpose of each test performed
We can click on each of them to access more complete information at the bottom..
Step 10
When using the Intel diagnostic tool, the temperature monitor is run in parallel to the tests mentioned in order to verify whether the processor overheats or not during the process.
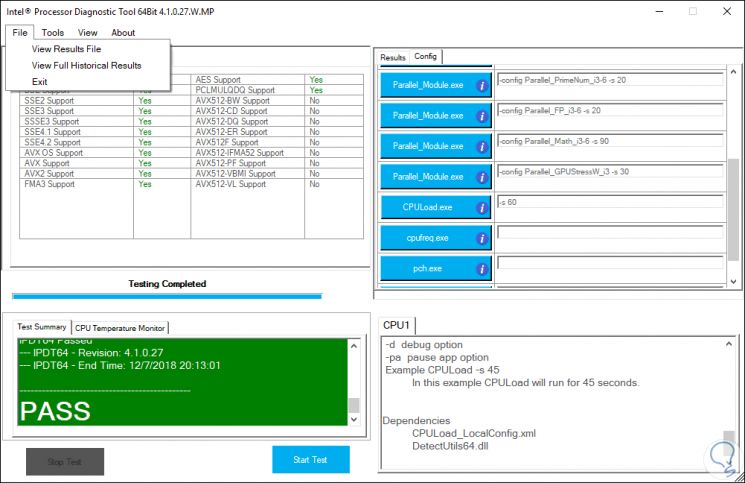
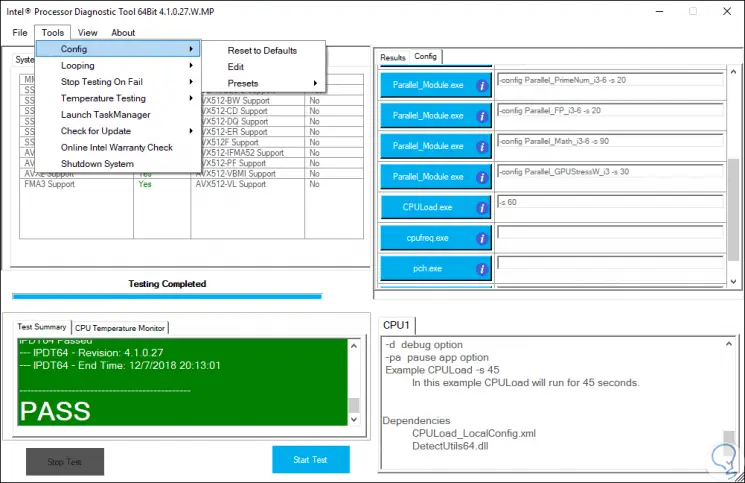
At the top we have some menu options such as:
File
From there we can exit the application or access the historical results of the tests performed
Tools
As the name implies, it is a set of tools where it will be possible to activate or not certain values, validate new updates, run the task manager, shut down the system and some other options
View
From there it will be possible to access a compact or complete view of the application

About
There we can access the help or verify the used version of the tool.

It's that simple, thanks to this Intel utility, we will have a complete summary and report on everything our CPU does and can always do with optimal performance.