When we surf the web, we like to have a good browser since this will influence our experience to be more enjoyable and our searches more productive..
Google Chrome is one of the most used website browsers today for its performance, versatility and compatibility with most desktop and mobile operating systems today, but perhaps one of the most striking for thousands of users, Especially developers, it is the option that Google Chrome offers to access its content and edit advanced settings and parameters that for many users can go unnoticed.
This is achieved by accessing the chrome: // line and adding various values ​​to access these functions. Today in TechnoWikis we will talk a little more about how to access and edit hidden values ​​of Google Chrome through this option..
1. How to view about Google Chrome
One of the first most useful options for its result and redirection is the about option, which is enough to execute the following in a new Google Chrome window:
chrome: // about
The result will be as follows:
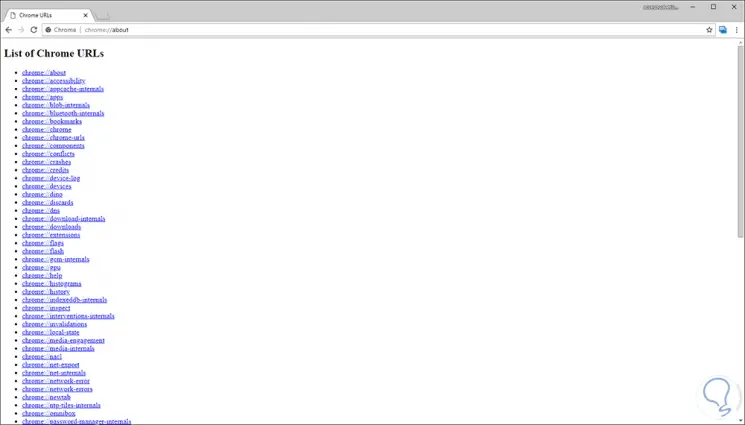
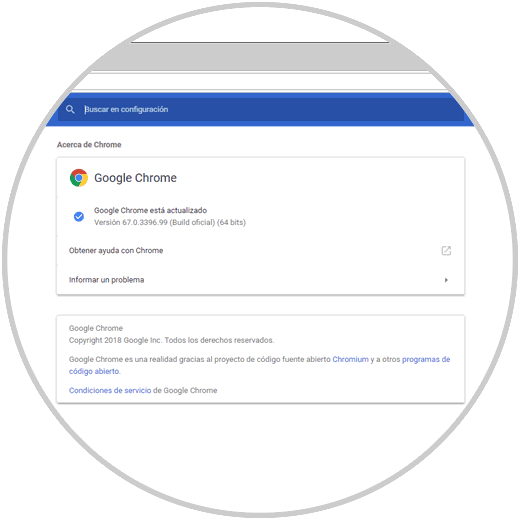
As we can see, from here there is a central point where it will be possible not only to see all the Chrome options: // but to automatically access them with a click, for example, if we click on chrome: // help we will be directed to the browser help section:
2. How to view experimental features of Google Chrome
One of the most practical options, speaking at the development level, is the chrome option: // flags / which gives us the possibility of accessing all the features that are in beta or testing by Google in order to improve the end user experience in the browser.
Thanks to this section Google allows us to test new Chrome features so that as users we can send comments to improve since they are often unstable features.
It is important to clarify that when accessing this option it will be possible to execute actions such as:
- Activate the native client
- List the software rendering
- GPU composition on all pages
- Enable accelerated GPU drawing
- Disable preprint and more
When we execute chrome: // flags / we will see that at the top of the screen we have a warning message..
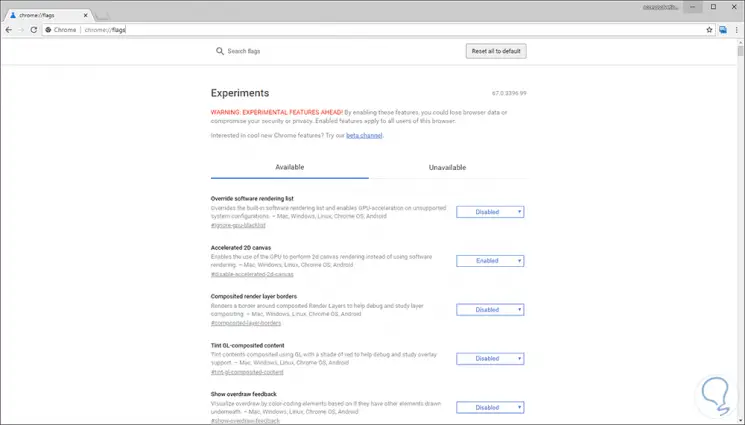
We have available and obsolete functions for review.
3. How to get information on the version of Google Chrome used
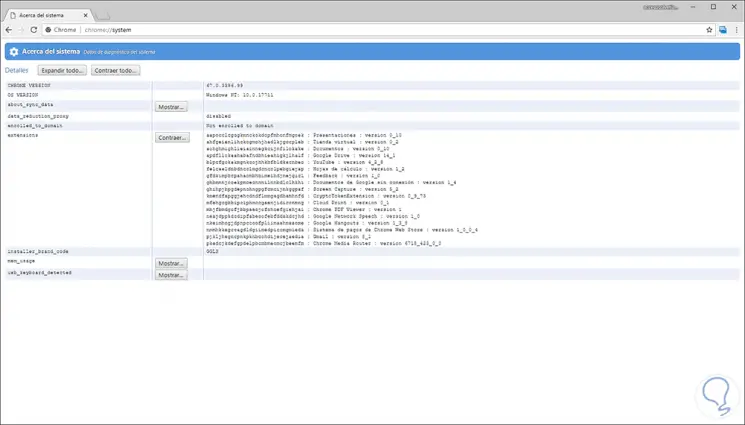
It is one of the most practical and useful aids for any system administrator since this feature displays complete information about browser aspects such as:
Current browser version
- Version of the operating system used
- Extensions installed and more
To obtain this result we execute the following:
chrome: // system /
The result we will see will be the following:
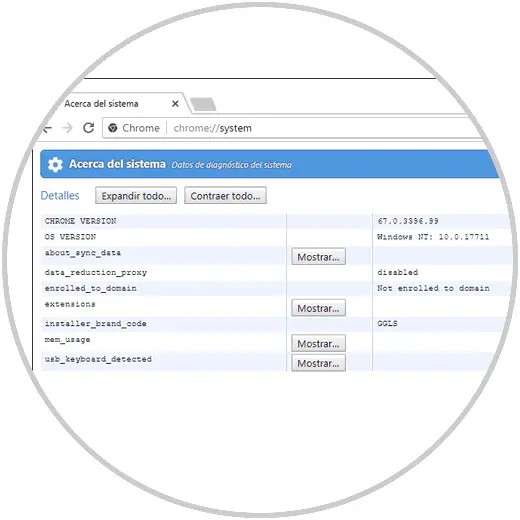
We can click on the Show button to obtain much more detailed information about the section to be analyzed:
4. How to run Google Chrome network diagnostics
For all network administrators, Google Chrome has an ideal option to monitor in real time all the events that happen at the network level in a simple but comprehensive way.
We achieve this thanks to the following option;
chrome: // net-internals /
At the time of its execution we will see the following:
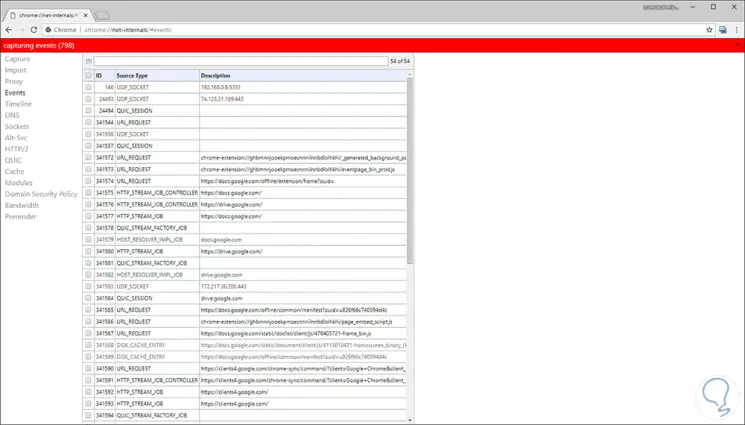
Thanks to this option, it will be possible to analyze network events in real time as these are captured immediately.
Thanks to this option it will be possible to capture and analyze events such as:
DNS
With this option we will see a record of the DNS requests of the current device
Proxy
Thanks to this option it will be possible to see information about the proxy settings that we use in the browser, in case we do not have any proxy, we will see the Use Direct connections option
Events
From this option it will be possible to see a list of the events that occur in Google Chrome such as socket connections, SPDY sessions, HTTP-TCP connections and more.
Sockets
With this alternative we can see a record of open and used sockets
Cache
It allows us to see a list of statistics and entries stored in the browser cache
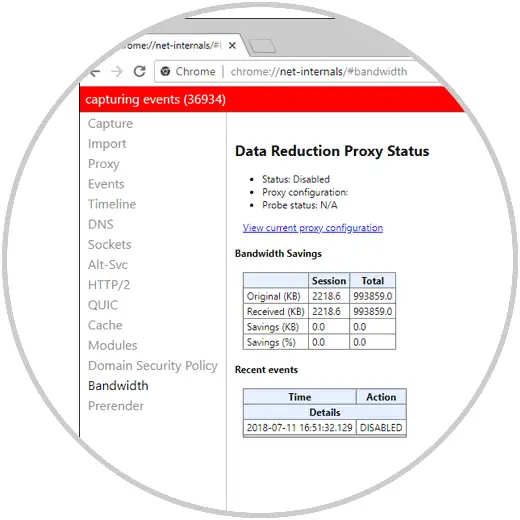
Bandwith
With this option it will be possible to see the total amount of data sent and received since the tab was opened.
To learn
By selecting this option we will have access to the active preprocessor websites and their history.
5. How to access Google Chrome development tool
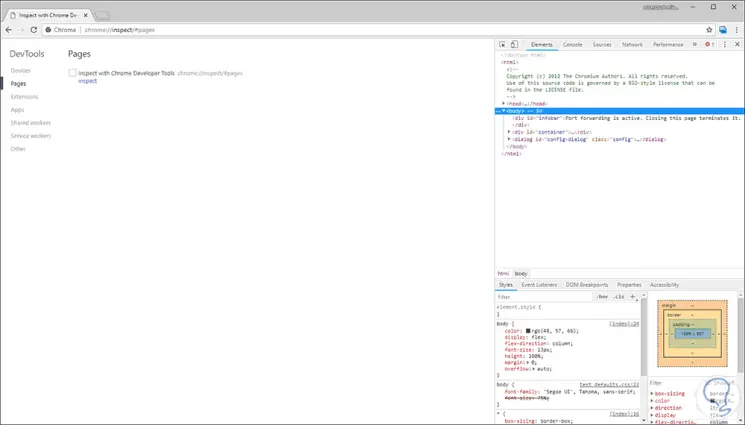
Google Chrome gives us the opportunity to access a series of developer tools to learn more about how Google Chrome manages background processes on aspects such as extensions, devices or applications.
To access this functionality we will use the following option:
chrome: // inspect
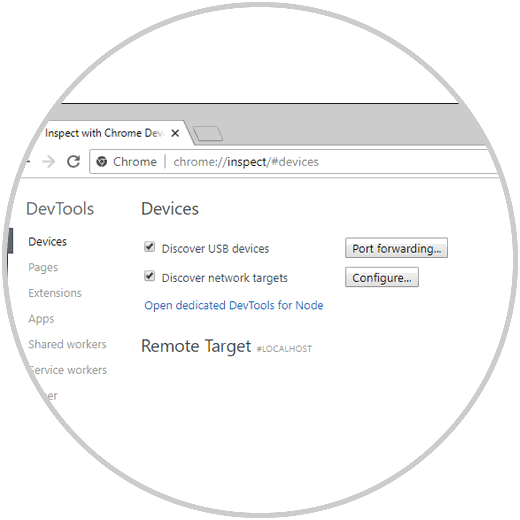
From there we can navigate to the different sections to learn a little more about these development options or DevTools:
6. How to check conflicts in the Google Chrome browser
Another of the useful options in Google Chrome is the possibility of detecting which modules present some type of conflict with the browser that may have a direct impact with the performance of this, to verify this we execute the following:
chrome: // conflicts /
In the displayed results we find details such as:
- Route where you are staying
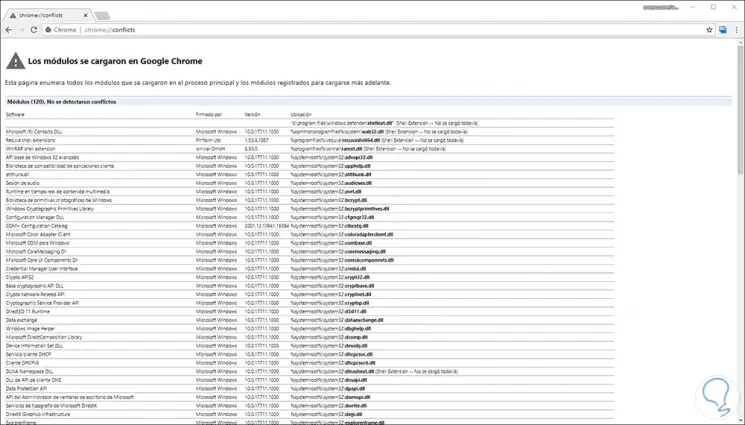
At the bottom we will see whether or not there are conflicts with Google Chrome.
7. How to monitor Google Chrome processes
The activity of tracking records in Google Chrome processes allows us as administrators to keep specific control over each step that occurs with each process and thus detect any type of error with complete metrics offered by the chrome: // tracing / option:
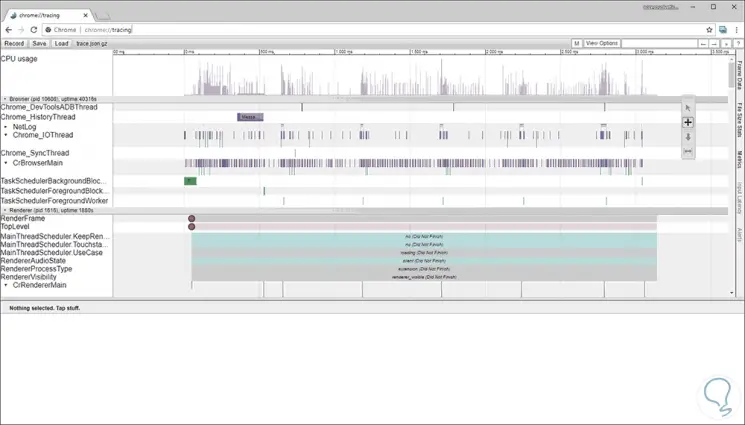
When we click on the Record button it will be possible to record parameters such as:
In this way Google Chrome allows us to have a more centralized control over the browser and this allows us to know that Chrome is much more than a simple bridge to go to websites.