Network administration is one of the essential keys in any organization (regardless of its size) since the network plays a crucial role in all kinds of internal and external processes such as:
- Sending and receiving mails
- Online connectivity and much more
Networks have a series of variables that together can become complex to manage, such as protocols, structures, devices or environments. There are hundreds of tools that have been created to help administrators control and manage networks, but today we will talk about a proprietary utility of Microsoft called Microsoft Network Monitor in version 3.4..
What is Microsoft Network Monitor
It is basically a utility developed as a protocol analyzer with which it is possible to carry out routine tasks such as:
- Capture, view and analyze data from the local or external network
- Solve problems with applications on the network or devices integrated in the architecture
Advantages
By using this free Microsoft utility we will have advantages such as:
- It integrates a script analyzer model with updates that are carried out with rapid frequency.
- We can use simultaneous sessions for the live capture of the transported packages.
- It has support for 32-bit and 64-bit platforms.
- Supports network analysis and process monitoring.
- Enhancements to the scanner configuration manager as it now allows simple switching between scanner settings using the button on the Analyzer Profiles toolbar.
- Add an API to have access to the packet capture and analysis engine.
- It integrates a column manager with which the column layout will be opened based on the type of file that is opened.
- Improvements in color rules for protocols.
- With this version we can define the bandwidth to use for data capture.
- New window layout dropdown menu.
- Compatible with 802.11n and Raw IP Frame protocols.
- Option to track processes in NMCap.
- New in the UTC timestamps since now all the information related to the worked time zone will be captured and saved.
- High performance filters.
Aspects to consider
There are some conditions that we must take into account when we use this application at the level of equipment components such as:
- Memory usage : the tool adds a conversations function which can significantly increase memory usage in the system, this is because the top-level protocol filters request access to the conversation properties.
- Hard Drive Space : When a capture session occurs, the Network Monitor utility will store frames using a sequence of capture files in the \ Temp folder. Each of these files is 20 MB by default. If we do not stop capturing, the tool will continue to create these files only until the available disk space is less than 2 percent, which is a critical storage point.
- CPU use : in the network conversation mode we can get to use a high percentage of the CPU, so TechnoWikis recommends that you take the necessary precautions.
The Microsoft Network Monitor 3.4 utility can be downloaded for free at the following link:
Microsoft Network Monitor 3.4
1. How to install and use Microsoft Network Monitor 3.4
Step 1
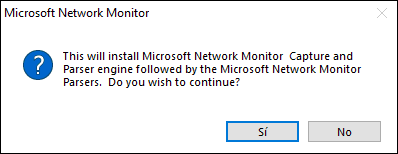
Once we download the utility we proceed to its execution and the following warning will be launched:
Step 2
We click "Yes" to confirm the installation process:
Step 3
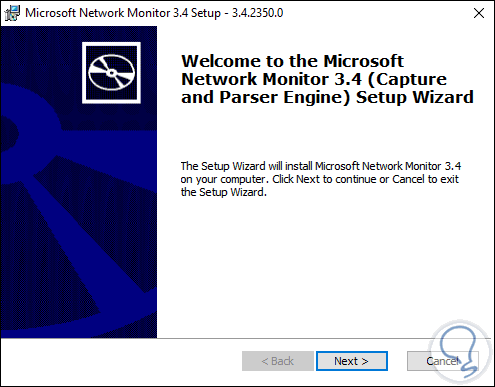
We click Next and follow the steps of the wizard:
Step 4
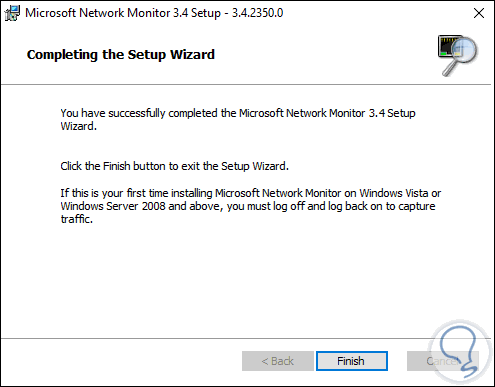
We click on “Finish†and the installer of the network conversation functions will be launched:
Step 5
Once the process ends we can access the utility where we will see the following:
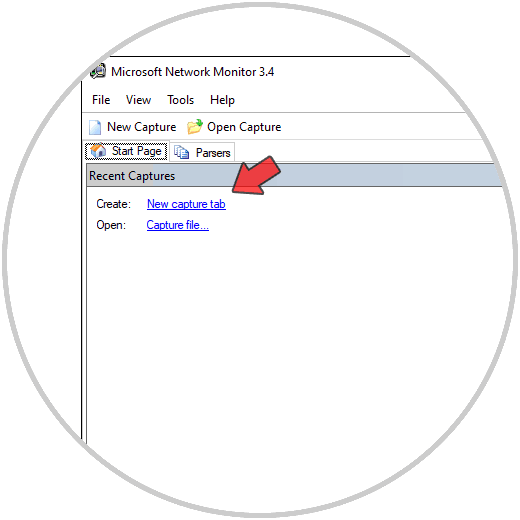
Step 6
To start our process we will click on the line "New capture tab" or directly click on the button "New capture" where we will see the following:
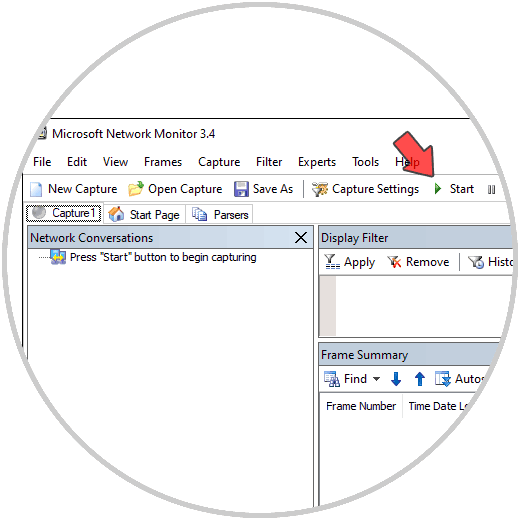
Step 7
To give way to the capture and monitoring process we click on the "Start" button and we may see the following error:
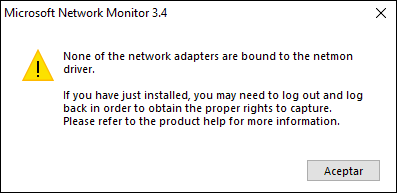
Step 8
In this case we must run the application as administrators and this time pressing "Start" will start the process:
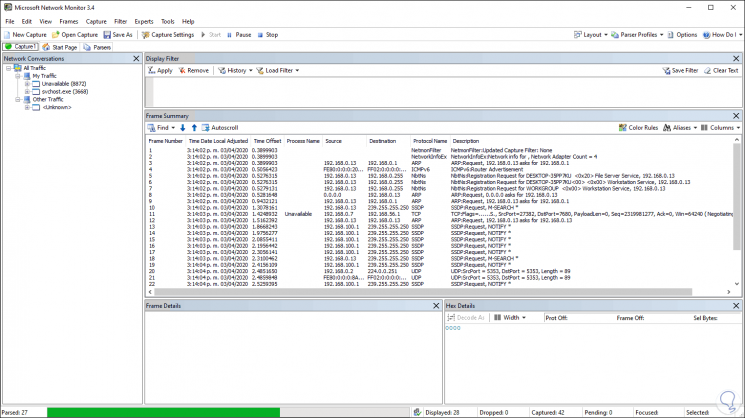
Step 9
We can see on the left side the "Network Conversations" which are the various apps that have associated network use. For example, we can click on Skype to view all the network aspects that it is managing at the moment:
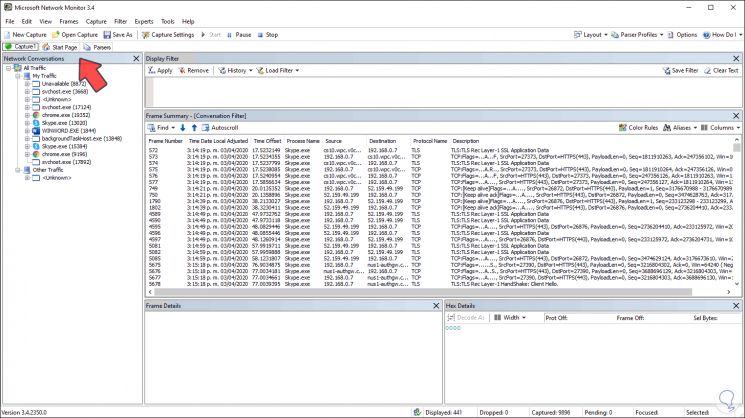
Step 10
Now, in the central console we have various columns, some of them are:
- Frame Number: is the ID of the detected object
- Time Date Local Adjusted: is the date and time when the detection was made
- Process Name: indicates the real name of the selected process
- Source: is the resource where the process is hosted
- Destination: destination IP
- Protocol Name: is the protocol currently used
- Description: references the entire route implemented by said process
2. How to use filters in Microsoft Network Monitor
For a simpler administration we can apply specific filters by protocols and thus focus on something special.
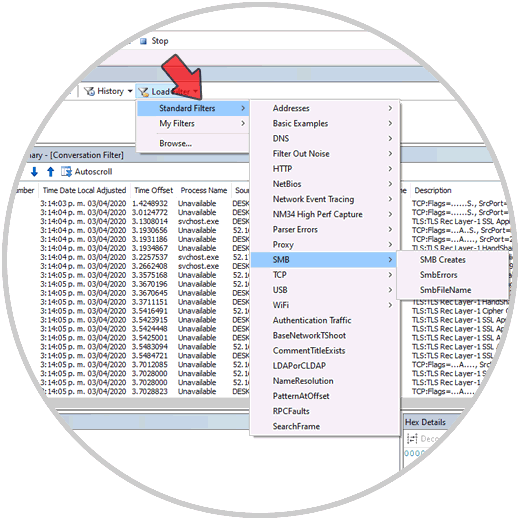
Step 1
For this we click on the "Load Filter" button and then we can choose the desired option from "Standard Filters":
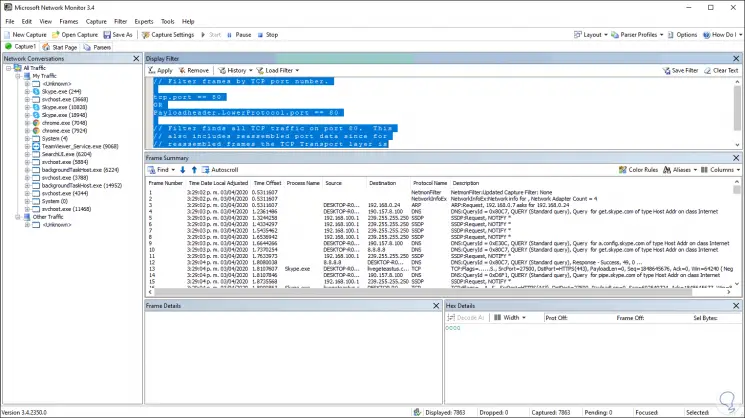
Step 2
Once we define the filters we can see that the sequence of them is created in the upper column:
After this we click on “Apply†to see the results of said filter:
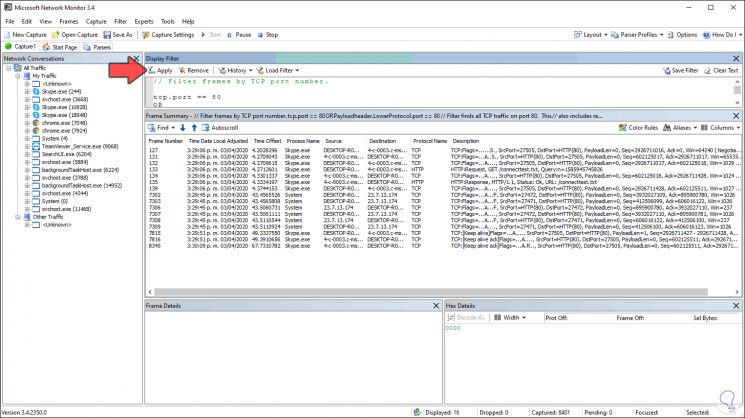
Note
To remove the filter we click on the “Remove†button.
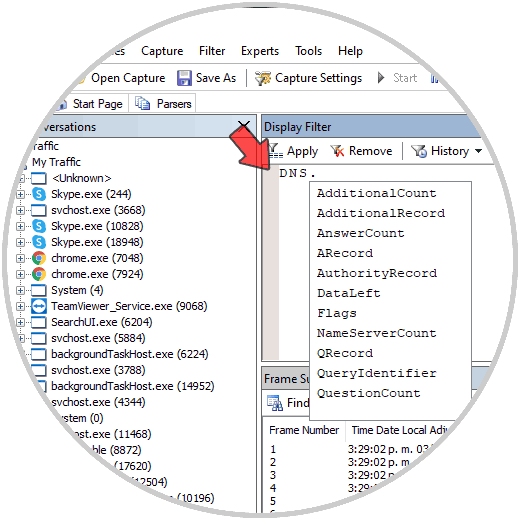
Step 4
Alternately we can create our custom filters. For this we go to the column where the filters are entered (upper column) and there we enter the name of the protocol followed by a dot (.) And automatically the filtering suggestions will be launched:
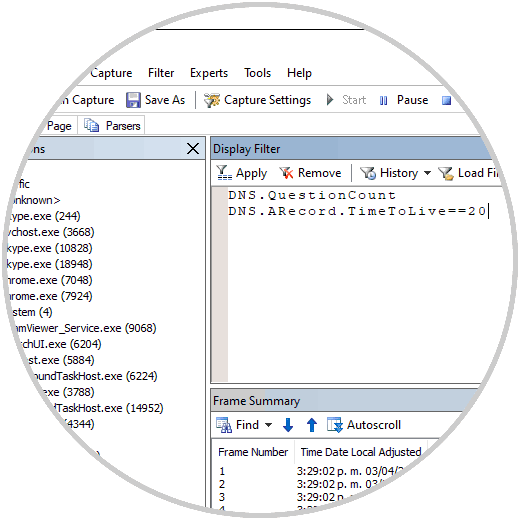
Step 5
There we can add the desired filters, for example:
DNS.QuestionCount AND DNS.ARecord.TimeToLive == 20
3. Microsoft Network Monitor usage parameters
For this case we have some options that allow us to obtain a much more complete visualization of the collected information.
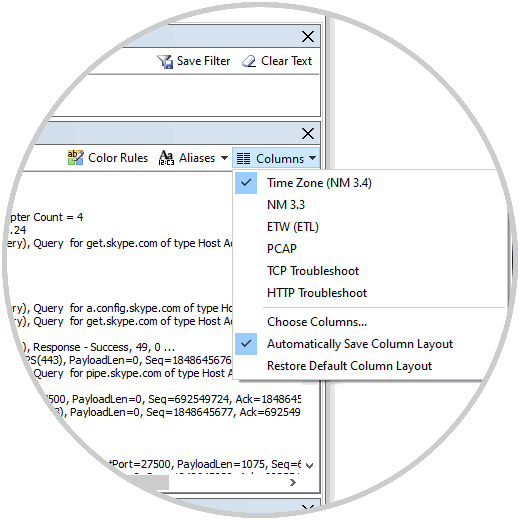
Step 1
For example, from "Columns" we can select which data columns will be displayed:
Step 2
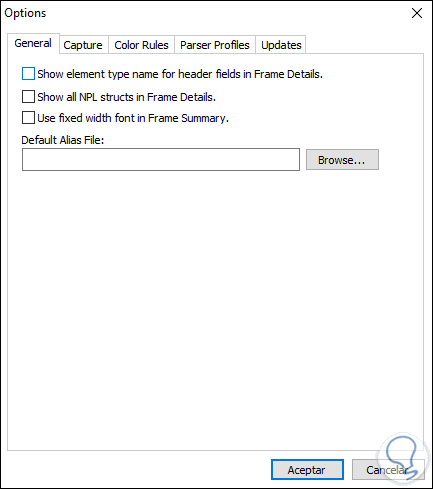
From the "Tools - Options" menu we access a series of variables such as:
In the "General" tab we can activate options such as the display of headings, NPL structure or frame summary:
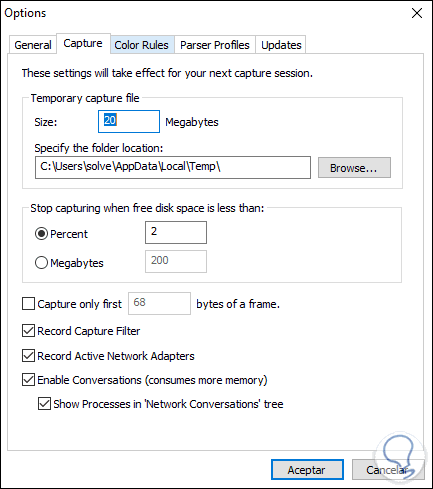
Step 3
From the “Capture†tab it will be possible to define the temporary size of each capture, define the temporary folder, specify in what percentage of disk the capture should stop, record the filter capture and more:
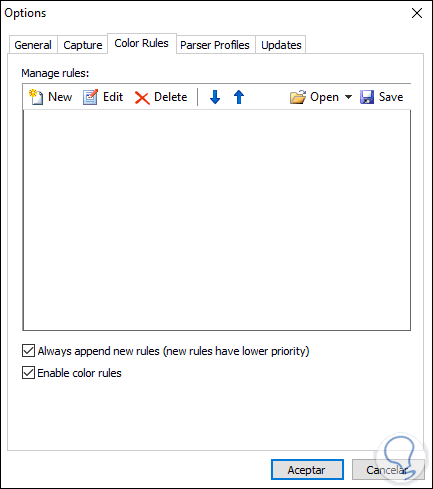
Step 4
In the tab #Color Rules â€we have the opportunity to specify color rules for the protocols:
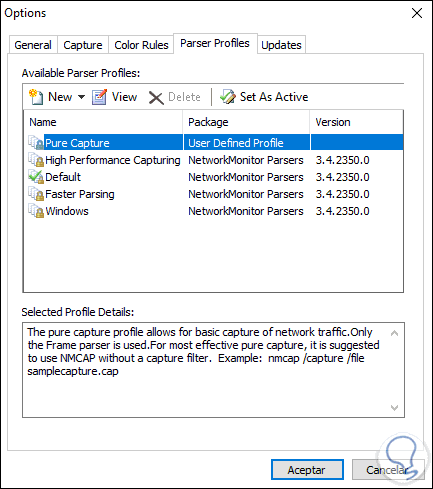
Step 5
In the "Parser Profiles" tab we find the current versions of use and it is possible to add more if we want:
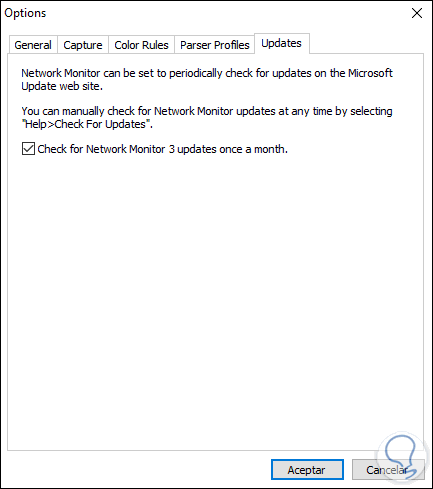
Step 6
In the "Updates" tab we can find updates for the network monitor:
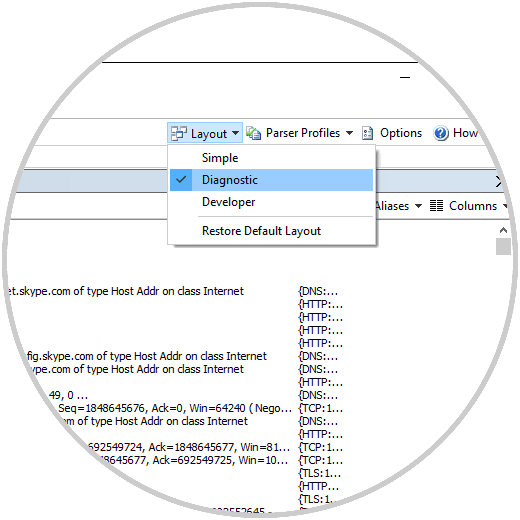
Step 7
Network Monitor offers us some visualization options based on the use we give it, we have the simple option, developer or diagnostic:
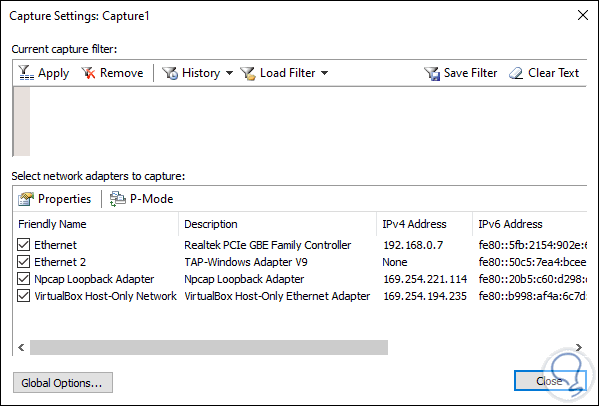
Step 8
From the "Capture Settings" button we can specify which network cards will be linked to the analysis:
With this we have a simple tool, but with which to perform the network analysis will be something simple, but totally comprehensive and functional.