Excel sheets have an important role in Power Bi projects. As a calculation tool, Excel is the most used program to build tables, databases, and reports. It is the most common application in the professional field to be able to make reports with tables and graphs, based on the information that we are saving in the Excel sheets of a file..
Most importantly, Power Bi is also a Microsoft tool, just like Excel, within the Office ecosystem and suite. And therefore, what can be expected is that the connection between Excel and Power Bi is complete. Like two people who speak the same language.
Power Bi and Excel are definitely complementary tools. Excel is an excellent tool, complete and powerful from the calculation point of view, from where we can make tables, calculations, formulations, graphs and dynamic tables. It is also as an analysis tool, being able to make tables and graphs that facilitate the interpretation and reading of the data.
At a professional level, and with analysis and reports in the spotlight, Microsoft launched a business intelligence tool on the market such as Power Bi: a tool that feeds on applications from the Microsoft professional solutions ecosystem, such as Excel, or Azure , to name a few, but also has the ability to understand and connect with other tools that are not in the Microsoft portfolio, and have APIs and cloud services..
Power Bi was designed as a tool for data analysis, to transform it, and to be able to build reports and visual dashboards that help in data representation and interpretation tasks.
Power Bi and Excel: two tools with similar but complementary functions
Power Bi and Excel are two Microsoft tools with some common denominator. They share in their portfolio of capabilities, some common functions such as the ability to host data, editing, building reports and Dashboards, data segmentation, or the ability to create graphs and dynamic tables.
Excel's own pivot tables offer automation, precision and some features such as visual reporting, using data slicers, or using various data sources; Features and possibilities also present in Power Bi capabilities.
So how are Power Bi and Excel different, how do they become complementary tools? To answer this question, below we explain what the main focus and mission of each tool is, and why they should be considered complementary and not rival tools..
Excel and Power Bi, same vision, but different mission
Excel is positioned and focused as a spreadsheet to be able to house data and perform calculation operations with formulas and cell linking. It is used to create data tables with operations to calculate ratios, edit information, organize and structure data.
Power Bi, however, focuses as a professional analysis tool, on data modeling, and on the creation of visual, practical and interactive reports, on the automation of these tasks, as well as on sharing tasks by creating spaces or areas of work, how we explain in types of Power Bi licenses, where several users can consult, interact and collaborate with the reports made by other users.
It is at this point where the area of action of each tool becomes clear (despite the points they have in common, they are tools that complement each other in their main tasks). On the one hand we have a powerful calculation tool to build tables of data with a lot of volume, such as Excel, and on the other hand a tool that is capable of understanding the Excel language to connect or directly import the tables, and be able to build from from that data, visual reports that can be shared with other users, where we can give other people the opportunity to collaborate with our reports. That's Power Bi. A tool that works outside of the Office suite, but specifically enjoys a healthy, perfect and complementary marriage with Microsoft Excel.
Differences between Excel and Power Bi
We are going to see below the main differences between Excel and Power Bi that will help us better understand the capabilities of each tool and finish answering why they are tools that fit into the same work scheme.
- Different core or main functions: While Excel is focused on calculation tasks, on being able to perform tables with operations and formulas with the information from a table or range of data, Power BI's main task is data analysis through the options visualization to build reports and dashboards.
- Collaboration: Power BI was designed to be able to work individually, creating reports and dashboards, but also collectively, thinking of work groups and organizations where there is a workflow between several people or groups of people. Thinking that the reports can be edited by several users at the same time, that it is possible to work collaboratively.
- Data modeling and advanced data analysis functions: Power BI has among its many functions, advanced data analysis options: You can create custom measures, perform advanced modeling and calculations. Both Excel and Power Bi have functions focused on data analysis, but Power Bi focuses on more advanced options to offer solutions, especially in the professional field.
- Intuitive and more agile visual tool: When it comes to building reports, Power Bi is postulated as a more intuitive option to be able to make reports in panels, easier to use to build a Dashboard.
- Focus on Visualization: Power BI, as we have mentioned, focuses not so much on calculation operations, but on the construction of visual reports that can be easily built and edited, which can be combined with tables and data segmentation to create very visual reports. Excel can also meet expectations in visual reporting in combination with pivot tables. But let's say that this is the core of Power Bi, where it has been built from the weaknesses of Excel in this regard, to offer more advanced and practical options, easy to perform.
- Automation: Automation is a fundamental rule when working with data and information. Because? Simply to be able to avoid common mistakes of people with technology, such as updating some data. The concept of data range in Power Bi has no place, because Power Bi works more on the structure of the information that we import or connect, that is, with the information in the columns. In Excel, and as we saw in the course of the dynamic tables, a solution to this problem has already been given by creating Excel tables, precisely an Excel function that is rarely used and very useful when working with data more effectively. reducing the margin of error, as a solution to the already ranges of data that are likely to not be updated. Automation in Power Bi, acquires a different dimension,
- Connections with platforms and formats allowed: Power BI, as we have mentioned, has connection and understanding skills with other calculation tools, databases, and third-party applications in the cloud. These features make Power Bi a unique and all-terrain tool for absorbing data, almost no matter where that data is, and what format it's saved in. Obviously not all formats and applications have a place in Power Bi, but the most important ones do. And as we already know by now, full understanding with Excel. When we import an Excel file, as we will see below, Power Bi can identify the tables, the structure with the columns as well as the information in the tables; How It is also capable of absorbing the entirety of an Excel file that, for example, has several Excel sheets,
When starting to work in Power Bi, as we already discussed in what Power Bi is, we can work with the data connection, or with the import mode (data import) in Power Bi Desktop. By importing the data from an Excel file, we can start working with the data, performing data transformation, modeling or building reports and visual panels.
This being the first step to be able to start working with the data from within Power Bi, we are going to explain below what is the process to be able to import an Excel file into Power Bi. What steps are necessary to be able to integrate our Excel sheet in Power Bi Desktop.
How to insert an Excel into Power Bi
To get started with Power Bi, follow these simple steps. Next we are going to see the simple process so that we can import Excel sheets into Power Bi and we can start working within the Power Bi Desktop tool:
- The first thing you have to do is install Power Bi Desktop on your PC, as we explained in how to install Power Bi Desktop.
- To start using it is not necessary, but it is important that you have a Power Bi license. You can start with the free version, and if you need it later, upgrade to have greater capacity and be able to share and collaborate in other work areas. As we already explained in the different types of Power Bi licenses, you can create a Power Bi account by accessing the following link.
Power Bi Service: create your Power Bi account
Once these simple steps have been completed, and we have installed Power Bi and created a Power Bi account, we are going to open Power Bi Desktop.

Once Power Bi Desktop is open, we will be able to import an Excel file. In order to import the Excel file, we are going to go to the horizontal menu, and we will click on “Excel Workbook”

When we click on “Excel workbook”, a window will open where we have to choose the Excel file that we want to import into Power Bi. Select the document, and click on the button at the bottom right "open"
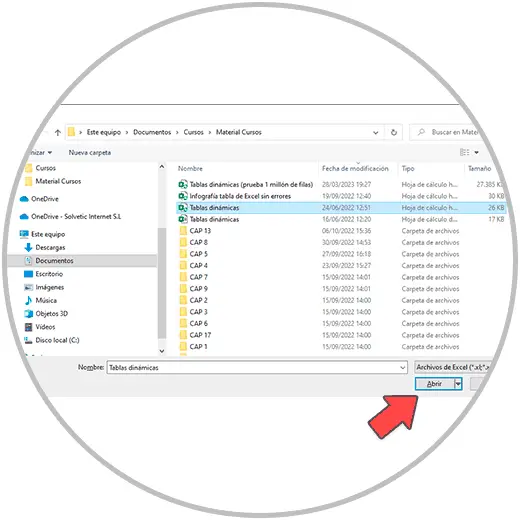
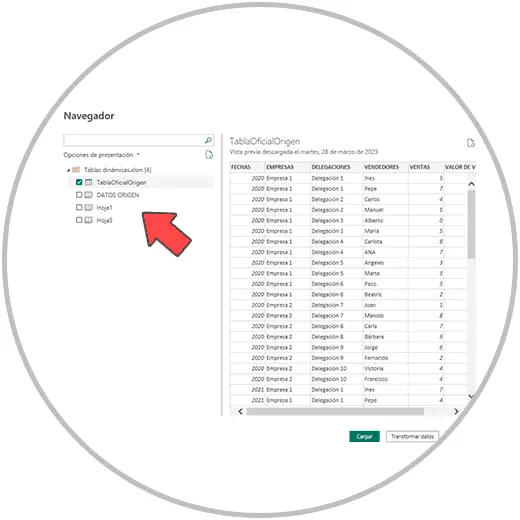
In the next step, after clicking open, a window will open where we have to choose if we want to import the entire document, or just some sheet of the Excel file. We select the sheets of the document to import in the left side menu, and to continue we will click on the button that says "load".
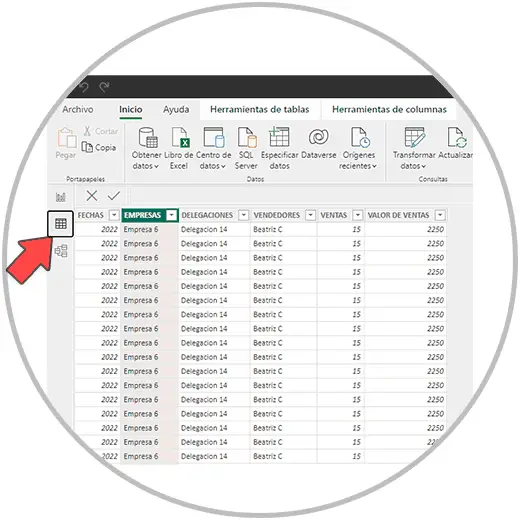
Once we click “upload”, the import process will take a few seconds. When the import is finished, we will have to go to the Power Bi data module, which, as indicated in the image below, is an icon that we will find on the left side of our screen.
As we explained in the differences between import and Direct Query in Power Bi, the import method is the most common way to work with data in Power Bi to later make reports.
One of the advantages of importing data into Power Bi is, as we already explained, being able to work with much more agility when making queries. But another of the advantages without a doubt is that of being able to transform the data, once they are already imported into the Power Bi Desktop tool.
When we have carried out the last step in the data import, to the right of the open button we had another option, which is to “transform the data”; An option that Power Bi offers us in the data import mode to be able to shape the imported data and make some changes before modeling the data and making the reports.
With the transformation of the data, Power Bi offers us the possibility of making some changes designed to give the appropriate format, a last review and change in some aspects so that the information that we will see in the reports later, is seen with the desired format. . There are some changes that we can make in the columns, in the names of the columns, in the formats of the cells of each column, for example, you transform text into a number, format a column with date and time information, for example. Even importing, for example, an entire document, an Excel file with all its sheets, we can choose in each case which sheet or sheets of our old Excel we want to work with, and in the case of a specific Excel sheet,
This step, that of transforming the data into Power Bi, is a necessary step before carrying out modeling and reporting, and we will explain it to you later in detail.
As we have explained, Excel and Power Bi are tools that in some aspects have similar characteristics. However, we must understand that above all, they are complementary tools that can and should coexist in a work environment when working with data, making reports, and above all analyzing data are among our job duties.
Your reports, data and information that you save in Excel documents, can be molded and modeled in Power Bi to shape and build visual reports that, above any adjective that we can put, the professional predominates. Professional reports that you can share and use for your own benefit to carry out situation analysis, and that you can use to filter the information or display it in the desired way.
Power Bi is a Business Intelligence tool as we have explained. Its use and management can help you make a name for yourself in the world of work, in analytical work environments. In a world where we handle more and more data, tools like Power Bi, capable of processing and shaping data in an intuitive and professional way, will help you make a difference. If we are already working with numbers, surely Power Bi will open the doors to be a more productive person in the preparation of reports and analysis.
Automation is and should be an aspect to give priority when working with data to avoid errors and be more productive and efficient. In a world where we are half taught to handle the basics of tools like Excel, knowledge and management of tools like Power Bi will undoubtedly help us in that sense to raise the level, make a difference, be more productive, efficient. To be, in short, a data professional, more professional.